


 |
市场调查报告书
商品编码
1906937
氦气:市场占有率分析、产业趋势与统计、成长预测(2026-2031)Helium - Market Share Analysis, Industry Trends & Statistics, Growth Forecasts (2026 - 2031) |
||||||
※ 本网页内容可能与最新版本有所差异。详细情况请与我们联繫。
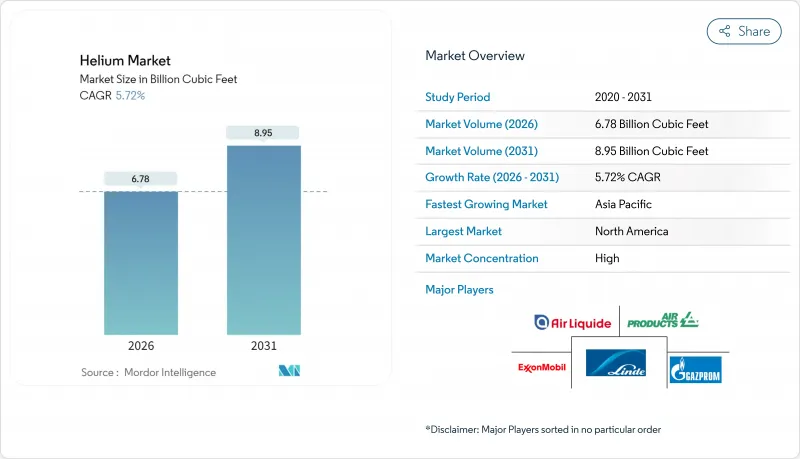
2025年氦气市场价值将达到64.1亿立方英尺,预计到2026年将成长至67.8亿立方英尺,到2031年将成长至89.5亿立方英尺。
预计在预测期(2026-2031 年)内,复合年增长率将达到 5.72%。
这主要得益于半导体製造、医疗成像、商业航太发射和量子计算等领域的强劲需求,这些领域都依赖氦气的超低沸点和化学惰性。由于全球氦气生产由不到15家生产商控制,以及美国联邦氦气储备于2024年私有化,取消了补贴储备,氦气市场持续面临供应波动。南非、卡达和俄罗斯的新增产能暂时缓解了供不应求,但结构性集中仍然促使用户更加关注长期合约和循环投资。美国《晶片法案》(CHIPS Act)、欧洲《晶片法案》以及一些亚洲政府奖励计划推动了半导体产能的扩张,从而刺激了需求;同时,中等收入国家核磁共振造影系统的普及也帮助医疗保健行业保持了其作为最大终端用户的地位。
全球氦气市场趋势与洞察
东亚半导体製造厂建设快速扩张
中国大陆、台湾、日本和韩国的晶圆代工厂扩张正在推动氦气市场的发展。半导体晶圆厂依赖气态氦进行晶圆清洗、光刻气氛控制和电浆蚀刻。英特尔、台积电和三星正在美国和亚洲建造新的晶圆厂,这些晶圆厂的建设资金来自《晶片製造和整合计画法案》(CHIPS Act)和区域性计画。每座晶圆厂在运作週期内都需要数亿标准立方英尺的高纯度氦气。台湾地区的产业群聚效应进一步放大了该地区的氦气需求,因为先进的封装生产线在晶粒键合和封装製程中需要消耗氦气。总体而言,随着製程节点的不断缩小,半导体消费量也在增加,这将确保到2030年氦气市场的需求保持两位数成长。
扩大中等收入国家核磁共振造影系统的使用
儘管消费量氦量更少的新技术问世,亚太、拉丁美洲和非洲的医院仍在不断安装核磁共振造影系统,以满足慢性病诊断的需求。传统的1.5吨重的MRI设备在安装过程中需要1500至2000公升液氦,在运作使用寿命期间的耗氦量高达1万升。可回收92%蒸发气体的节能型设备在三级医疗机构中越来越受欢迎,但其近10万美元的初始成本限制了其在学术机构的应用。通用电气医疗集团的「Freelium」和西门子医疗的「DryCool」平台可将氦气消耗量降低99%,但由于设备更新换代速度缓慢,预计未来十年传统磁铁系统仍将是主流。
蕴藏量有限且集中在少数国家
已知氦气蕴藏量约70%集中在美国、卡达、阿尔及利亚和俄罗斯,地缘政治影响和供应操纵对氦气市场有直接影响。中国95%的氦气需求依赖进口,使其面临外交摩擦和海上物流风险。欧盟对俄罗斯氦气的製裁就是一个鲜明的例子,说明政策如何能大幅改变贸易路线并推高价格。随着脱碳政策导致天然气产量下降,与天然气伴生的氦气很可能继续被封存在地下。回收可以减少废弃物,但并不能创造新的原生氦气供应,进一步凸显了策略储备的必要性。
细分市场分析
到2025年,气态氦将占总销售量的70.65%,这反映了其在增压、吹扫和洩漏测试等领域的广泛应用。由于先进製程节点对污染容忍度要求更加严格,气态氦正以6.03%的复合年增长率成长,从而保持其在製程气体市场的领先地位。此外,航太焊接和积层製造流程也受益于氦气的高导热性,这些製程能够实现深而窄的焊接轮廓,从而推动了气态氦市场的发展。
氢燃料测试和电动车电池洩漏检测等新兴应用将推动需求成长,进一步巩固气态氦在预测期内的市场主导地位。核磁共振造影系统的增加、量子系统的规模化应用以及高能量物理实验室的发展将支持液氦的基础设施需求。儘管现场液化设备和效率高达92%的回收撬装设备的日益普及将减少蒸发损失,但绝对需求仍将持续成长。
此氦气报告按状态(液态氦、气态氦)、应用(呼吸混合物、低温技术、洩漏检测、加压和吹扫、焊接等)、终端用户行业(航太航天、电子半导体、核能、医疗、焊接和金属加工等)以及地区(亚太地区、北美、欧洲等)进行分析。
区域分析
2025年,北美将占据全球38.55%的市场份额,这得益于其全球最大的已探明蕴藏量和成熟的中游基础设施。 2024年联邦氦气储备私有化改变了采购环境,迫使终端用户直接与私营生产商以市场价格进行谈判,但Honeywell的Dry Pine计划和落基山脉的小规模计划正在填补这一缺口。亚利桑那州、俄亥俄州和德克萨斯州半导体工厂的建设进一步推动了区域消费成长。
预计到2031年,亚太地区将以7.05%的复合年增长率实现最高成长,主要得益于中国、日本、印度和韩国半导体、卫星製造和医疗影像设备生产的扩张。中国95%的进口依赖促使其将合约多元化和在工业园区部署微液化设备视为战略要务。日本对下一代记忆体製造厂的激励措施正在推动氦气支出,而印度新兴的製造生态系统和蓬勃发展的医疗产业也在推动需求。对传统型氦矿(主要位于澳洲和坦尚尼亚)的区域投资旨在对冲供应风险。
由于制裁导致俄罗斯氦气供应中断,欧洲正面临供应链结构重组。儘管供应有限,终端用户正从卡达和美国墨西哥湾沿岸采购氦气,并透过增加运输成本和建立本地回收设施来应对价格波动。
其他福利:
- Excel格式的市场预测(ME)表
- 3个月的分析师支持
目录
第一章 引言
- 研究假设和市场定义
- 调查范围
第二章调查方法
第三章执行摘要
第四章 市场情势
- 市场概览
- 市场驱动因素
- 东亚半导体製造厂建设快速扩张
- 扩大核磁共振造影系统的应用:中等收入医院的发展
- 商业航太发射的蓬勃发展增加了对液态氦的需求。
- 量子计算低温恆温器从实验室走向中试生产线
- 用于中子探测和核融合研究与开发的试点规模氦-3提取。
- 市场限制
- 蕴藏量有限且集中在少数国家
- 替代方案的液化和物流成本高
- 更严格的废气法规限制了氦气的共同生产。
- 价值链分析
- 波特五力模型
- 供应商的议价能力
- 消费者议价能力
- 新进入者的威胁
- 替代品的威胁
- 竞争程度
第五章 市场规模与成长预测
- 按阶段
- 液态氦
- 氦气
- 透过使用
- 呼吸气体混合物
- 低温学
- 洩漏检测
- 增压和排气
- 焊接
- 受控气氛
- 其他用途
- 按最终用户行业划分
- 航太/飞机
- 电子和半导体
- 核能发电
- 卫生保健
- 焊接与金属加工
- 其他终端用户产业
- 按地区
- 亚太地区
- 中国
- 印度
- 日本
- 韩国
- 马来西亚
- 台湾
- 泰国
- 印尼
- 越南
- 澳洲
- 纽西兰
- 亚太其他地区
- 北美洲
- 美国
- 加拿大
- 墨西哥
- 欧洲
- 德国
- 英国
- 义大利
- 法国
- 波兰
- 西班牙
- 俄罗斯
- 其他欧洲地区
- 南美洲
- 巴西
- 阿根廷
- 其他南美洲
- 中东和非洲
- 沙乌地阿拉伯
- 埃及
- 南非
- 其他中东和非洲地区
- 亚太地区
第六章 竞争情势
- 市场集中度
- 策略趋势
- 市占率(%)/排名分析
- 公司简介
- Air Liquide
- Air Products and Chemicals, Inc.
- AIR WATER INC
- Buzwair Industrial Gases Factories
- ExxonMobil Corporation
- Gazprom
- Gulf Cryo
- Iwatani Corporation
- Linde plc
- Matheson Tri-Gas Inc.
- Messer Group
- North American Helium
- PGNiG SA
- QatarEnergy LNG
- Renergen
- Weil Group Resources
第七章 市场机会与未来展望
The Helium Market was valued at 6.41 Billion Cubic Feet in 2025 and estimated to grow from 6.78 Billion Cubic Feet in 2026 to reach 8.95 Billion Cubic Feet by 2031, at a CAGR of 5.72% during the forecast period (2026-2031).
Robust demand stems from semiconductor manufacturing, medical imaging, commercial space launch, and quantum computing, each relying on helium's ultra-low boiling point and chemical inertness. The helium market continues to face supply volatility because fewer than 15 producers dominate global output, and the 2024 privatization of the U.S. Federal Helium Reserve removed subsidized stock from the system. New capacity from South Africa, Qatar, and Russia is temporarily easing scarcity, but structural concentration keeps users focused on long-term contracts and recycling investments. Semiconductor capacity additions under the U.S. CHIPS Act, the European Chips Act, and multiple Asian government incentive programs intensify demand, while MRI fleet growth in mid-income nations sustains healthcare's position as the largest end-user.
Global Helium Market Trends and Insights
Explosive Semiconductor Fab Build-Out in East Asia
Foundry expansions in China, Taiwan, Japan, and South Korea are propelling the helium market as chip plants rely on gaseous helium for wafer cleaning, lithography atmosphere control, and plasma etching. Intel, TSMC, and Samsung are building new U.S. and Asian fabs funded by the CHIPS Act and parallel regional programs, each fab requiring hundreds of millions of standard cubic feet of high-purity helium over its lifecycle. Taiwan's clustering effect compounds regional demand, as advanced packaging lines consume helium for die bonding and encapsulation. Overall, semiconductor consumption intensity increases with each node shrink, locking in double-digit demand growth for the helium market through 2030.
MRI Fleet Expansion Across Mid-Income Hospitals
Hospitals in Asia-Pacific, Latin America, and Africa are adding MRI scanners to meet chronic disease diagnostics despite newer helium-light technologies. A conventional 1.5-ton unit needs 1,500-2,000 liters of liquid helium at installation and up to 10,000 liters across its service life. Helium conservation skids that recapture 92% of boil-off gas are spreading to tertiary hospitals, although upfront costs near USD 100,000 restrict adoption mainly to teaching centers. GE HealthCare's Freelium and Siemens Healthineers' DryCool platforms cut helium usage by 99%, yet slow fleet turnover leaves conventional magnets dominant into the next decade.
Finite Reserves and Concentration in a Few Countries
Roughly 70% of known helium reserves sit in the United States, Qatar, Algeria, and Russia, fostering geopolitical leverage and supply manipulation that directly influence the helium market. China imports 95% of its helium needs, underscoring exposure to diplomatic friction and maritime logistics risks. EU sanctions on Russian helium illustrate how quickly policy can reroute trade and spike prices. Co-produced helium may remain trapped underground as natural-gas production tapers under decarbonization agendas. Recycling can cut wastage, but cannot create a new primary supply, reinforcing the imperative for strategic reserves.
Other drivers and restraints analyzed in the detailed report include:
- Commercial Space-Launch Boom Raising Liquid-He Demand
- Quantum-Computing Cryostats Moving from Lab to Pilot Lines
- Tightened Flare-Gas Rules Limiting Co-Produced Helium
For complete list of drivers and restraints, kindly check the Table Of Contents.
Segment Analysis
Gaseous helium held 70.65% of the 2025 volume, reflecting large-scale use in pressurization, purging, and leak-testing, and is growing at a 6.03% CAGR as leading-edge nodes tighten contamination tolerances, sustaining a substantial share of the helium market size for process gases. The gaseous segment also benefits from aerospace welding and additive-manufacturing processes that rely on helium's high thermal conductivity for deep, narrow weld profiles.
Emerging hydrogen-fuel testing and electric-vehicle battery leak detection add incremental volumes, extending gaseous helium's dominance well into the forecast horizon across the helium market. MRI fleet expansion, quantum-system scale-out, and high-energy physics laboratories anchor baseline liquid helium demand. Increasing deployment of on-site liquefiers and 92% efficient recovery skids mitigates boil-off losses, but absolute volumes continue to rise.
The Helium Report is Segmented by Phase (Liquid Helium, and Gaseous Helium), Application (Breathing Mixes, Cryogenics, Leak Detection, Pressurizing and Purging, Welding, and More), End-User Industry (Aerospace and Aircraft, Electronics and Semiconductor, Nuclear Power, Healthcare, Welding and Metal Fabrication, Other End-User Industries), and Geography (Asia-Pacific, North America, Europe, and More).
Geography Analysis
North America commanded 38.55% of 2025 volume, supported by the world's largest proven reserves and mature midstream infrastructure. The Federal Helium Reserve privatization in 2024 shifted the procurement landscape, compelling end-users to negotiate directly with private producers at market rates, but Honeywell's Dry Piney and smaller Rockies projects are filling the gap. Semiconductor fab construction in Arizona, Ohio, and Texas further supports regional consumption growth.
Asia-Pacific is projected to post the highest 7.05% CAGR through 2031 as China, Japan, India, and South Korea ramp up semiconductors, satellite manufacturing, and medical imaging. China's 95% import dependence creates a strategic imperative for contract diversification and micro-liquefier deployment at industrial parks. Japan's incentive packages for next-generation memory plants accelerate helium spending, while India's nascent fab ecosystem and fast-growing healthcare sector widen demand. Regional investment in unconventional helium fields, notably in Australia and Tanzania, aims to hedge supply exposure.
Though smaller in volume, Europe faces structural supply restructuring after sanctions eliminated Russian helium flows. End-users now source from Qatar and the U.S. Gulf Coast, absorbing freight premiums and installation of on-site recovery to cushion volatility.
- Air Liquide
- Air Products and Chemicals, Inc.
- AIR WATER INC
- Buzwair Industrial Gases Factories
- ExxonMobil Corporation
- Gazprom
- Gulf Cryo
- Iwatani Corporation
- Linde plc
- Matheson Tri-Gas Inc.
- Messer Group
- North American Helium
- PGNiG SA
- QatarEnergy LNG
- Renergen
- Weil Group Resources
Additional Benefits:
- The market estimate (ME) sheet in Excel format
- 3 months of analyst support
TABLE OF CONTENTS
1 Introduction
- 1.1 Study Assumptions and Market Definition
- 1.2 Scope of the Study
2 Research Methodology
3 Executive Summary
4 Market Landscape
- 4.1 Market Overview
- 4.2 Market Drivers
- 4.2.1 Explosive Semiconductor Fab Build-Out in East Asia
- 4.2.2 MRI Fleet Expansion across Mid-Income Hospitals
- 4.2.3 Commercial Space-Launch Boom Raising Liquid-He Demand
- 4.2.4 Quantum-Computing Cryostats Moving from Lab to Pilot Lines
- 4.2.5 Pilot-Scale Helium-3 Extraction for Neutron Detection and Fusion Research and Development
- 4.3 Market Restraints
- 4.3.1 Finite Reserves and Concentration In A Few Countries
- 4.3.2 High Liquefaction and Logistics Costs Vs. Substitutes
- 4.3.3 Tightened Flare-Gas Rules Limiting Co-Produced Helium
- 4.4 Value Chain Analysis
- 4.5 Porter's Five Forces
- 4.5.1 Bargaining Power of Suppliers
- 4.5.2 Bargaining Power of Consumers
- 4.5.3 Threat of New Entrants
- 4.5.4 Threat of Substitutes
- 4.5.5 Degree of Competition
5 Market Size and Growth Forecasts (Volume)
- 5.1 By Phase
- 5.1.1 Liquid Helium
- 5.1.2 Gaseous Helium
- 5.2 By Application
- 5.2.1 Breathing Mixes
- 5.2.2 Cryogenics
- 5.2.3 Leak Detection
- 5.2.4 Pressurizing and Purging
- 5.2.5 Welding
- 5.2.6 Controlled Atmosphere
- 5.2.7 Other Applications
- 5.3 By End-User Industry
- 5.3.1 Aerospace and Aircraft
- 5.3.2 Electronics and Semiconductor
- 5.3.3 Nuclear Power
- 5.3.4 Healthcare
- 5.3.5 Welding and Metal Fabrication
- 5.3.6 Other End-User Industries
- 5.4 By Geography
- 5.4.1 Asia-Pacific
- 5.4.1.1 China
- 5.4.1.2 India
- 5.4.1.3 Japan
- 5.4.1.4 South Korea
- 5.4.1.5 Malaysia
- 5.4.1.6 Taiwan
- 5.4.1.7 Thailand
- 5.4.1.8 Indonesia
- 5.4.1.9 Vietnam
- 5.4.1.10 Australia
- 5.4.1.11 New Zealand
- 5.4.1.12 Rest of Asia-Pacific
- 5.4.2 North America
- 5.4.2.1 United States
- 5.4.2.2 Canada
- 5.4.2.3 Mexico
- 5.4.3 Europe
- 5.4.3.1 Germany
- 5.4.3.2 United Kingdom
- 5.4.3.3 Italy
- 5.4.3.4 France
- 5.4.3.5 Poland
- 5.4.3.6 Spain
- 5.4.3.7 Russia
- 5.4.3.8 Rest of Europe
- 5.4.4 South America
- 5.4.4.1 Brazil
- 5.4.4.2 Argentina
- 5.4.4.3 Rest of South America
- 5.4.5 Middle-East and Africa
- 5.4.5.1 Saudi Arabia
- 5.4.5.2 Egypt
- 5.4.5.3 South Africa
- 5.4.5.4 Rest of Middle-East and Africa
- 5.4.1 Asia-Pacific
6 Competitive Landscape
- 6.1 Market Concentration
- 6.2 Strategic Moves
- 6.3 Market Share (%)/Ranking Analysis
- 6.4 Company Profiles (includes Global level Overview, Market level overview, Core Segments, Financials as available, Strategic Information, Market Rank/Share for key companies, Products and Services, and Recent Developments)
- 6.4.1 Air Liquide
- 6.4.2 Air Products and Chemicals, Inc.
- 6.4.3 AIR WATER INC
- 6.4.4 Buzwair Industrial Gases Factories
- 6.4.5 ExxonMobil Corporation
- 6.4.6 Gazprom
- 6.4.7 Gulf Cryo
- 6.4.8 Iwatani Corporation
- 6.4.9 Linde plc
- 6.4.10 Matheson Tri-Gas Inc.
- 6.4.11 Messer Group
- 6.4.12 North American Helium
- 6.4.13 PGNiG SA
- 6.4.14 QatarEnergy LNG
- 6.4.15 Renergen
- 6.4.16 Weil Group Resources
7 Market Opportunities and Future Outlook
- 7.1 White-space and Unmet-need Assessment
 氦气市场:2026-2032年全球市场预测(依产品形态、来源、等级、应用及通路划分)
 全球氦气市场规模、份额、趋势和成长分析报告(2026-2034年)氦气市场规模、份额、成长及全球产业分析:按类型、应用和地区划分,并预测至2026-2034年
 2026年全球氦气市场报告
 氦气市场规模、份额和成长分析(按阶段、应用、最终用途和地区划分)—2026-2033年产业预测
 氦气市场 - 全球产业规模、份额、趋势、机会和预测,按阶段、按应用、按最终用户、按地区和竞争进行细分,2020-2030 年
 氦气市场规模、份额、趋势分析报告:按阶段、应用、最终用途、地区、细分市场预测,2025-2030 年
 全球氦气市场(2025-2035)
 氦气市场规模和预测、全球和地区份额、趋势和成长机会分析报告范围:按类型、应用、最终用途行业和地理位置
 到 2030 年氦气市场预测:按阶段、分销管道、应用、最终用户和地区进行的全球分析