


 |
市场调查报告书
商品编码
1906996
本安型设备(IS设备):市场占有率分析、产业趋势与统计、成长预测(2026-2031年)Intrinsically Safe Equipment (IS Equipment) - Market Share Analysis, Industry Trends & Statistics, Growth Forecasts (2026 - 2031) |
||||||
※ 本网页内容可能与最新版本有所差异。详细情况请与我们联繫。
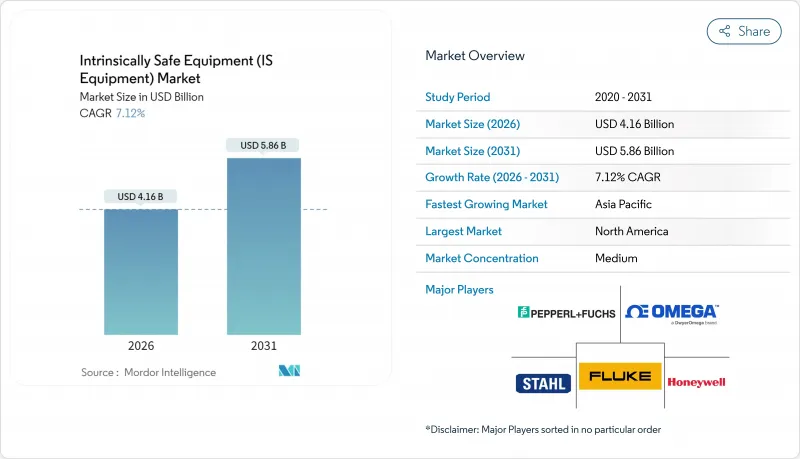
预计到 2025 年,本质安全设备(IS 设备)市场规模将达到 38.8 亿美元,从 2026 年的 41.6 亿美元成长到 2031 年的 58.6 亿美元,在预测期(2026-2031 年)内,复合年增长率将达到 7.12%。
这种扩张反映了从笨重、防爆外壳向数位化、本质安全架构的转变,后者将合规性与工业4.0连接性结合。日益严格的全球标准、采矿和加工产业的扩张,以及无线模组使得以往被认为无利可图的维修计划得以实现,都推动了市场需求的加速成长。虽然石油和天然气业者仍然是主要客户,但随着易挥发溶剂被引入生产线,离散元件製造商也正在采用经过认证的自动化技术。由于设施所有者在选择新系统时会考虑生命週期成本、供应链稳定性以及预测性维护能力,因此,同时掌握认证和网路安全技术的公司将获得最大的价值。
全球本质安全型设备(IS设备)市场趋势与洞察
世界各地日益严格的防爆安全法规
2024年1月发布的IEC 60079-11第七版引入了173项技术修订,包括更严格的电池测试以及禁止在IIC类环境中使用催化感测器,从而鼓励对现有装置进行维修。 EN IEC 60079-11:2024于2024年12月在欧盟官方公报上发布,为强制升级设定了明确的时间表,因为2012版将于2027年12月之前停止使用。跨国公司正争相遵守ATEX和IECEx文件要求,但儘管技术上已趋于一致,提交时间表的同步仍未实现。该法规的适用范围也从设备扩展到IEC 60079-14:2024规定的现场布线,从而推动了对认证安装和再认证服务的需求。随着营运商更换不符合新法规的设备并签订符合新法规的长期维护合同,这些发展正在推动本质安全设备市场的成长。
工业4.0推动对本质安全型感测器和仪器的需求
数位化转型推动了对危险区域即时数据采集的日益增长的需求,而本质安全型感测器则成为实现这一目标的关键技术。乙太网路APL技术允许透过单一双绞线传输长达1公里的电力和数据,使工厂业主能够在1区和2区安装智慧仪器,而不会影响效能。无线节点降低了布线成本并简化了维修,例如SmartPower模组,即使在恶劣环境下也能提供长达数年的电池寿命。地下矿井正在使用这些设备将气体浓度和资产状态即时传输到地面作业中心,将安全保障从一系列定期检查转变为持续监测。同样的架构也是预测性维护的基础,边缘分析技术能够侦测异常振动并在故障发生前发出服务需求讯号。这使得设施业主能够同时确保合规性和提高生产力,从而加速亚太地区和波湾合作理事会(GCC)国家的采购。
高昂的认证成本和复杂的设计
每款产品获得ATEX认证的费用在1.5万至5万欧元之间,而IECEx测试则需额外花费2万至6万美元,迫使中小企业退出竞争。第七版法规的变更要求进行额外的电池压力测试、火花点火测试和元件间距测试,这通常需要多次修改设计。企业还必须维持ISO 9001认证和品质保证审核才能保持认证有效,这增加了每条产品线的持续营运成本。这些费用使得竞争向拥有内部实验室和专门合规团队的跨国公司倾斜,集中了智慧财产权,并阻碍了新进入者。新兴市场的供应商处境最为艰难,因为缺乏本地实验室能力迫使他们将测试转移到海外,从而延长了前置作业时间并加重了预算负担。
细分市场分析
截至2025年,1区应用将占本质安全设备市场的38.15%,证实了其在炼油厂和化工厂的普遍应用,这些场所的维护过程中会产生爆炸性气体环境。由于传统布线与新型物联网设备结合,简化了预测性维护,1区支出将保持稳定。同时,0区将呈现8.31%的复合年增长率,因为印刷感测器和无线集线器最终实现了在持续存在可燃性气体的环境中进行即时监测。这一增长表明人们的观念正在从隔离转向主动风险缓解,尤其是在海底油井和製药反应器等停机成本远超设备溢价的场所。 2区在装卸码头和仓库中仍然至关重要,这些场所需要低成本的合规解决方案。同时,粉尘较多的20-22区的需求正随着食品和製药企业对自动化投资的增加而温和成长。供应商目前正在开发模组化基板,这些电路板可以透过韧体或熔断器的变更来满足多个区域的要求,从而缩短开发週期并减少库存。
经1区认证的无线网关现在可以透过单线乙太网路与安全区域内的历史系统进行连接,无需额外的电缆配线架即可扩展本质安全设备市场支援的终端范围。整合商非常青睐这些网关,因为它们可以减少复杂屏障运算所需的工程时间。随着标准机构不断完善多气体和多粉尘区域的指南,跨区域架构将成为设计最佳实践,从而确保即使在当前维修需求高峰过后,0区产品的出货量仍能保持两位数的成长。
1 类系统主要针对气体和蒸气危害,预计到 2025 年将占总收入的 62.10%,并在 2031 年前以 8.76% 的复合年增长率增长,这主要得益于对甲烷检测、氢气洩漏监测和液化天然气 (LNG) 处理感测器升级的需求。营运商透过对管道进行改造,加装光学气体成像摄影机和本质安全型边缘盒,显着缩短了维修时间,这些设备可提供基于人工智慧的现场洩漏量化分析。 2 类粉尘控制设备在生质能发电厂和积层製造厂找到了新的买家,这些场所先前忽略了细粉尘的点燃风险。随着越来越多的国家采用基于 NFPA 652 标准的法规,2 类本质安全型设备的市场规模预计将温和成长。
3 类应用目前仍属于小众领域,尤其是在纺织和木工行业,但由于日益自动化的切割线排放的空气中纤维,市场需求正在趋于稳定。供应商正寻求透过更换垫圈和添加防尘过滤器来重复利用 1 类设计,从而降低测试成本。乙太网路 APL 尤其受到 1 类系统的青睐,因为气体组的额定功率高于粉尘组,从而简化了交换器的部署。这种相容性进一步巩固了 1 类系统作为新型本质安全网路概念试验场的地位,而这些概念最终也将扩展到粉尘和纺织业。
本质安全设备报告按区域(例如,0 区、20 区、1 区)、等级(例如,1 级、2 级、3 级)、产品类型(例如,感测器、检测器、开关)、最终用户(例如,石油天然气、采矿、电力和公共产业、化学和石化、加工和製造)以及地区进行细分。市场预测以美元价值 (USD) 为单位。
区域分析
预计到2025年,北美地区将占霍尼韦尔总收入的38.20%,这主要得益于美国职业安全与健康管理局 (OSHA) 和美国消防协会 (NFPA) 的相关法规支持页岩盆地、墨西哥湾沿岸炼油厂和地下矿山持续推进现代化改造。Honeywell在2024年进行了重组,将其感测和安全技术合併为一个自动化部门,这表明这家领先的供应商正致力于提供一套软硬体一体化的解决方案,以满足安全性和生产力的双重需求。此外,美国营运商也主导部署本质安全型LTE/5G网关,以应对劳动力短缺问题。
预计到2031年,亚太地区将以8.55%的复合年增长率实现最快成长,主要得益于中国新建炼油厂、印度石化产业扩张以及澳洲大规模铜锂矿开采。各国政府正将出口许可证与IEC或ATEX合规性挂钩,鼓励本地製造商取得认证组件。中国自动化供应商正与欧洲测试机构合作,缩短认证週期,从而扩大区域供应商生态系统,并刺激本质安全设备市场的发展。欧洲现有大规模设施均符合ATEX指令,预计到2027年将强制实施EN IEC 60079-11:2024标准,这将加速设备更新换代。德国在先进化工联合体领域主导,这些联合体整合了跨境区域感测器网络,以满足排放目标。英国和挪威继续投资于符合北海过渡管理局製定的本质安全和网路安全法规的近海设备。在其他地区,中东国家石油公司 (NOC) 在大型天然气计划中推出本质安全型 SCADA 系统升级等区域趋势,以及巴西糖厂和乙醇蒸馏厂从防爆电机转向本质安全型变频驱动装置以降低能源消耗等趋势,共同支撑了强劲的全球需求。
其他福利:
- Excel格式的市场预测(ME)表
- 3个月的分析师支持
目录
第一章 引言
- 研究假设和市场定义
- 调查范围
第二章调查方法
第三章执行摘要
第四章 市场情势
- 市场概览
- 市场驱动因素
- 严格的全球防爆安全法规
- 工业4.0推动了对IS感测器和测量设备的需求。
- 不断扩大的石油、天然气和采矿活动
- 从 Ex d 架构迁移到 Ex i 架构以降低防爆成本
- 用于远端和预测性维护的无线资讯系统模组的成长
- 印刷式超低功耗感测器阵列开闢了维修市场
- 市场限制
- 高昂的认证成本和复杂的设计
- 不同地区的核准时间不同
- IS认证电子元件短缺
- 资讯系统无线设备的网路安全措施成本不断上升
- 产业价值链分析
- 监管环境
- 技术展望
- 波特五力分析
- 新进入者的威胁
- 买方的议价能力
- 供应商的议价能力
- 替代品的威胁
- 竞争对手之间的竞争
第五章 市场规模与成长预测
- 按区域
- 0区
- 20区
- 1区
- 21区
- 2区
- 22区
- 按班级
- 一年级
- 二年级
- 三年级
- 依产品类型
- 感应器
- 检测器
- 转变
- 发送器
- 隔离器和屏障
- LED指示灯
- 其他类型
- 最终用户
- 石油和天然气
- 矿业
- 电力/公共产业
- 化工和石油化工
- 加工/製造
- 其他最终用户
- 按地区
- 北美洲
- 美国
- 加拿大
- 墨西哥
- 南美洲
- 巴西
- 阿根廷
- 南美洲其他地区
- 欧洲
- 德国
- 英国
- 法国
- 西班牙
- 义大利
- 其他欧洲地区
- 亚太地区
- 中国
- 印度
- 日本
- 韩国
- 亚太其他地区
- 中东和非洲
- 中东
- 沙乌地阿拉伯
- 阿拉伯聯合大公国
- 土耳其
- 其他中东地区
- 非洲
- 南非
- 奈及利亚
- 其他非洲地区
- 中东
- 北美洲
第六章 竞争情势
- 市场集中度
- 策略趋势
- 市占率分析
- 公司简介
- Pepperl+Fuchs SE
- Honeywell International Inc.
- ABB Ltd.
- Siemens AG
- Eaton Corporation plc
- Schneider Electric SE
- R. Stahl AG
- BARTEC Top Holding GmbH
- Emerson Electric Co.
- Rockwell Automation Inc.
- MSA Safety Inc.
- Dragerwerk AG and Co. KGaA
- OMEGA Engineering(Spectris plc)
- Fluke Corporation(Fortive)
- Banner Engineering Corp.
- Extronics Ltd.
- CorDEX Instruments Ltd.
- Bayco Products Inc.
- Kyland Technology Co. Ltd.
- Georgin SAS
- ABB Measurement and Analytics(added sub-brand)
- Teledyne FLIR LLC
- PATLITE Corp.
- GM International srl
- RAE Systems by Honeywell
第七章 市场机会与未来展望
The intrinsically safe equipment market was valued at USD 3.88 billion in 2025 and estimated to grow from USD 4.16 billion in 2026 to reach USD 5.86 billion by 2031, at a CAGR of 7.12% during the forecast period (2026-2031).
This expansion traces a shift from heavy flameproof housings toward digitally enabled, intrinsically safe architectures that blend regulatory compliance with Industry 4.0 connectivity. Demand accelerates as global standards tighten, mining and process industries expand, and wireless modules unlock retrofit projects once deemed uneconomic. Oil and gas operators remain the anchor customers, yet discrete manufacturers now adopt certified automation as volatile solvents enter production lines. Companies that master both certification and cybersecurity capture the most value as facility owners weigh lifecycle costs, supply-chain certainty, and predictive-maintenance capabilities when specifying new systems.
Global Intrinsically Safe Equipment (IS Equipment) Market Trends and Insights
Stringent Global Explosion-Safety Regulations
IEC 60079-11 Edition 7, released in January 2024, introduced 173 technical amendments, including tougher battery tests and a ban on catalytic sensors in Group IIC service, compelling retrofit spending across existing installations. EN IEC 60079-11:2024 entered the Official Journal in December 2024, and the prior 2012 edition will be de-harmonized by December 2027, which fixes a clear window for mandatory upgrades. Multinational plants juggle ATEX and IECEx paperwork that still lacks synchronized submission schedules despite technical alignment. The regulation also broadens scope beyond equipment to cover field wiring under IEC 60079-14:2024, stimulating demand for certified installation and recertification services. Together these actions boost the intrinsically safe equipment market as operators replace non-compliant assets and lock in long-term maintenance contracts tied to the new rules.
Industry 4.0-Driven Demand for IS Sensors and Instrumentation
Digital transformation raises the need for real-time data from hazardous zones, positioning intrinsically safe sensors as frontline enablers. Ethernet-APL now carries power and data on a single twisted pair up to 1 km, letting plant owners place smart instruments in Zone 1 and Zone 2 with no performance trade-off. Wireless nodes reduce cabling costs and simplify retrofits, as shown by SmartPower modules that support multi-year battery life in harsh areas. Underground mines adopt these devices to stream gas levels and equipment health to surface operations centers, shifting safety from periodic checks to continuous oversight. The same architecture underpins predictive maintenance, where edge analytics detect abnormal vibrations and flag service needs before breakdowns occur. Facility owners thus gain both compliance assurance and productivity improvements, accelerating purchases across Asia-Pacific and the Gulf Cooperation Council states.
High Certification Cost and Design Complexity
Gaining ATEX approval can cost EUR 15,000-50,000 per variant, and IECEx tests add USD 20,000-60,000, sums that push smaller firms out of contention. Edition 7 rule changes require additional battery stress, spark ignition, and component spacing tests, often driving multiple design revisions. Firms must also maintain ISO 9001 and QA audits to keep certificates active, embedding recurring overhead into each product line. The expense skews competition toward multinationals with in-house labs and dedicated compliance teams, concentrating intellectual property and deterring fresh entrants. Emerging-market suppliers struggle the most, as local labs lack throughput, forcing overseas testing that lengthens lead times and inflates budgets.
Other drivers and restraints analyzed in the detailed report include:
- Expansion of Oil and Gas and Mining Activities
- Cost-Saving Shift from Ex d to Ex i Architectures
- Shortage of Certified IS-Grade Electronic Components
For complete list of drivers and restraints, kindly check the Table Of Contents.
Segment Analysis
Zone 1 applications commanded 38.15% of the intrinsically safe equipment market share in 2025, underscoring their ubiquity in refineries and chemical plants where explosive atmospheres arise during maintenance. Zone 1 spending remains steady as operators blend legacy wiring with new IoT-ready devices that streamline predictive maintenance. In contrast, Zone 0 displays a 8.31% CAGR as printed sensors and wireless hubs finally make real-time monitoring feasible where flammable gases persist continuously. This uptick signals a philosophical shift from isolation toward active risk mitigation, especially in subsea wells and pharmaceutical reactors where downtime costs outweigh device premiums. Zone 2 retains relevance for loading docks and warehouses needing inexpensive compliance solutions, while dust Zones 20-22 gain modest traction in food and pharma sites investing in automation. Suppliers now build modular boards that meet multiple zone requirements via firmware toggles and fuse changes, compressing development cycles and inventory.
Wireless gateways certified for Zone 1 now talk to safe-area historians over single-pair Ethernet. The broader intrinsically safe equipment market therefore enjoys expanded addressable endpoints without extra cable trays. Integrators value such gateways because they reduce engineer-hours on complex barrier calculations. As standards bodies refine guidance for multi-gas, multi-dust areas, zone-crossing architectures will cement themselves as design best practices, ensuring continued double-digit shipments into Zone 0 even after the current retrofit surge subsides.
Class 1 systems focused on gas and vapor hazards held 62.10% of 2025 revenue and are forecast to grow at a 8.76% CAGR through 2031 as methane detection, hydrogen leak monitoring, and LNG handling drive sensor upgrades. Operators retrofit pipelines with optical gas-imaging cameras linked to intrinsically safe edge boxes that perform AI-based leak quantification on site, slashing remediation time. Class 2 dust equipment finds new purchasers in biomass power plants and additive-manufacturing shops, where fine powders present ignition risks previously overlooked. The intrinsically safe equipment market size for Class 2 is projected to expand modestly as more countries adopt NFPA 652-style regulations.
Class 3 applications remain niche, serving textiles and woodworking, yet demand holds steady thanks to rising automation of cutting lines that create airborne fibers. Suppliers aim to reuse Class 1 designs by replacing gaskets and adding dust filters, saving test costs. Ethernet-APL especially benefits Class 1 because gas groups allow higher permissible power than dust, simplifying switch deployment. This compatibility further entrenches Class 1 as the proving ground for new intrinsically safe networking concepts that later trickle to dust and fiber sectors.
The Intrinsically Safe Equipment Report is Segmented by Zone (Zone 0, Zone 20, Zone 1, and More), Class (Class 1, Class 2, and Class 3), Product Type (Sensors, Detectors, Switches, and More), End User (Oil and Gas, Mining, Power and Utilities, Chemical and Petrochemical, Processing and Manufacturing, and More), and Geography. The Market Forecasts are Provided in Terms of Value (USD).
Geography Analysis
North America controlled 38.20% of 2025 revenue as OSHA and NFPA rules anchored continuous modernization across shale basins, Gulf Coast refineries, and underground mines. Honeywell's 2024 reorganization consolidated sensing and safety technologies into a single automation division, signaling that major suppliers aim to deliver unified hardware-software stacks that meet both safety and productivity needs. U.S. operators also lead in adopting intrinsically safe LTE/5G gateways, seeing the technology as a hedge against workforce shortages.
Asia-Pacific posts the fastest 8.55% CAGR through 2031, fueled by new refinery builds in China, petrochemical expansion in India, and large-scale copper and lithium mining in Australia. Governments link export licenses to IEC or ATEX compliance, steering local manufacturers toward certified components. Chinese automation vendors collaborate with European test houses to shorten certification schedules, enlarging the regional supplier ecosystem and boosting the intrinsically safe equipment market. Europe retains a sizable installed base under the ATEX directive, and EN IEC 60079-11:2024 will likely become mandatory by 2027, driving accelerated replacements. Germany leads in advanced chemical complexes, integrating Zone-crossing sensor networks to achieve emissions targets. The United Kingdom and Norway continue to invest in offshore intervention equipment that meets both intrinsic safety and cybersecurity rules dictated by the North Sea Transition Authority. Elsewhere, Middle East NOCs deploy intrinsically safe SCADA upgrades across large gas projects, while Brazilian sugar-ethanol distilleries switch from explosionproof motors to intrinsically safe variable-frequency drives that cut energy use. Collectively these regional narratives sustain robust global demand.
- Pepperl + Fuchs SE
- Honeywell International Inc.
- ABB Ltd.
- Siemens AG
- Eaton Corporation plc
- Schneider Electric SE
- R. Stahl AG
- BARTEC Top Holding GmbH
- Emerson Electric Co.
- Rockwell Automation Inc.
- MSA Safety Inc.
- Dragerwerk AG and Co. KGaA
- OMEGA Engineering (Spectris plc)
- Fluke Corporation (Fortive)
- Banner Engineering Corp.
- Extronics Ltd.
- CorDEX Instruments Ltd.
- Bayco Products Inc.
- Kyland Technology Co. Ltd.
- Georgin SAS
- ABB Measurement and Analytics (added sub-brand)
- Teledyne FLIR LLC
- PATLITE Corp.
- G.M. International srl
- RAE Systems by Honeywell
Additional Benefits:
- The market estimate (ME) sheet in Excel format
- 3 months of analyst support
TABLE OF CONTENTS
1 INTRODUCTION
- 1.1 Study Assumptions and Market Definition
- 1.2 Scope of the Study
2 RESEARCH METHODOLOGY
3 EXECUTIVE SUMMARY
4 MARKET LANDSCAPE
- 4.1 Market Overview
- 4.2 Market Drivers
- 4.2.1 Stringent global explosion-safety regulations
- 4.2.2 Industry 4.0-driven demand for IS sensors and instrumentation
- 4.2.3 Expansion of oil and gas and mining activities
- 4.2.4 Cost-saving shift from Ex d to Ex i architectures
- 4.2.5 Growth of wireless IS modules for remote, predictive maintenance
- 4.2.6 Printed, ultra-low-power sensor arrays unlocking retrofit markets
- 4.3 Market Restraints
- 4.3.1 High certification cost and design complexity
- 4.3.2 Fragmented approval timelines across regions
- 4.3.3 Shortage of certified IS-grade electronic components
- 4.3.4 Rising cybersecurity-compliance cost for IS wireless devices
- 4.4 Industry Value Chain Analysis
- 4.5 Regulatory Landscape
- 4.6 Technological Outlook
- 4.7 Porter's Five Forces Analysis
- 4.7.1 Threat of New Entrants
- 4.7.2 Bargaining Power of Buyers
- 4.7.3 Bargaining Power of Suppliers
- 4.7.4 Threat of Substitutes
- 4.7.5 Intensity of Competitive Rivalry
5 MARKET SIZE AND GROWTH FORECASTS (VALUE)
- 5.1 By Zone
- 5.1.1 Zone 0
- 5.1.2 Zone 20
- 5.1.3 Zone 1
- 5.1.4 Zone 21
- 5.1.5 Zone 2
- 5.1.6 Zone 22
- 5.2 By Class
- 5.2.1 Class 1
- 5.2.2 Class 2
- 5.2.3 Class 3
- 5.3 By Product Type
- 5.3.1 Sensors
- 5.3.2 Detectors
- 5.3.3 Switches
- 5.3.4 Transmitters
- 5.3.5 Isolators and Barriers
- 5.3.6 LED Indicators
- 5.3.7 Other Types
- 5.4 By End User
- 5.4.1 Oil and Gas
- 5.4.2 Mining
- 5.4.3 Power and Utilities
- 5.4.4 Chemical and Petrochemical
- 5.4.5 Processing and Manufacturing
- 5.4.6 Other End Users
- 5.5 By Geography
- 5.5.1 North America
- 5.5.1.1 United States
- 5.5.1.2 Canada
- 5.5.1.3 Mexico
- 5.5.2 South America
- 5.5.2.1 Brazil
- 5.5.2.2 Argentina
- 5.5.2.3 Rest of South America
- 5.5.3 Europe
- 5.5.3.1 Germany
- 5.5.3.2 United Kingdom
- 5.5.3.3 France
- 5.5.3.4 Spain
- 5.5.3.5 Italy
- 5.5.3.6 Rest of Europe
- 5.5.4 Asia-Pacific
- 5.5.4.1 China
- 5.5.4.2 India
- 5.5.4.3 Japan
- 5.5.4.4 South Korea
- 5.5.4.5 Rest of Asia-Pacific
- 5.5.5 Middle East and Africa
- 5.5.5.1 Middle East
- 5.5.5.1.1 Saudi Arabia
- 5.5.5.1.2 United Arab Emirates
- 5.5.5.1.3 Turkey
- 5.5.5.1.4 Rest of Middle East
- 5.5.5.2 Africa
- 5.5.5.2.1 South Africa
- 5.5.5.2.2 Nigeria
- 5.5.5.2.3 Rest of Africa
- 5.5.5.1 Middle East
- 5.5.1 North America
6 COMPETITIVE LANDSCAPE
- 6.1 Market Concentration
- 6.2 Strategic Moves
- 6.3 Market Share Analysis
- 6.4 Company Profiles (includes Global level overview, Market level overview, Core Segments, Financials as available, Strategic Information, Market Rank/Share, Products and Services, Recent Developments)
- 6.4.1 Pepperl + Fuchs SE
- 6.4.2 Honeywell International Inc.
- 6.4.3 ABB Ltd.
- 6.4.4 Siemens AG
- 6.4.5 Eaton Corporation plc
- 6.4.6 Schneider Electric SE
- 6.4.7 R. Stahl AG
- 6.4.8 BARTEC Top Holding GmbH
- 6.4.9 Emerson Electric Co.
- 6.4.10 Rockwell Automation Inc.
- 6.4.11 MSA Safety Inc.
- 6.4.12 Dragerwerk AG and Co. KGaA
- 6.4.13 OMEGA Engineering (Spectris plc)
- 6.4.14 Fluke Corporation (Fortive)
- 6.4.15 Banner Engineering Corp.
- 6.4.16 Extronics Ltd.
- 6.4.17 CorDEX Instruments Ltd.
- 6.4.18 Bayco Products Inc.
- 6.4.19 Kyland Technology Co. Ltd.
- 6.4.20 Georgin SAS
- 6.4.21 ABB Measurement and Analytics (added sub-brand)
- 6.4.22 Teledyne FLIR LLC
- 6.4.23 PATLITE Corp.
- 6.4.24 G.M. International srl
- 6.4.25 RAE Systems by Honeywell
7 MARKET OPPORTUNITIES AND FUTURE OUTLOOK
- 7.1 White-space and Unmet-Need Assessment
 本安型防爆设备市场报告:依产品、区域、等级、最终用户和地区划分(2026-2034年)
 本安设备市场-全球产业规模、份额、趋势、机会及预测:按区域、类别、产品、最终用户、地区及竞争格局划分,2021-2031年
 本质安全设备市场规模、份额、趋势分析报告:按区域、类别、产品、最终用途、地区、细分市场预测,2025-2030 年
 本质安全防爆设备的全球市场:市场规模·占有率·趋势,产业分析 (地带·各级·各产品·各最终用途·各地区),未来预测 (2025年~2034年)
 中东和非洲本质安全防爆设备 -市场占有率分析、行业趋势、统计和成长预测(2025-2030)
 本质安全防爆设备全球市场2024-2028