


 |
市场调查报告书
商品编码
1907221
无损检测(NDT):市占率分析、产业趋势与统计、成长预测(2026-2031)Non-Destructive Testing (NDT) - Market Share Analysis, Industry Trends & Statistics, Growth Forecasts (2026 - 2031) |
||||||
※ 本网页内容可能与最新版本有所差异。详细情况请与我们联繫。
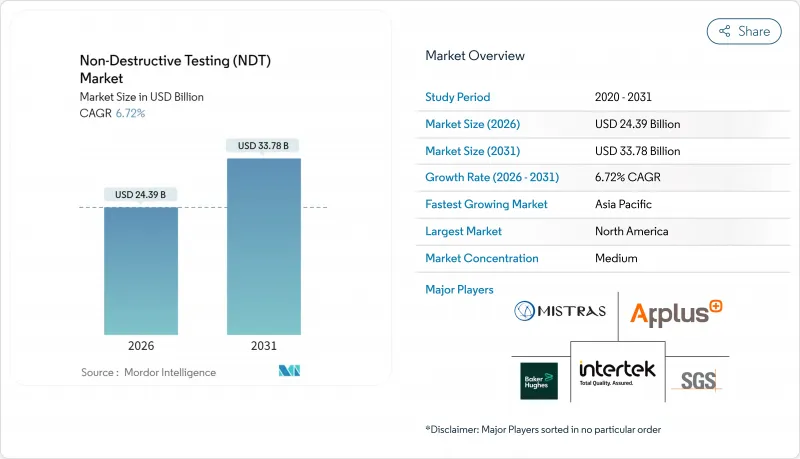
2025 年无损检测 (NDT) 市值为 228.6 亿美元,预计到 2031 年将达到 337.8 亿美元,高于 2026 年的 243.9 亿美元。
预计在预测期(2026-2031 年)内,复合年增长率将达到 6.72%。
在全球安全标准不断提高、老旧资产加速更新换代以及人工智慧诊断平台快速普及的推动下,无损检测 (NDE) 正从被动的缺陷检测转向预测性的资产管理。北美和欧洲的监管机构目前正在强制要求提高压力容器、管道、飞机结构和核子反应炉的侦测频率,从而建立起稳定的需求基础。同时,人工智慧驱动的分析技术正在缩短检查週期并大幅减少资料处理时间,为软体供应商创造新的订阅收入来源。服务供应商正在将可携式相位阵列数位放射线射线照相设备与云端分析相结合,以提高生产效率并降低检测总成本。随着一体化企业寻求提供包含硬体、软体和认证人员的承包解决方案,简化最终用户的合规流程,产业透过併购的整合正在加速。
全球无损检测 (NDT) 市场趋势与洞察
更严格的安全和品质法规推动合规主导型成长
美国机械工程师协会 (ASME)、美国核能管理委员会(NRC) 和美国联邦航空管理局 (FAA) 等监管机构已于 2024 年修订了相关标准,提高了压力容器、核子反应炉零件和复合材料飞机零件的无损检测频率和整体性。这些严格的法规正促使采购决策从可自由支配支出转向强制性合规,从而确保即使在景气衰退时期也能维持基本需求。高温压力容器强制进行相位阵列超音波检测以及数位化记录保存法规的实施,正推动资产所有者对其设备进行现代化改造。服务供应商受益于多年期检测合同,提高了收入的可预测性;而设备供应商则受益于合规更新和持续软体订阅带来的加速更换需求。随着越来越多的地区遵守美国和欧洲标准,这些驱动因素的影响力正在扩大,从而巩固了无损检测市场的长期成长趋势。
老化的基础设施更换週期推动了对测试的需求。
北美超过40%的桥樑已超过设计寿命,上世纪60年代建造的管道也即将达到关键的检测週期。上世纪70年代运作的核能发电厂的延寿计画要求在许可证续期前进行大量的超音波容器扫描。由此产生的检测积压导致对高通量检测服务、智慧清管工具和自动化数据分析的需求创下历史新高。由于基础设施故障会造成巨大的社会和经济损失,监管机构强制要求资产所有者执行严格的检测计划,而这些计划是无法推迟的。这一长期趋势巩固了无损检测业务收益的长期前景,并推动了对可提高现场效率的携带式设备的投资。随着亚太地区的公共产业也开始类似的更新週期,全球需求曲线持续陡峭上升。
自动化无损检测系统的高成本限制了其在价格敏感型市场的应用。
全自动相位阵列扫描器的成本在20万至50万美元之间,给中小型服务公司的预算带来了沉重负担。每年的校准、许可和培训费用使生命週期成本翻倍,并延长了损益平衡点。在人事费用低廉的新兴市场,许多操作人员即使週期较长,也更倾向于人工检测,这减缓了高利润自动化解决方案的普及。缺乏资本规模的小型供应商难以参与竞争,加速了市场整合。在融资工具和设备租赁模式成熟之前,这种限制将继续阻碍自动化解决方案的普及,尤其是在高价值的能源和航太领域之外。
细分市场分析
到2025年,服务收入将构成比收入的78.90%,其中软体业务预计将以11.71%的复合年增长率成长,从而在无损检测市场中塑造出新的价值创造模式。人工智慧驱动的影像识别引擎可在数分钟内将Terabyte的扫描资料转化为可操作的维护洞察,从而将服务经济模式从按小时计费收费为按绩效计费。设备供应商目前正将云端分析与硬体捆绑销售,并采用年度订阅模式,以确保在初始销售之后仍能获得持续收入。边缘运算模组的普及使得在检测现场进行即时分析成为可能,从而缓解了资料主权方面的担忧并降低了频宽成本。
软体的兴起并非取代现场工作,而是重新定义了现场工作。技术人员能够更快地收集更高品质的数据,而中央负责人检验人工智慧产生的标记并产生符合合规要求的报告。这种模式减少了现场加班时间,提高了资产运转率,并为平台提供者产生收入。随着监管机构核准数位签章签章报告,无损检测产业在速度和审核方面都得到了提升,凸显了软体在现代检测工作流程中的关键作用。
由于超音波检测在焊接、锻造和复合材料检测方面具有广泛的适用性,预计到2025年,超音波检测将占据无损检测市场27.95%的份额。先进的相位阵列配置无需拆卸设备即可快速绘製腐蚀分布图并测量体积缺陷尺寸。然而,涡流检测预计到2031年将以9.07%的复合年增长率增长,这主要得益于其能够检测航太复合材料和增材製造零件中使用的导电材料中的微裂纹。
改进的探头设计和多频阵列能够实现更深的穿透深度和更快的扫描速度,挑战了超音波检测在薄壁检测方面的传统优势。同时,数位放射线在管道焊缝检验中继续发挥关键作用,而磁粉检测对于检测铁磁性部件的表面缺陷至关重要。结合这些互补技术,资产所有者可以根据缺陷类型和材料,获得兼顾速度、灵敏度和合规性的均衡工具。
区域分析
截至2025年,北美地区将维持36.30%的市场份额,这主要得益于成熟的监管体系、老化的基础设施以及人工智慧技术的早期应用。该地区拥有大规模现有设施,例如压力容器、管道和飞机结构,从而保证了检测量的稳定性。油气业者也正在投资先进的机器人清管器检测技术,以延长其资产的使用寿命。政府为支持核能发电厂延寿计画提供的补助也推动了对容积式超音波扫描的需求。
欧洲虽然略显落后,但得益于严格的安全指令以及欧盟「绿色交易」下对可再生能源计划的推动,正从中受益。风力发电机叶片检测、复合材料转子缺陷监测以及氢气管道试点计画都在推动该地区无损检测市场的发展。法国和英国正在进行的核子反应炉升级改造,促使长期检测合约的需求增加;同时,日益增长的环境、社会和治理(ESG)问题也加速了从胶片射线照相向数位放射线的过渡,从而有助于减少有害废弃物的产生。
亚太地区成长势头强劲,复合年增长率达7.61%,主要得益于中国和印度的大型基础设施计划,以及航太和半导体製造业的扩张。日本和韩国政府正努力使本国标准与ASME和IEC标准接轨,从而加强了检验力度。新兴的东南亚国家越来越多地采用国际认证机构的合格评定,为全球企业创造了服务机会。 「一带一路」沿线管线网路推动了对智慧清管器侦测的需求,而该地区新建的造船厂则要求对大型船体焊接进行磁粉探伤和相位阵列探伤。
在中东和非洲地区,海上油气投资和石化工厂扩建将推动需求成长。红海和西非近海的海底计划需要深水检测技术。部分国家的政治不稳定将导致计划延期,增加区域预测的波动性,但如果计划按计划推进,也将带来高回报。在拉丁美洲,预计成长将较为温和,主要由巴西盐盐层下油气开发和墨西哥炼油厂维修,这两项工程都需要高规格的无损检测技术。
其他福利:
- Excel格式的市场预测(ME)表
- 3个月的分析师支持
目录
第一章 引言
- 研究假设和市场定义
- 调查范围
第二章调查方法
第三章执行摘要
第四章 市场情势
- 市场概览
- 市场驱动因素
- 更严格的安全和品质法规
- 老旧基础建设的更新周期
- 海上石油计划扩张
- 可携式相控阵和DR设备的现状
- 人工智慧驱动的缺陷分析平台
- 增材製造中的品质保证要求
- 市场限制
- 自动化无损检测系统高成本
- 合格技术人员短缺
- 网路安全和资料主权障碍
- ESG(环境、社会与治理)对放射性试验废弃物的强烈反对
- 产业价值链分析
- 宏观经济因素的影响
- 监管环境
- 技术展望
- 波特五力分析
- 新进入者的威胁
- 供应商的议价能力
- 买方的议价能力
- 替代品的威胁
- 竞争对手之间的竞争
第五章 市场规模与成长预测
- 按组件
- 装置
- 软体
- 服务
- 消耗品
- 透过测试方法
- 超音波
- 放射线检查
- 磁粉检测
- 液体液体渗透探伤
- 目视检查
- 涡流检测
- 声发射测试
- 热成像/红外线检测
- 电脑断层扫描
- 透过技术
- 传统方法
- 配备人工智慧
- 按最终用户行业划分
- 石油和天然气
- 发电
- 航太工业
- 防御
- 汽车/运输设备
- 製造业和重工业
- 建筑和基础设施
- 化工/石油化工
- 海洋/造船
- 电子和半导体
- 矿业
- 医疗设备
- 其他终端用户产业
- 按地区
- 北美洲
- 美国
- 加拿大
- 墨西哥
- 南美洲
- 巴西
- 阿根廷
- 南美洲其他地区
- 欧洲
- 德国
- 英国
- 法国
- 义大利
- 西班牙
- 其他欧洲地区
- 亚太地区
- 中国
- 日本
- 印度
- 韩国
- 东南亚
- 亚太其他地区
- 中东和非洲
- 中东
- 沙乌地阿拉伯
- 阿拉伯聯合大公国
- 土耳其
- 其他中东地区
- 非洲
- 南非
- 奈及利亚
- 其他非洲地区
- 中东
- 北美洲
第六章 竞争情势
- 市场集中度
- 策略趋势
- 市占率分析
- 公司简介
- Baker Hughes Company
- MISTRAS Group, Inc.
- SGS SA
- Intertek Group plc
- Applus+Services, SA
- Olympus Corporation
- Eddyfi/NDT Inc.
- Yxlon International GmbH
- Magnaflux(Illinois Tool Works Inc.)
- Ashtead Technology Ltd.
- Zetec Inc.
- Sonatest Ltd.
- Bureau Veritas SA
- TUV Rheinland AG
- Element Materials Technology Group Ltd.
- DEKRA SE
- DNV AS
- Acuren Inspection, Inc.
- NDT Global GmbH and Co. KG
- Cygnus Instruments Ltd.
- Sonotron NDT
- Bosello High Technology Srl
- LynX Inspection Inc.
- TD Williamson, Inc.
第七章 市场机会与未来展望
The non-destructive testing market was valued at USD 22.86 billion in 2025 and estimated to grow from USD 24.39 billion in 2026 to reach USD 33.78 billion by 2031, at a CAGR of 6.72% during the forecast period (2026-2031).
Heightened global safety rules, the accelerating replacement of aging assets, and the rapid adoption of AI-enabled diagnostic platforms are shifting non-destructive evaluation from reactive fault finding toward predictive asset management. Regulatory agencies in North America and Europe now mandate more frequent inspections for pressure vessels, pipelines, aircraft structures, and nuclear reactors, anchoring a steady demand floor. Meanwhile, AI-driven analytics shorten inspection cycles, slash data-processing time, and create new subscription revenue streams for software vendors. Service providers are responding by pairing portable phased-array and digital radiography equipment with cloud analytics, raising productivity and lowering total inspection costs. Consolidation through mergers and acquisitions is intensifying, as integrated players seek to bundle hardware, software, and certified labor into turnkey offerings that simplify compliance for end users.
Global Non-Destructive Testing (NDT) Market Trends and Insights
Stricter Safety And Quality Regulations Drive Compliance-Led Growth
Regulatory bodies, such as the American Society of Mechanical Engineers, the Nuclear Regulatory Commission, and the Federal Aviation Administration, updated their codes in 2024, which now require more frequent and comprehensive non-destructive examinations of pressure vessels, reactor components, and composite aircraft parts. These tighter rules have shifted purchasing decisions from discretionary spending to mandatory compliance, guaranteeing baseline demand even in downturns. The mandatory use of phased-array ultrasonics for high-temperature pressure vessels, combined with digital record-keeping rules, is prompting asset owners to modernize their equipment fleets. Service providers benefit from multiyear inspection contracts that improve revenue predictability. Equipment vendors win through accelerated replacement sales and recurring software subscriptions tied to code compliance updates. As additional jurisdictions align with U.S. and European standards, the driver's influence broadens, reinforcing a long-term growth thrust for the non-destructive testing market.
Aging Infrastructure Replacement Cycle Accelerates Inspection Demand
More than 40% of North American bridges now exceed design life, while pipelines installed during the 1960s are approaching critical inspection intervals. Life-extension programs for nuclear plants commissioned in the 1970s require extensive ultrasonic vessel scans to be performed before license renewal. The resulting inspection backlog fuels record demand for high-throughput testing services, intelligent pigging tools, and automated data analytics. Because infrastructure failures carry high social and economic costs, regulators enforce strict inspection calendars that asset owners cannot defer. This secular trend secures long-term visibility for non-destructive testing service revenue and spurs investment in portable equipment that improves site productivity. As Asia-Pacific utilities embark on similar upgrade cycles, global demand curves continue to steepen.
High Cost Of Automated NDT Systems Limits Adoption In Price-Sensitive Markets
Fully automated phased-array scanners can cost USD 200,000-500,000, a price point that strains the budgets of small and mid-sized service firms. Annual calibration, software licensing, and training double the lifetime ownership cost, extending breakeven periods. In emerging markets with lower labor costs, operators often favor manual inspection despite longer cycle times, which slows the penetration of high-margin automated solutions. Smaller vendors lacking capital scale struggle to compete, accelerating market consolidation. Until financing tools or equipment leasing models mature, this restraint will continue to dampen uptake, especially outside high-value energy and aerospace segments.
Other drivers and restraints analyzed in the detailed report include:
- Expansion Of Offshore Oil And Gas Projects Drives Subsea NDT Innovation
- Portable Phased-Array And Digital-Radiography Equipment Uptake Transforms Field Operations
- Shortage Of Certified Technicians Constrains Market Growth Potential
For complete list of drivers and restraints, kindly check the Table Of Contents.
Segment Analysis
Services held 78.90% of 2025 revenue, yet the software slice is forecast to expand at 11.71% CAGR, setting a new value-creation arc for the non-destructive testing market. AI-driven image-recognition engines convert terabytes of scan data into actionable maintenance insights within minutes, reshaping service economics from hourly billing toward outcome-based pricing. Equipment vendors now bundle cloud analytics with hardware, embedding annual subscriptions that stretch revenue beyond the initial sale. The surge in edge-computing modules enables real-time analytics at inspection sites, easing data sovereignty concerns and reducing bandwidth costs.
Software's rise does not eclipse field labor but redefines task allocation. Technicians capture higher-quality data more quickly, while centralized analysts validate AI-generated flags and produce compliance-ready reports. The model trims field overtime, increases fleet utilization, and creates new recurring revenue for platform providers. As regulatory bodies accept digitally signed reports, the non-destructive testing industry gains both speed and auditability, underscoring the pivotal role of software in modern inspection workflows.
Ultrasonic methods accounted for 27.95% of the 2025 non-destructive testing market share, owing to their versatility in inspections of welds, forgings, and composites. Advanced phased-array configurations enable rapid corrosion mapping and volumetric flaw sizing without the need for dismantling equipment. Yet, eddy-current testing is expected to grow at a 9.07% CAGR through 2031, driven by its ability to detect micro-cracks in conductive materials used in aerospace composites and additive-manufactured parts.
Improved probe design and multi-frequency arrays now deliver deeper penetration and faster scanning, challenging ultrasonics' historical stronghold in thin-wall inspections. Meanwhile, digital radiography continues to play a critical role in pipeline weld validation, and magnetic particle testing remains indispensable for detecting surface flaws in ferromagnetic components. Together, these complementary methods ensure that asset owners deploy a balanced toolbox that blends speed, sensitivity, and regulatory acceptance, depending on the defect type and material.
The Global Non-Destructive Testing (NDT) Market Report is Segmented by Component (Equipment, Software, Services, and Consumables), Testing Method (Ultrasonic Testing, Radiographic Testing, Magnetic Particle Testing, and More), Technique (Traditional/Conventional and AI-Enabled), End-User Industry (Oil and Gas, Power Generation, Aerospace, and More), and Geography. The Market Forecasts are Provided in Terms of Value (USD).
Geography Analysis
North America retained a 36.30% share in 2025, driven by mature regulatory oversight, aging infrastructure, and early adoption of AI. The region's large installed base of pressure vessels, pipelines, and aircraft structures ensures steady inspection volumes, while oil and gas operators fund advanced robotic pigging to extend the life of their assets. Government grants supporting nuclear plant life-extension programs also sustain demand for volumetric ultrasonic scanning.
Europe trails slightly, yet benefits from rigorous safety directives and the European Union's push for renewable energy projects under the Green Deal. Wind-turbine blade inspections, composite rotor defect monitoring, and hydrogen pipeline pilots collectively bolster the regional non-destructive testing market. Ongoing upgrades to nuclear reactors in France and the United Kingdom are driving the addition of long-term inspection contracts, while ESG concerns are accelerating the shift from film to digital radiography to reduce hazardous-waste volumes.
The Asia-Pacific region is delivering the strongest forward momentum, with a 7.61% CAGR, driven by massive infrastructure projects in China and India, as well as expanding aerospace and semiconductor manufacturing. Governments in Japan and South Korea align local codes with ASME and IEC standards, thereby raising the rigor of inspections. Emerging Southeast Asian economies often rely on international certifiers for compliance, presenting opportunities for service to global firms. Belt and Road pipeline networks drive demand for intelligent pigging, while new shipyards across the region require magnetic particle and phased-array inspections of large hull welds.
The Middle East and Africa gain from offshore oil and gas investments and petrochemical plant expansions. Subsea projects in the Red Sea and offshore West Africa call for deepwater-qualified inspection technologies. Political instability in certain countries can delay projects, injecting volatility into regional forecasts but also producing premium margins when projects advance under compressed timelines. Latin America records moderate growth, centered on Brazilian pre-salt developments and Mexican refinery upgrades, both of which require high-specification non-destructive examinations.
- Baker Hughes Company
- MISTRAS Group, Inc.
- SGS SA
- Intertek Group plc
- Applus+ Services, S.A.
- Olympus Corporation
- Eddyfi/NDT Inc.
- Yxlon International GmbH
- Magnaflux (Illinois Tool Works Inc.)
- Ashtead Technology Ltd.
- Zetec Inc.
- Sonatest Ltd.
- Bureau Veritas SA
- TUV Rheinland AG
- Element Materials Technology Group Ltd.
- DEKRA SE
- DNV AS
- Acuren Inspection, Inc.
- NDT Global GmbH and Co. KG
- Cygnus Instruments Ltd.
- Sonotron NDT
- Bosello High Technology Srl
- LynX Inspection Inc.
- T.D. Williamson, Inc.
Additional Benefits:
- The market estimate (ME) sheet in Excel format
- 3 months of analyst support
TABLE OF CONTENTS
1 INTRODUCTION
- 1.1 Study Assumptions and Market Definition
- 1.2 Scope of the Study
2 RESEARCH METHODOLOGY
3 EXECUTIVE SUMMARY
4 MARKET LANDSCAPE
- 4.1 Market Overview
- 4.2 Market Drivers
- 4.2.1 Stricter safety and quality regulations
- 4.2.2 Aging infrastructure replacement cycle
- 4.2.3 Expansion of offshore oil and gas projects
- 4.2.4 Portable phased-array and DR equipment uptake
- 4.2.5 AI-powered defect analytics platforms
- 4.2.6 Additive-manufacturing QA requirements
- 4.3 Market Restraints
- 4.3.1 High cost of automated NDT systems
- 4.3.2 Shortage of certified technicians
- 4.3.3 Cyber-security and data-sovereignty barriers
- 4.3.4 ESG pushback on radiography waste
- 4.4 Industry Value Chain Analysis
- 4.5 Impact of Macroeconomic Factors
- 4.6 Regulatory Landscape
- 4.7 Technological Outlook
- 4.8 Porter's Five Forces Analysis
- 4.8.1 Threat of New Entrants
- 4.8.2 Bargaining Power of Suppliers
- 4.8.3 Bargaining Power of Buyers
- 4.8.4 Threat of Substitutes
- 4.8.5 Competitive Rivalry
5 MARKET SIZE AND GROWTH FORECASTS (VALUE)
- 5.1 By Component
- 5.1.1 Equipment
- 5.1.2 Software
- 5.1.3 Services
- 5.1.4 Consumables
- 5.2 By Testing Method
- 5.2.1 Ultrasonic Testing
- 5.2.2 Radiographic Testing
- 5.2.3 Magnetic Particle Testing
- 5.2.4 Liquid Penetrant Testing
- 5.2.5 Visual Inspection Testing
- 5.2.6 Eddy-Current Testing
- 5.2.7 Acoustic Emission Testing
- 5.2.8 Thermography / Infrared Testing
- 5.2.9 Computed Tomography Testing
- 5.3 By Technique
- 5.3.1 Traditional/ Conventional
- 5.3.2 AI-enabled
- 5.4 By End-user Industry
- 5.4.1 Oil and Gas
- 5.4.2 Power Generation
- 5.4.3 Aerospace
- 5.4.4 Defense
- 5.4.5 Automotive and Transportation
- 5.4.6 Manufacturing and Heavy Engineering
- 5.4.7 Construction and Infrastructure
- 5.4.8 Chemical and Petrochemical
- 5.4.9 Marine and Ship Building
- 5.4.10 Electronics and semiconductor
- 5.4.11 Mining
- 5.4.12 Medical Devices
- 5.4.13 Other End-user Industries
- 5.5 By Geography
- 5.5.1 North America
- 5.5.1.1 United States
- 5.5.1.2 Canada
- 5.5.1.3 Mexico
- 5.5.2 South America
- 5.5.2.1 Brazil
- 5.5.2.2 Argentina
- 5.5.2.3 Rest of South America
- 5.5.3 Europe
- 5.5.3.1 Germany
- 5.5.3.2 United Kingdom
- 5.5.3.3 France
- 5.5.3.4 Italy
- 5.5.3.5 Spain
- 5.5.3.6 Rest of Europe
- 5.5.4 Asia-Pacific
- 5.5.4.1 China
- 5.5.4.2 Japan
- 5.5.4.3 India
- 5.5.4.4 South Korea
- 5.5.4.5 South-East Asia
- 5.5.4.6 Rest of Asia-Pacific
- 5.5.5 Middle East and Africa
- 5.5.5.1 Middle East
- 5.5.5.1.1 Saudi Arabia
- 5.5.5.1.2 United Arab Emirates
- 5.5.5.1.3 Turkey
- 5.5.5.1.4 Rest of Middle East
- 5.5.5.2 Africa
- 5.5.5.2.1 South Africa
- 5.5.5.2.2 Nigeria
- 5.5.5.2.3 Rest of Africa
- 5.5.5.1 Middle East
- 5.5.1 North America
6 COMPETITIVE LANDSCAPE
- 6.1 Market Concentration
- 6.2 Strategic Moves
- 6.3 Market Share Analysis
- 6.4 Company Profiles (includes Global level Overview, Market level overview, Core Segments, Financials as available, Strategic Information, Market Rank/Share for key companies, Products and Services, and Recent Developments)
- 6.4.1 Baker Hughes Company
- 6.4.2 MISTRAS Group, Inc.
- 6.4.3 SGS SA
- 6.4.4 Intertek Group plc
- 6.4.5 Applus+ Services, S.A.
- 6.4.6 Olympus Corporation
- 6.4.7 Eddyfi/NDT Inc.
- 6.4.8 Yxlon International GmbH
- 6.4.9 Magnaflux (Illinois Tool Works Inc.)
- 6.4.10 Ashtead Technology Ltd.
- 6.4.11 Zetec Inc.
- 6.4.12 Sonatest Ltd.
- 6.4.13 Bureau Veritas SA
- 6.4.14 TUV Rheinland AG
- 6.4.15 Element Materials Technology Group Ltd.
- 6.4.16 DEKRA SE
- 6.4.17 DNV AS
- 6.4.18 Acuren Inspection, Inc.
- 6.4.19 NDT Global GmbH and Co. KG
- 6.4.20 Cygnus Instruments Ltd.
- 6.4.21 Sonotron NDT
- 6.4.22 Bosello High Technology Srl
- 6.4.23 LynX Inspection Inc.
- 6.4.24 T.D. Williamson, Inc.
7 MARKET OPPORTUNITIES AND FUTURE OUTLOOK
- 7.1 White-space and Unmet-need Assessment
 TFM/FMC相位阵列超音波探伤市场按技术、产品类型、检测模式、最终用户和应用划分-2026-2032年全球预测
 无损检测市场规模、份额及成长分析(依方法、技术、应用、组件、最终用户及地区划分)-2026-2033年产业预测
 无人机测试服务:全球市场洞察与预测(至2031年)
 无损检测市场规模、份额和趋势分析报告:按产品、测试方法、产业、地区和细分市场预测(2025-2033 年)
 全球无损检测设备市场:依检测方法、技术、最终用户和地区划分-市场规模、产业趋势、机会分析和预测(2025-2033 年)
 石油天然气无损检测:全球市场份额和排名、总收入和需求预测(2025-2031年)相位阵列探伤仪:全球市占率及排名、总收入及需求预测(2025-2031年)工业无损检测(NDT)X射线检测设备:全球市场份额和排名、总收入和需求预测(2025-2031年)非破坏性检验与检验市场(依技术、方法、服务与垂直产业)-2025-2032 年全球预测
 2025年无损检测(NDT)和检测全球市场报告