


 |
市场调查报告书
商品编码
1907235
石灰石:市场占有率分析、产业趋势与统计、成长预测(2026-2031)Limestone - Market Share Analysis, Industry Trends & Statistics, Growth Forecasts (2026 - 2031) |
||||||
※ 本网页内容可能与最新版本有所差异。详细情况请与我们联繫。
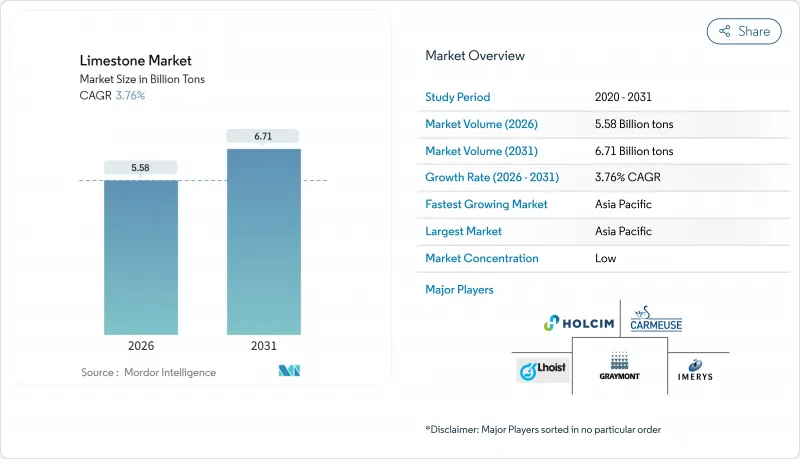
预计到 2026 年,石灰石市场规模将达到 55.8 亿吨,高于 2025 年的 53.8 亿吨,预计到 2031 年将达到 67.1 亿吨,2026 年至 2031 年的复合年增长率为 3.76%。
石灰石在钢铁助熔剂、水泥水泥熟料、排烟脱硫(FGD) 以及新兴碳去除技术中不可替代的作用,支撑了其稳定成长。随着钢铁生产商向氢基直接还原製程转型,工业石灰应用持续推动需求成长,因为氢基直接还原製程每吨产品消耗的助熔剂更多。新兴亚洲国家建设活动的活性化、煤炭依赖型经济体日益严格的环境法规,以及直接空气捕集试点计画对更高品质产品的需求,都进一步推动了石灰石市场的成长。竞争格局主要体现在收购活动上,企业透过收购来确保长期开采权并整合下游加工业务,而更严格的采石场许可和不断增加的碳排放税负担正在影响成本结构。
全球石灰石市场趋势及展望
亚洲新兴市场建筑业超级週期推动了石灰石散装需求。
印度、印尼、越南和柬埔寨加速推进的基础设施项目使水泥窑接近满载运转率,推高了石灰石的需求,而石灰石约占水泥原料的80%。由于石灰石从采石场到大型城市计划上。然而,印度在拉贾斯坦邦、奥里萨邦和安得拉邦拥有丰富的石灰石蕴藏量,这继续支撑着印度的成本优势。
钢铁密集型能源转型计划推动熔剂需求
风力发电机基础每兆瓦需要200-400吨钢材,而随着业者为追求更清洁的化学製程而提高碱性氧气转炉和电弧炉的熔剂用量,石灰石的需求量也将随之增加。氢基直接还原铁(DRI-H2)製程需要额外消耗15-20%的熔剂来应对日益增多的脉石堆积。同时,用于大规模太阳能发电的太阳能级玻璃每兆瓦需要3-4吨源自石灰石的钠钙硅酸盐。因此,即使钢铁业正向低碳发展路径转型,全球可再生能源的扩张(目标是到2030年达到11,000吉瓦)仍将继续推动工业石灰的需求。
采石场环境影响和生物多样性诉讼导致更严格的营运许可证制度
安大略省的《骨材资源法》要求进行多年的生态系统基准研究、地下水位建模以及矿山关闭后的修復保证,这使得生产前成本增加了矿山生命週期资本的8%至12%。昆士兰州和加州的类似障碍将许可审批週期延长了两年或更久,迫使规模较小的业者进行合併或剥离。取水许可证,例如朗克利夫公司申请将年取水量增加到35万立方米,需要举行公开听证会和环境评估,这增加了时间和成本。位于栖息地丰富的地区的矿床面临这些增加的法律风险,限制了优质石材的供应。
细分市场分析
截至2025年,工业石灰占石灰石市场的65.92%。受欧盟和美国氢化直接还原铁(DRI)测试活性化的推动,预计工业石灰在2031年之前仍将是石灰石市场的核心细分市场,预计复合年增长率(CAGR)为4.02%。化学石灰将继续保持个位数的温和成长,这主要得益于亚洲地区更严格的污水法规和强制性硫回收政策。由于替代接合材料的广泛应用,建筑石灰的需求将保持稳定,但耐火材料石灰预计将在细分市场扩张,这主要得益于电弧炉钢包衬里需求的增长。
综合钢铁厂与采石场所有者之间的长期供应协议能够稳定现金流,并保护大型矿业公司免受週期性现货价格波动的影响。像Roist这样的公司正在利用垂直整合的伙伴关係关係,透过与绿色钢铁开发商签署谅解备忘录,供应经认证的低碳石灰,从而对冲碳排放税风险。
石灰石报告按应用领域(工业石灰、化学石灰、建筑石灰、耐火材料石灰)、终端用户行业(造纸和纸浆、水处理、农业、塑胶、建筑等)以及地区(亚太地区、北美、欧洲、南美、中东和非洲)进行细分。市场预测以吨为单位。
区域分析
预计到2025年,亚太地区将占全球石灰石市场份额的71.62%,并在2031年之前以4.49%的复合年增长率成长。儘管柴油价格上涨,但拉贾斯坦邦、广西和爪哇岛丰富的陆上石灰石矿床仍使交付成本保持在较低水平。东南亚各国政府正在强制要求燃煤发电厂安装排烟脱硫(FGD)系统,这增加了对特种石灰石的需求,而越南河南省和印尼南苏门答腊省的当地采石场已开始供应这种石灰石。
在北美和欧洲,下游脱碳技术正在推动需求成长,创造出供应有限的高价值市场。 Greymont更名为「钙基解决方案」以及Carmeuse的二氧化碳减排蓝图,都使区域领导企业在直接空气脱碳(DAC)供应协议和波特兰石灰石水泥扩产方面占据有利地位。
在中东和非洲,随着沙乌地阿拉伯扩大计划的采石场许可证发放,以及埃及确立其作为海湾合作委员会沉淀碳酸钙供应国的地位,石灰石市场成长正在加速。南美洲的发展将取决于巴西的基础设施奖励策略和阿根廷的政治稳定。印尼国营水泥生产商Semen Baturaja累计了2024年创纪录的营收,反映出国内水泥需求强劲。
其他福利:
- Excel格式的市场预测(ME)表
- 3个月的分析师支持
目录
第一章 引言
- 研究假设和市场定义
- 调查范围
第二章调查方法
第三章执行摘要
第四章 市场情势
- 市场概览
- 市场驱动因素
- 亚洲新兴市场建筑业超级週期推动了对石灰石的巨大需求
- 钢铁密集型能源转型计划(风能、太阳能、氢能)将促进助熔剂消费量。
- 煤炭依赖型经济体中的脱硫和其他环境法规
- 利用高等级石灰石直接进行大气和海洋二氧化碳矿化的试点项目
- 生物基塑胶母粒生产商使用超细碳酸钙填充材。
- 市场限制
- 采石场环境影响和生物多样性诉讼导致更严格的营运许可证制度
- 石灰窑排放的大量二氧化碳会带来碳排放税风险。
- 工程石材和无机聚合物水泥正在蚕食装饰性和普通硅酸盐水泥(OPC)的需求。
- 价值链分析
- 波特五力模型
- 供应商的议价能力
- 买方的议价能力
- 新进入者的威胁
- 替代品的威胁
- 竞争程度
- 进出口趋势
- 价格趋势
第五章 市场规模及成长预测(数量与以金额为准)
- 透过使用
- 工业石灰
- 化学石灰
- 建筑石灰
- 耐火石灰
- 按最终用户行业划分
- 纸浆和造纸
- 水处理
- 农业
- 塑胶
- 建筑/施工
- 钢铁製造业及其他产业(包括能源业)
- 其他终端用户产业
- 按地区
- 亚太地区
- 中国
- 印度
- 日本
- 韩国
- ASEAN
- 亚太其他地区
- 北美洲
- 美国
- 加拿大
- 墨西哥
- 欧洲
- 德国
- 英国
- 法国
- 义大利
- 西班牙
- 北欧国家
- 俄罗斯
- 其他欧洲地区
- 南美洲
- 巴西
- 阿根廷
- 哥伦比亚
- 中东和非洲
- 沙乌地阿拉伯
- 南非
- 其他中东和非洲地区
- 亚太地区
第六章 竞争情势
- 市场集中度
- 策略趋势
- 市占率(%)/排名分析
- 公司简介
- ARGOS
- CALCO-BOLIVIA
- Caleras San Juan
- CALIDRA
- Calizas Huayco SA
- CALMOSCORP
- Calpar Limestone Trading Ltd.
- Carmeuse
- GCCP Resources Limited
- Graymont Limited
- Gujarat Mineral Development Corporation Ltd.
- Holcim
- Imerys
- JM Huber Corporation
- Lhoist
- Longcliffe Quarries Ltd
- Minerals Technologies Inc
- Nittetsu Mining Co. Ltd
- Okutama Kogyo Co. Ltd
- Omya AG
- SCHAEFER KALK GmbH Co. and AG
第七章 市场机会与未来展望
Limestone market size in 2026 is estimated at 5.58 Billion tons, growing from 2025 value of 5.38 Billion tons with 2031 projections showing 6.71 Billion tons, growing at 3.76% CAGR over 2026-2031.
This steady rise is anchored in limestone's irreplaceable role in steel flux, cement clinker, flue-gas desulfurization (FGD), and emerging carbon-removal technologies. Industrial lime applications continue to dominate volume demand as steelmakers shift to hydrogen-based direct-reduction processes that consume more flux per ton of output. Construction activity in emerging Asia, stricter environmental regulations in coal-reliant economies, and premium-grade demand from direct-air-capture pilots add further momentum. Competitive activity centers on acquisitions that secure long-life quarries and integrate downstream processing, while tightening quarry permits and rising carbon-tax exposure shape cost structures.
Global Limestone Market Trends and Insights
Construction Super-cycle in Emerging Asia Drives Bulk Limestone Demand
Accelerated infrastructure programs across India, Indonesia, Vietnam, and Cambodia keep cement kilns running near nameplate capacity, raising limestone pull-through because the mineral accounts for roughly 80% of cement feedstock. The short haul radius that quarry stone can travel economically, typically less than 200 km, concentrates supply risk near large urban projects. Nevertheless, abundant reserves in Rajasthan, Odisha, and Andhra Pradesh continue to anchor India's cost advantage.
Steel-intensive Energy-transition Projects Boost Flux Consumption
Wind-turbine foundations require 200-400 tons of steel per megawatt, driving parallel limestone demand because steel flux rates in basic-oxygen and electric-arc furnaces rise as operators chase cleaner chemistries. Hydrogen-based direct-reduction iron (DRI-H2) flowsheets consume 15-20% more flux to manage increased gangue pickup, while solar-grade glass for utility-scale photovoltaics needs limestone-derived soda-lime silicates at 3-4 tons per megawatt. Global renewables expansion toward 11,000 GW by 2030 therefore keeps industrial lime volumes growing even as steel shifts to low-carbon pathways.
Quarry-footprint and Biodiversity Litigation Tighten Operating Licenses
Ontario's Aggregate Resources Act now requires multi-year ecological baselines, water-table modeling, and post-closure rehabilitation guarantees that lift pre-production costs by 8-12% of life-of-mine capital. Similar hurdles in Queensland and California extend approval cycles beyond two years, pressuring smaller operators to consolidate or divest. Water-abstraction permits, such as Longcliffe's request to boost intake to 350,000 m3/year, face public consultation and environmental scrutiny that add time and cost. Deposits situated in habitat-rich areas thus face rising legal risks, restricting supply of premium stone grades.
Other drivers and restraints analyzed in the detailed report include:
- Desulfurization Environmental Mandates in Coal-heavy Economies
- Ultra-fine CaCO3 in Bio-based Plastics
- High Process CO2 from Lime Kilns Invites Carbon-tax Exposure
For complete list of drivers and restraints, kindly check the Table Of Contents.
Segment Analysis
Industrial lime held 65.92% of limestone market share in 2025. Intensifying hydrogen-DRI trials in the EU and the U.S. underpin a 4.02% CAGR outlook, ensuring industrial lime remains the anchor of the limestone market through 2031. Chemical lime follows at mid-single-digit growth, fueled by stricter wastewater norms and sulfur-capture mandates in Asia. Construction lime volumes stay flat as alternative binders gain traction, while refractory grades show niche expansion tied to electric-arc furnace ladle linings.
Long-term supply contracts between integrated steel mills and quarry owners stabilize cash flow, insulating the largest miners from cyclical spot swings. Players such as Lhoist have signed memoranda with green-steel developers to deliver certified low-carbon lime, leveraging vertical partnerships to hedge against carbon taxes.
The Limestone Report is Segmented by Application (Industry Lime, Chemical Lime, Construction Lime, and Refractory Lime), End-User Industry (Paper and Pulp, Water Treatment, Agriculture, Plastics, Building and Construction, and More), and Geography (Asia-Pacific, North America, Europe, South America, and Middle-East and Africa). The Market Forecasts are Provided in Terms of Volume (Tons),
Geography Analysis
Asia-Pacific accounted for 71.62% of global limestone market share in 2025 and is poised for a 4.49% CAGR through 2031. Abundant on-shore deposits in Rajasthan, Guangxi, and Java keep delivered-cost curves low despite rising diesel prices. Southeast Asian governments mandate FGD retrofits on coal plants, adding specialized limestone demand that local quarries in Vietnam's Ha Nam and Indonesia's South Sumatra have begun to supply.
North America and Europe offer smaller volumes but higher value, driven by downstream decarbonization technologies. Graymont's rebrand toward "calcium-based solutions" and Carmeuse's CO2 road-map position regional leaders for DAC supply contracts and Portland Limestone Cement expansions.
The Middle East and Africa register accelerating limestone market growth as Saudi Arabia expands quarry licensing to feed giga-projects and Egypt positions itself as a GCC supplier of precipitated calcium carbonate. South America's trajectory hinges on Brazil's infrastructure stimulus and Argentina's political stability. Indonesian state-backed producer Semen Baturaja posted record 2024 earnings, reflecting strong domestic cement pull.
- ARGOS
- CALCO-BOLIVIA
- Caleras San Juan
- CALIDRA
- Calizas Huayco SA
- CALMOSCORP
- Calpar Limestone Trading Ltd.
- Carmeuse
- GCCP Resources Limited
- Graymont Limited
- Gujarat Mineral Development Corporation Ltd.
- Holcim
- Imerys
- J.M. Huber Corporation
- Lhoist
- Longcliffe Quarries Ltd
- Minerals Technologies Inc
- Nittetsu Mining Co. Ltd
- Okutama Kogyo Co. Ltd
- Omya AG
- SCHAEFER KALK GmbH Co. and AG
Additional Benefits:
- The market estimate (ME) sheet in Excel format
- 3 months of analyst support
TABLE OF CONTENTS
1 Introduction
- 1.1 Study Assumptions and Market Definition
- 1.2 Scope of the Study
2 Research Methodology
3 Executive Summary
4 Market Landscape
- 4.1 Market Overview
- 4.2 Market Drivers
- 4.2.1 Construction super-cycle in emerging Asia drives bulk limestone demand
- 4.2.2 Steel-intensive energy-transition projects (wind, solar, H2) boost flux consumption
- 4.2.3 Desulfurisation and other environmental mandates in coal-heavy economies
- 4.2.4 Direct air/ocean CO2 mineralisation pilots using high-grade limestone
- 4.2.5 Bio-based plastic master-batchers adopt ultra-fine CaCO3 filler grades
- 4.3 Market Restraints
- 4.3.1 Quarrying footprint and biodiversity litigation tighten operating licences
- 4.3.2 High process CO2 from lime kilns invites carbon-tax exposure
- 4.3.3 Engineered stone and geopolymer cement cannibalise decorative and OPC demand
- 4.4 Value Chain Analysis
- 4.5 Porter's Five Forces
- 4.5.1 Bargaining Power of Suppliers
- 4.5.2 Bargaining Power of Buyers
- 4.5.3 Threat of New Entrants
- 4.5.4 Threat of Substitutes
- 4.5.5 Degree of Competition
- 4.6 Import-Export Trends
- 4.7 Price Trends
5 Market Size and Growth Forecasts (Volume and Value)
- 5.1 By Application
- 5.1.1 Industry Lime
- 5.1.2 Chemical Lime
- 5.1.3 Construction Lime
- 5.1.4 Refractory Lime
- 5.2 By End-User Industry
- 5.2.1 Paper and Pulp
- 5.2.2 Water Treatment
- 5.2.3 Agriculture
- 5.2.4 Plastics
- 5.2.5 Building and Construction
- 5.2.6 Steel Manufacturing and Other Industries (Including Energy)
- 5.2.7 Other End-user Industries
- 5.3 By Geography
- 5.3.1 Asia-Pacific
- 5.3.1.1 China
- 5.3.1.2 India
- 5.3.1.3 Japan
- 5.3.1.4 South Korea
- 5.3.1.5 ASEAN
- 5.3.1.6 Rest of Asia-Pacific
- 5.3.2 North America
- 5.3.2.1 United States
- 5.3.2.2 Canada
- 5.3.2.3 Mexico
- 5.3.3 Europe
- 5.3.3.1 Germany
- 5.3.3.2 United Kingdom
- 5.3.3.3 France
- 5.3.3.4 Italy
- 5.3.3.5 Spain
- 5.3.3.6 Nordic Countries
- 5.3.3.7 Russia
- 5.3.3.8 Rest of Europe
- 5.3.4 South America
- 5.3.4.1 Brazil
- 5.3.4.2 Argentina
- 5.3.4.3 Colombia
- 5.3.5 Middle-East and Africa
- 5.3.5.1 Saudi Arabia
- 5.3.5.2 South Africa
- 5.3.5.3 Rest of Middle-East and Africa
- 5.3.1 Asia-Pacific
6 Competitive Landscape
- 6.1 Market Concentration
- 6.2 Strategic Moves
- 6.3 Market Share (%)/Ranking Analysis
- 6.4 Company Profiles (includes Global level Overview, Market level overview, Core Segments, Financials as available, Strategic Information, Market Rank/Share for key companies, Products and Services, and Recent Developments)
- 6.4.1 ARGOS
- 6.4.2 CALCO-BOLIVIA
- 6.4.3 Caleras San Juan
- 6.4.4 CALIDRA
- 6.4.5 Calizas Huayco SA
- 6.4.6 CALMOSCORP
- 6.4.7 Calpar Limestone Trading Ltd.
- 6.4.8 Carmeuse
- 6.4.9 GCCP Resources Limited
- 6.4.10 Graymont Limited
- 6.4.11 Gujarat Mineral Development Corporation Ltd.
- 6.4.12 Holcim
- 6.4.13 Imerys
- 6.4.14 J.M. Huber Corporation
- 6.4.15 Lhoist
- 6.4.16 Longcliffe Quarries Ltd
- 6.4.17 Minerals Technologies Inc
- 6.4.18 Nittetsu Mining Co. Ltd
- 6.4.19 Okutama Kogyo Co. Ltd
- 6.4.20 Omya AG
- 6.4.21 SCHAEFER KALK GmbH Co. and AG
7 Market Opportunities and Future Outlook
- 7.1 White-space and Unmet-Need Assessment
 2026年全球石灰石市场报告
 2026-2030年全球石灰石粉市场
 石灰石市场规模、份额和成长分析(按产品、类型、尺寸、最终用途产业和地区划分)-2026-2033年产业预测
 石灰石:全球市场份额和排名、总收入和需求预测(2025-2031 年)
 石灰石市场依产品类型、等级、应用和通路划分-2025-2032年全球预测
 石灰石粉的全球市场:类型·流程·用途·不同地区的预测 (~2032年)
 石灰石市场规模、份额、趋势分析报告:按产品、按最终用途、按地区、细分市场预测,2025-2030 年
 2030 年农业石灰石市场预测:按产品类型、应用、最终用户和地区分類的全球分析