


 |
市场调查报告书
商品编码
1907252
高光谱影像:市场占有率分析、产业趋势与统计、成长预测(2026-2031)Hyperspectral Imaging - Market Share Analysis, Industry Trends & Statistics, Growth Forecasts (2026 - 2031) |
||||||
※ 本网页内容可能与最新版本有所差异。详细情况请与我们联繫。
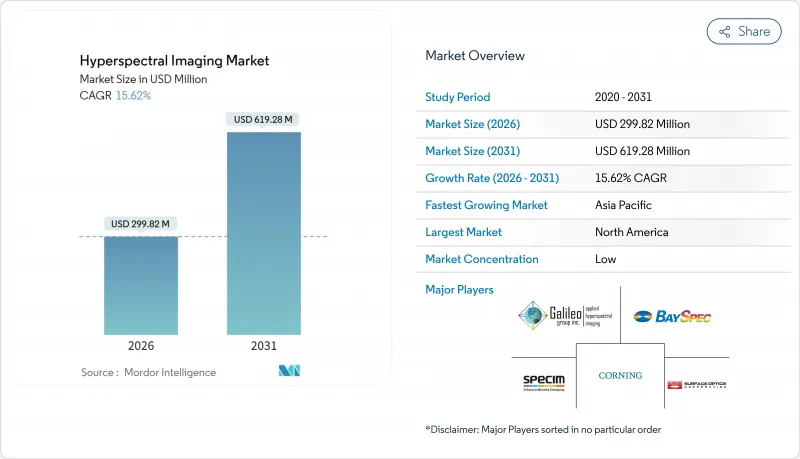
预计到 2026 年,高光谱影像市场规模将达到 2.9982 亿美元,高于 2025 年的 2.593 亿美元,预计到 2031 年将达到 6.1928 亿美元。
预计从 2026 年到 2031 年,其复合年增长率将达到 15.62%。
可见光近红外线/短波红外线感测器价格的下降、美国国防部天卫星群计画合约以及亚太地区政策支持下精密农业的推广,都推动了这一领域的扩张。供应商目前正将机器学习加速器整合到检测器中,以实现现场分析,从而无需笨重的工作站,并将决策週期缩短至毫秒级。同时,小型化简介相机在尺寸、重量和功耗方面实现了数量级的显着降低,使其能够应用于智慧型手机诊断等民用领域。美国政府为高光谱影像(HSI)任务提供的超过13亿美元的专案资金,确保了持续的需求,并加速了国防级技术在民用领域的应用。
全球高光谱影像市场趋势与洞察
整合基于人工智慧的片上分析
边缘神经网路直接整合在检测器阵列上,将即时吞吐量提升至超过 1.2 Tb/s。美国的 HyperThreAD 计画使无人机搭载的摄影机能够在数秒内识别化学威胁。这些进步降低了延迟和频宽负载,从而实现了农业分类机、回收机器人和工业生产线的自主品质评估。 Imec 的薄膜滤波器堆迭技术实现了 CMOS 等级製造,在降低单位成本的同时提高了影格速率,加速了其更广泛的商业应用。因此,人工智慧检测器有望成为物流、采矿和食品安全等领域下一代自主平台的核心。
VNIR/SWIR感测器成本快速降低
自 2024 年以来,InGaAs 晶圆产量比率翻了一番,共用后端封装生产线已实现与智慧型手机相机类似的经济效益,推动平均售价每年下降近 40%。预计到 2027 年,高光谱成像器将与中阶 CMOS 成像器的成本持平,并且在许多生产线上,高光谱遥测相机将从资本分支转变为耗材。加州大学戴维斯分校的压缩感知原型机在不影响光谱保真度的前提下,将光学元件的品质降低了 100 倍,进一步强化了这个通缩趋势。随着价格的下降,高光谱影像市场在汽车油漆检测、电子产品故障分析和工业计量等领域正蓬勃发展。
持续的校准漂移
在没有空调的工厂里,温度变化、振动和空气污染物会导致频谱校准每月劣化超过2%。基于LED的自校准器可以为高阶机载有效载荷实现5%以内的不确定度,但其5万美元的价格限制了其在高阶系统中的应用。用于食品分类和回收工厂的低成本设备仍然需要每週检验,这会扰乱工作流程并降低操作人员的信心。随着用户对免维护正常运作的需求日益增长,那些整合密封光学元件、板载参考来源和自适应演算法的供应商有机会赢得市场份额。
细分市场分析
到2025年,相机部分将占高光谱影像市场50.40%的份额,其中服务供应商的成长速度最快,复合年增长率(CAGR)高达16.05%。承包解决方案将感测器租赁、飞行操作和频谱打包在一起,使最终用户无需经历漫长的学习过程。 Headwall Photonics与GRYFN的合作体现了这种向託管服务的转变,该服务将无人机搭载的设备与云端原生控制面板相结合。国防和采矿业的监管审核越来越要求供应商获得认证,这进一步推动了该领域的成长。系统整合商透过为机器视觉维修客製化光学和照明设备来维持市场需求。例如,美国公司QinetiQ为监视和环境任务建立频谱库,并透过多年合约下的软体更新和资讯服务来获利。
到2025年,由于推扫式扫描仪在长时间曝光下仍能保持较高的信噪比(SNR),在高光谱影像市场中占据了61.20%的份额。矿业勘测和卫星载重依赖线扫描方法的均匀照明和频谱保真度。同时,简介式成像仪的复合年增长率(CAGR)达到了16.35%,它能够在单帧影像中捕捉完整的资料立方体,从而实现手持操作,并在农业田间调查和医疗内视镜检查中实现无模糊运动成像。
Specim公司的FX系列热成像推扫式摄影机就是一个混合创新的典范,它将中波段覆盖与机械扫描结合,用于工业炉和火炬的监测。可调滤波器装置可在特定波段提供足够的化学物质检测能力,而摆扫式设计仍效用于需要精确高空平台。
区域分析
北美在高光谱遥测成像市场占据领先地位,预计2025年将占据37.50%的市场。这主要得益于强劲的国防预算拨款、美国国立卫生研究院(NIH)的医学影像津贴以及创投对军民两用航太公司的创业投资投入。五年期的联邦成像合约确保了稳定的收入来源,而硅谷的新兴企业正在利用超过2400万美元的A轮资金筹措来建造低地球轨道卫星星系。与加拿大在北极监测方面的跨境合作也推动了感测器订单和资料处理服务需求的成长。
亚太地区以16.6%的复合年增长率实现了最快增长,这主要得益于中国的“数位乡村计划”和印度的“农业技术补贴计划”,这两项计划都要求实时报告作物健康状况。以苏州、新竹和大阪为中心的区域半导体产业丛集正在缩短前置作业时间并降低成本,当地的无人机整合商提供的光谱载荷组合价格低于1万美元。政府机构也正在对高光谱成像技术进行实地测试,用于河川污染监测和稀土元素资源探勘,从而提高多年专案规划的透明度。
欧洲在循环经济法规的指导下保持均衡成长。欧盟2030年城市垃圾回收率达到65%的目标,为光学分类机创造了稳定的需求。同时,欧洲太空总署支持的哥白尼计画扩建计画正在为高光谱遥测卫星服务资金筹措。德国正在推动工业自动化,法国专注于葡萄园病害预测,北欧国家则利用高光谱成像技术对木材品质进行评级。区域资料主权规则允许本地云端服务提供者提供符合规范的分析解决方案,从而增强了国内价值的保留。
其他福利:
- Excel格式的市场预测(ME)表
- 3个月的分析师支持
目录
第一章 引言
- 研究假设和市场定义
- 调查范围
第二章调查方法
第三章执行摘要
第四章 市场情势
- 市场概览
- 市场驱动因素
- 整合基于人工智慧的片上分析
- VNIR/SWIR感测器的成本迅速下降
- 在亚太地区扩大精密农业项目
- 美国/国防高级研究计划局 (DARPA) 为天基高光谱卫星群计画提供的资金
- 用于智慧型手机诊断的紧凑型简介 HSI
- 强制性ESG资讯揭露推动矿产等级检验
- 市场限制
- 现场部署单元中持续存在的校准漂移
- 高昂的资本投入和资料储存成本
- 美国和中国对感测器核心部件的出口管制制度
- 缺乏特定领域的频谱库
- 专利分析
- 技术概述 - 应用领域
- 监测
- 遥感探测
- 机器视觉/光学
- 医学诊断/检查
- 产业价值链分析
- 监管环境
- 波特五力分析
- 供应商的议价能力
- 买方的议价能力
- 新进入者的威胁
- 替代品的威胁
- 竞争对手之间的竞争
- 对宏观经济趋势的市场评估
第五章 市场规模与成长预测
- 报价
- 相机
- 系统整合商
- 服务供应商
- 透过技术
- 推扫式
- 简介
- 可调滤波器
- 成像傅立叶变换红外光谱
- 摆扫式
- 按波长
- 可见光和近红外线(NIR)
- 短波红外线 (SWIR)
- 中波红外线 (MWIR)
- 长波红外线 (LWIR)
- 按最终用户行业划分
- 食品和农业
- 卫生保健
- 防御
- 采矿与计量
- 回收利用
- 其他终端用户产业
- 按地区
- 北美洲
- 美国
- 加拿大
- 墨西哥
- 南美洲
- 巴西
- 阿根廷
- 南美洲其他地区
- 欧洲
- 德国
- 英国
- 法国
- 义大利
- 西班牙
- 其他欧洲地区
- 亚太地区
- 中国
- 日本
- 印度
- 韩国
- ASEAN
- 亚太其他地区
- 中东和非洲
- 中东
- 沙乌地阿拉伯
- 阿拉伯聯合大公国
- 其他中东地区
- 非洲
- 南非
- 埃及
- 其他非洲地区
- 中东
- 北美洲
第六章 竞争情势
- 市场集中度
- 策略趋势
- 市占率分析
- 公司简介
- Galileo Group, Inc.
- BaySpec Inc.
- Specim Spectral Imaging Ltd
- Corning Incorporated
- Surface Optics Corporation
- Headwall Photonics Inc.
- Resonon Inc.
- HyperMed Imaging Inc.
- Norsk Elektro Optikk AS
- Cubert GmbH
- XIMEA GmbH
- HinaLea Imaging(TruTag Technologies Inc.)
- ITRES Research Limited
- Telops Inc.
- Brimrose Corporation of America
- Teledyne DALSA Inc.
- ClydeHSI Ltd.
- ChemImage Corporation
- Diaspective Vision GmbH
- Applied Spectral Imaging Inc.
第七章 市场机会与未来展望
The hyperspectral imaging market size in 2026 is estimated at USD 299.82 million, growing from 2025 value of USD 259.30 million with 2031 projections showing USD 619.28 million, growing at 15.62% CAGR over 2026-2031.
This expansion rests on falling VNIR/SWIR sensor prices, Defense Department contracts for space-borne constellations, and policy-backed precision-agriculture roll-outs across Asia Pacific. Vendors now embed machine-learning accelerators inside detectors, enabling in-field analytics that eliminate bulky workstations and shorten decision cycles to milliseconds. At the same time, miniaturized snapshot cameras shrink size, weight, and power by two orders of magnitude, opening consumer channels such as smartphone diagnostics. Program funding that exceeds USD 1.3 billion for U.S. government HSI missions guarantees recurring demand and accelerates spillover of defense-grade technology into civilian applications.
Global Hyperspectral Imaging Market Trends and Insights
Integration of AI-based on-chip analytics
Edge neural networks now reside directly on detector arrays, pushing real-time throughput beyond 1.2 Tb/s. The U.S. Army's HyperThreAD program demonstrates chemical threat recognition in seconds from UAV-borne cameras. These advances cut latency, reduce bandwidth loads, and enable autonomous quality decisions in agricultural sorters, recycling robots, and industrial process lines. Broader commercial use is accelerating as thin-film filter stacks from Imec allow CMOS-level manufacturing, dropping unit costs while raising frame rates. As a result, AI-enabled detectors are poised to form the core of next-generation autonomous platforms in logistics, mining, and food safety.
Rapid cost erosion of VNIR/SWIR sensors
InGaAs wafer yields have doubled since 2024, and shared back-end packaging lines now mimic smartphone camera economics, pushing average selling prices down nearly 40% per year. Cost parity with mid-range CMOS imagers is expected by 2027, moving hyperspectral cameras from capital expense to consumable tool in many production lines. UC Davis compressive-sensing prototypes cut optics mass by 100X without spectral fidelity loss, reinforcing this deflationary trend. As prices retreat, the hyperspectral imaging market gains traction in automotive paint inspection, electronics failure analysis, and industrial metrology.
Persistent calibration drift
Temperature swings, vibration, and airborne contaminants degrade spectral alignment by more than 2% per month in unconditioned factories. While LED-based self-calibrators keep high-end airborne payloads within 5% uncertainty, their USD 50,000 price tag restricts use to premium systems. Budget units in food sorting and recycling plants still require weekly validation, disrupting workflows and lowering confidence among operators. Vendors that integrate sealed optics, on-board references, and adaptive algorithms are positioned to capture share as users seek maintenance-free uptime.
Other drivers and restraints analyzed in the detailed report include:
- Expanding precision-agriculture programs in APAC
- DoD/DARPA funding for space-borne hyperspectral constellations
- High CAPEX and data-storage costs
For complete list of drivers and restraints, kindly check the Table Of Contents.
Segment Analysis
The cameras segment captured 50.40% of the hyperspectral imaging market share in 2025, while service providers grew the fastest at a 16.05% CAGR. Turnkey models bundle sensor rental, flight operations, and spectral analytics, sparing end-users from steep learning curves. Headwall Photonics' alliance with GRYFN exemplifies this managed-service pivot, pairing UAV payloads with cloud-native dashboards. Regulatory audits in defense and mining increasingly stipulate certified providers, reinforcing the segment's momentum. System integrators sustain demand by customizing optics and illumination for machine-vision retrofits. QinetiQ US, for instance, curates spectral libraries for surveillance and environmental missions, monetizing software updates and data services over multiyear contracts
Pushbroom scanners captured 61.20% of hyperspectral imaging market share in 2025 thanks to high SNR across long dwell times. Mining surveys and satellite payloads rely on the line-scan method's uniform illumination and spectral fidelity. Snapshot imagers, however, posted a 16.35% CAGR, capturing full data cubes in a single frame and enabling handheld, jitter-free operation for field agronomy and medical endoscopy.
Hybrid innovations such as Specim's FX-series thermal pushbroom camera marry mid-wave coverage with mechanical scanning to serve industrial furnaces and flare monitoring. Tunable-filter rigs address chemical sensing where selective bands suffice, while whiskbroom architectures retain relevance on high-altitude platforms demanding pinpoint targeting.
The Hyperspectral Imaging Market Report is Segmented by Offering (Cameras, System Integrator, and Service Provider), Technology (Pushbroom, Snapshot, Tunable Filter, and More), Wavelength (Visible and NIR, SWIR, MWIR, and More), End-User Industry (Food and Agriculture, Healthcare, Defense, Mining and Metrology and More), and Geography (North America, Europe, and More). The Market Forecasts are Provided in Terms of Value (USD).
Geography Analysis
North America led with 37.50% hyperspectral imaging market size in 2025, driven by strong defense allocations, NIH-funded medical imaging grants, and robust venture capital for dual-use space companies. Federal five-year imagery contracts guarantee steady revenue streams, while Silicon Valley startups tap USD 24 million-plus Series A rounds to build low-Earth-orbit constellations. Cross-border collaboration with Canada on Arctic monitoring generates incremental sensor orders and data-processing services.
Asia Pacific posts the fastest expansion at 16.6% CAGR, propelled by China's Digital Village Initiative and India's agri-tech subsidies, both mandating real-time crop-health reporting. Regional semiconductor clusters around Suzhou, Hsinchu, and Osaka shorten lead times and compress costs, letting local drone integrators bundle spectral payloads below USD 10,000. Governments also field-test HSI for river-pollution tracking and rare-earth exploration, adding multi-year pipeline visibility.
Europe maintains balanced growth anchored in circular-economy regulations. The EU target of 65% municipal-waste recycling by 2030 creates a stable pull for optical sorters, while ESA-backed Copernicus expansion funds hyperspectral satellite services. Germany champions industrial automation, France focuses on vineyard disease prediction, and Nordic countries leverage HSI for timber-quality grading. Regional data-sovereignty rules stimulate local cloud providers to offer compliant analytics stacks, reinforcing domestic value retention.
- Galileo Group, Inc.
- BaySpec Inc.
- Specim Spectral Imaging Ltd
- Corning Incorporated
- Surface Optics Corporation
- Headwall Photonics Inc.
- Resonon Inc.
- HyperMed Imaging Inc.
- Norsk Elektro Optikk AS
- Cubert GmbH
- XIMEA GmbH
- HinaLea Imaging (TruTag Technologies Inc.)
- ITRES Research Limited
- Telops Inc.
- Brimrose Corporation of America
- Teledyne DALSA Inc.
- ClydeHSI Ltd.
- ChemImage Corporation
- Diaspective Vision GmbH
- Applied Spectral Imaging Inc.
Additional Benefits:
- The market estimate (ME) sheet in Excel format
- 3 months of analyst support
TABLE OF CONTENTS
1 INTRODUCTION
- 1.1 Study Assumptions and Market Definition
- 1.2 Scope of the Study
2 RESEARCH METHODOLOGY
3 EXECUTIVE SUMMARY
4 MARKET LANDSCAPE
- 4.1 Market Overview
- 4.2 Market Drivers
- 4.2.1 Integration of AI-based on-chip analytics
- 4.2.2 Rapid cost erosion of VNIR/SWIR sensors
- 4.2.3 Expanding precision-agriculture programs in APAC
- 4.2.4 DoD/DARPA funding for space-borne HSI constellations
- 4.2.5 Miniaturized snapshot HSI for smartphone diagnostics
- 4.2.6 Mandatory ESG disclosure driving mineral-grade verification
- 4.3 Market Restraints
- 4.3.1 Persistent calibration drift in field-deployable units
- 4.3.2 High CAPEX and data-storage costs
- 4.3.3 US-China export-control regimes on sensor cores
- 4.3.4 Scarcity of domain-specific spectral libraries
- 4.4 Patent Analysis
- 4.5 Technology Snapshot - Applications
- 4.5.1 Surveillance
- 4.5.2 Remote Sensing
- 4.5.3 Machine Vision/Optical
- 4.5.4 Medical Diagnostics/Research
- 4.6 Industry Value Chain Analysis
- 4.7 Regulatory Landscape
- 4.8 Porter's Five Forces Analysis
- 4.8.1 Bargaining Power of Suppliers
- 4.8.2 Bargaining Power of Buyers
- 4.8.3 Threat of New Entrants
- 4.8.4 Threat of Substitutes
- 4.8.5 Intensity of Competitive Rivalry
- 4.9 Assessment of Macro-economic Trends on the Market
5 MARKET SIZE AND GROWTH FORECASTS (VALUE)
- 5.1 By Offering
- 5.1.1 Cameras
- 5.1.2 System Integrator
- 5.1.3 Service Provider
- 5.2 By Technology
- 5.2.1 Pushbroom
- 5.2.2 Snapshot
- 5.2.3 Tunable Filter
- 5.2.4 Imaging FTIR
- 5.2.5 Whiskbroom
- 5.3 By Wavelength
- 5.3.1 Visible and NIR (Near-Infrared)
- 5.3.2 SWIR (Short-Wave Infrared)
- 5.3.3 MWIR (Mid-Wave Infrared)
- 5.3.4 LWIR (Long-Wave Infrared)
- 5.4 By End-user Industry
- 5.4.1 Food and Agriculture
- 5.4.2 Healthcare
- 5.4.3 Defense
- 5.4.4 Mining and Metrology
- 5.4.5 Recycling
- 5.4.6 Other End-user Industries
- 5.5 By Geography
- 5.5.1 North America
- 5.5.1.1 United States
- 5.5.1.2 Canada
- 5.5.1.3 Mexico
- 5.5.2 South America
- 5.5.2.1 Brazil
- 5.5.2.2 Argentina
- 5.5.2.3 Rest of South America
- 5.5.3 Europe
- 5.5.3.1 Germany
- 5.5.3.2 United Kingdom
- 5.5.3.3 France
- 5.5.3.4 Italy
- 5.5.3.5 Spain
- 5.5.3.6 Rest of Europe
- 5.5.4 Asia Pacific
- 5.5.4.1 China
- 5.5.4.2 Japan
- 5.5.4.3 India
- 5.5.4.4 South Korea
- 5.5.4.5 ASEAN
- 5.5.4.6 Rest of Asia Pacific
- 5.5.5 Middle East and Africa
- 5.5.5.1 Middle East
- 5.5.5.1.1 Saudi Arabia
- 5.5.5.1.2 United Arab Emirates
- 5.5.5.1.3 Rest of Middle East
- 5.5.5.2 Africa
- 5.5.5.2.1 South Africa
- 5.5.5.2.2 Egypt
- 5.5.5.2.3 Rest of Africa
- 5.5.5.1 Middle East
- 5.5.1 North America
6 COMPETITIVE LANDSCAPE
- 6.1 Market Concentration
- 6.2 Strategic Moves
- 6.3 Market Share Analysis
- 6.4 Company Profiles (includes Global level Overview, Market level overview, Core Segments, Financials as available, Strategic Information, Market Rank/Share for key companies, Products & Services, and Recent Developments)
- 6.4.1 Galileo Group, Inc.
- 6.4.2 BaySpec Inc.
- 6.4.3 Specim Spectral Imaging Ltd
- 6.4.4 Corning Incorporated
- 6.4.5 Surface Optics Corporation
- 6.4.6 Headwall Photonics Inc.
- 6.4.7 Resonon Inc.
- 6.4.8 HyperMed Imaging Inc.
- 6.4.9 Norsk Elektro Optikk AS
- 6.4.10 Cubert GmbH
- 6.4.11 XIMEA GmbH
- 6.4.12 HinaLea Imaging (TruTag Technologies Inc.)
- 6.4.13 ITRES Research Limited
- 6.4.14 Telops Inc.
- 6.4.15 Brimrose Corporation of America
- 6.4.16 Teledyne DALSA Inc.
- 6.4.17 ClydeHSI Ltd.
- 6.4.18 ChemImage Corporation
- 6.4.19 Diaspective Vision GmbH
- 6.4.20 Applied Spectral Imaging Inc.
7 MARKET OPPORTUNITIES AND FUTURE OUTLOOK
- 7.1 White-space and Unmet-Need Assessment
 农业高光谱影像市场:按平台、感测器、应用和最终用户划分-2026-2032年全球市场预测
 2026年全球高光谱影像系统市场报告
 高光谱成像系统市场:依产品、技术和应用划分 - 全球预测至 2036 年2026年全球超音波乳化设备市场报告
 2026-2034年全球医用高光谱影像系统市场规模、份额、趋势及成长分析报告
 高光谱影像系统市场-全球产业规模、份额、趋势、机会、预测:按产品、技术、应用、地区和竞争格局划分,2021-2031年
 高光谱影像市场,全球市场 2026-2030 年全球医用高光谱成像市场:市场规模、占有率、成长率、产业分析、依类型、应用和地区划分的分析以及未来预测(2026-2034)
 高光谱和多光谱成像市场(2025):技术、应用和市场趋势
 机载高光谱遥测成像相机:全球市占率及排名、总收入及需求预测(2025-2031年)