


 |
市场调查报告书
商品编码
1907262
再生PET-市场占有率分析、产业趋势与统计、成长预测(2026-2031年)Recyclate PET - Market Share Analysis, Industry Trends & Statistics, Growth Forecasts (2026 - 2031) |
||||||
※ 本网页内容可能与最新版本有所差异。详细情况请与我们联繫。
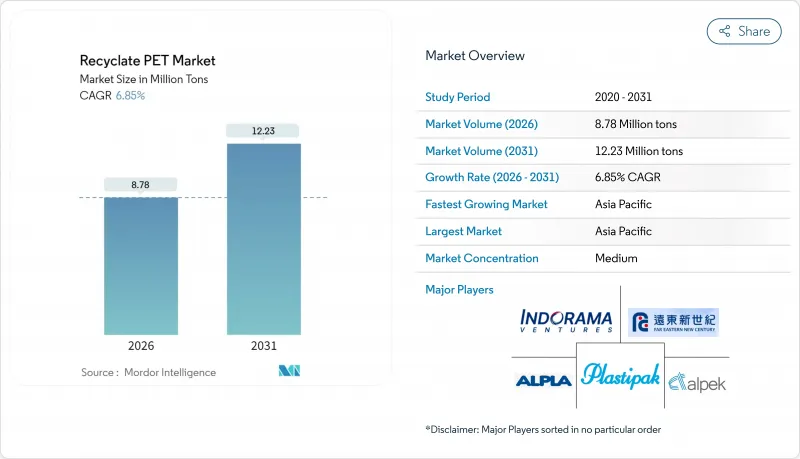
预计再生PET市场将从2025年的822万吨成长到2026年的878万吨,到2031年达到1,223万吨,2026年至2031年的复合年增长率为6.85%。
监管要求、品牌所有者不断提高的采购目标以及原生树脂和再生树脂成本的趋同,正在推动再生PET市场结构性需求的转变。瓶到瓶循环利用在欧洲已成为一项法律要求,而美国12个州正在2024年至2025年初期间实施生产者延伸责任制(EPR)法律,以加强回收和再生材料含量的强制性要求。亚太地区的成长正在加速,这得益于中国2025年35%的再生材料含量强制性要求以及印度根据2024年《塑胶废弃物管理修正规则》分阶段实施EPR。酶解和溶剂解技术的进步使得利用以往降级回收的有色和不透明材料生产食品级产品成为可能,从而扩大了消费后资源的应用范围。竞争格局正在改变。大型综合石化公司正透过机械和化学加工能力来规避业务风险,而废弃物管理公司则正在增加分类和清洗生产线,以获取整个价值链的收益。
全球再生PET市场趋势与洞察
更严格的再生材料含量要求推动了结构性需求。
欧盟的《包装和包装废弃物法规》为PET饮料瓶制定了具有约束力的再生材料含量标准:到2025年达到25%,到2030年达到30%,将自愿承诺转化为法律要求。美国目前有12个州已实施生产者延伸责任制(EPR)法律,强制规定最低再生材料含量,其中加州的SB54法案走在前列,规定到2030年再生材料含量目标为50%。中国国家发展和改革委员会宣布,自2025年1月起,再生材料含量必须达到35%,这将使原本出口的国内塑胶碎片重新分配到国内市场。印度修订后的《塑胶废弃物管理条例》要求品牌所有者收集和回收相当于其年塑胶使用量的塑料,从而促进回收资产的货币化。总而言之,这些法规为再生PET市场的机械和化学加工能力提供了法律保障,并支持了相关资本投资。
品牌承诺确保长期忠诚度
包括可口可乐、百事可乐、联合利华、雀巢和达能在内的全球饮料和消费品巨头承诺,到2030年,其PET原料的25%至50%将来自回收材料。以目前的包装量计算,预计将每年增加约200万吨的需求。根据可口可乐2024年永续发展报告,该公司瓶子的再生材料含量为23%,并且与Indorama Ventures和Loop Industries签订的多年承购协议确保了食品级PET薄片的供应,直至2028年。百事可乐与Carbonlite的合资企业将于2026年开始在德克萨斯州每年供应6万吨瓶对瓶再生树脂,以确保供应稳定并降低现货市场波动的风险。联合利华已拨款10亿磅用于永续包装,并投入大量资金用于化学回收PET,以实现其品牌目标。这些具有约束力的协议提供了收入确定性,降低了新工厂的资金筹措风险,同时加快了再生PET市场的扩张计划。
收集基础设施不足限制了原料供应。
印度、印尼、奈及利亚和巴西的回收率在20%到40%之间,远低于德国押金返还制度90%的回收率。非正规的废弃物收集网路普遍存在,但由于缺乏收集和品管流程,导致包装袋的污染率超过15%,不符合食品级标准。在印尼,都市区废弃物覆盖率仅40%,迫使回收商承担额外的重新分类成本,并降低了机器的运转率。在奈及利亚,新的生产者责任延伸制度尚未实施,导致押金制度基础设施资金不足,原料转用于出口。在巴西,由于缺乏逆向物流资源,到2024年,瓶子回收率将维持在25%,儘管包装加工商的需求强劲,但国内供应仍有限。
细分市场分析
2025年,PET短纤维占再生PET市场产量的41.20%。受服装产业范围3排放目标的推动,预计到2031年,该细分市场将以7.05%的复合年增长率成长。同期,再生PET短纤维市场规模预计将额外成长140万吨,主要得益于H&M、Inditex和Nike等品牌的采购承诺。这些品牌已与远东新世纪和江苏中原签署供应协议,确保在包装严重短缺的情况下纤维供应稳定。机械回收商更倾向于使用短纤维,因为与瓶装应用相比,短纤维对黏度的要求较低,并且允许混入一些低品质材料。
截至2025年, 宝特瓶(包括食品级和非食品级)占总量的35.00%。由于欧洲和北美强制要求到2030年使用25-30%的再生材料,食品瓶树脂的增长更为显着,这推高了价格并促成了长期合约的签订。 PET片材和薄膜的需求主要来自医药和电子产品的热成型包装,这些产业优先考虑使用再生材料。 PET打包带面临原生聚丙烯的竞争,这给欧洲以外(有押金规定的市场)的利润率带来了压力。其他特种产品类型,包括工程树脂,也正经历稳定成长,因为汽车製造商正在试行在非承重零件中使用再生PET。
本再生PET市场报告按产品类型(PET短纤维、PET打包带、PET片材或薄膜、食品级宝特瓶、非食品级宝特瓶及其他产品类型)、应用领域(包装、工业纱线、建材及其他应用)和地区(北美、南美、欧洲、亚太、中东和非洲)进行分析。市场预测以吨为单位。
区域分析
预计到2025年,亚太地区将占全球再生PET市场份额的42.85%,并在2031年之前维持8.05%的复合年增长率,展现出最快的区域成长动能。中国到2025年强制要求再生PET含量达到35%,促使出口产能转向国内瓶装业者,加剧了PET包的竞争,并推高了PET片的价格。印度的生产者责任延伸制度(EPR)于2024年正式认证了1200家回收企业,促进了非食品级PET转化为食品级PET产能的研究。日本延长了《塑胶资源循环法》的适用期限,要求在2030年再生PET含量达到50%。这促使三得利和朝日製药签署了一项为期10年的承购协议。越南和印尼等东南亚市场已吸引多边融资用于回收基础设施建设,但由于源头分类有限,PET套件的品质仍然不稳定。
欧洲已成为成熟的回收中心,其押金返还制度的回收率超过90%,确保了高品质材料的稳定供应。德国的押金返还制度在2024年实现了98%的瓶子回收率,支撑了62万吨的机械处理能力。西班牙和义大利将分别于2025年和2026年实施押金返还制度,统一欧盟范围内的再生材料含量要求,并鼓励跨境投资。法国和荷兰化学回收能力的扩建将新增15万吨食品级高品质产品,使成长重心从机械处理转向先进回收技术。
由于各州法规不尽相同,北美地区的进展并不均衡,但总体而言,进展稳步推进。加州、奥勒冈州州、缅因州、科罗拉多和新泽西州已颁布法律,要求饮料容器必须含有15%至50%的再生材料,这促成了百事可乐与CarbonLite、Indorama与Loop等合资企业的成立。加拿大的联邦塑胶登记制度实现了全国范围内的透明度,而墨西哥2024年的法律引入了宝特瓶的生产者延伸责任制(EPR),促使Alpec公司对其位于托卢卡的工厂进行维修,以生产食品级PET瓶。在美国,联邦层级的不一致使得合规工作较为复杂,但也促使了区域中心的建立,这些中心透过集中式设施服务于多个州。
其他福利:
- Excel格式的市场预测(ME)表
- 3个月的分析师支持
目录
第一章 引言
- 研究假设和市场定义
- 调查范围
第二章调查方法
第三章执行摘要
第四章 市场情势
- 市场概览
- 市场驱动因素
- 更严格的再生材料含量要求(欧盟包装废弃物指令、塑胶包装法规、美国州生产者延伸责任制)
- 品牌主导的2030年净零排放与再生PET采购目标
- 在高含油量情境下,再生PET切片与原生PET的成本平衡
- 扩大解聚技术规模,生产食品级有色再生PET
- 人工智慧驱动的光学分选技术提高了草捆的纯度和产量
- 市场限制
- 新兴经济体宝特瓶回收面临的挑战
- 原生PET供应过剩週期对再生PET利润率带来压力
- 先进回收技术和食品级合规性的高昂资本投资成本
- 价值链分析
- 波特五力模型
- 新进入者的威胁
- 供应商的议价能力
- 买方的议价能力
- 替代品的威胁
- 竞争对手之间的竞争
第五章 市场规模与成长预测
- 依产品类型
- PET短纤维
- PET錶带
- PET片材或薄膜
- 宝特瓶(食品用)
- 宝特瓶(非食品级)
- 其他产品类型
- 透过使用
- 包装
- 工业纱线
- 建材
- 其他用途
- 按地区
- 北美洲
- 美国
- 加拿大
- 墨西哥
- 南美洲
- 巴西
- 阿根廷
- 哥伦比亚
- 其他南美洲
- 欧洲
- 德国
- 英国
- 法国
- 义大利
- 西班牙
- 北欧国家
- 土耳其
- 俄罗斯
- 其他欧洲地区
- 亚太地区
- 中国
- 印度
- 日本
- 韩国
- 马来西亚
- 泰国
- 印尼
- 越南
- 亚太其他地区
- 中东和非洲
- 沙乌地阿拉伯
- 卡达
- 阿拉伯聯合大公国
- 奈及利亚
- 埃及
- 南非
- 其他中东和非洲地区
- 北美洲
第六章 竞争情势
- 市场集中度
- 策略趋势
- 市占率(%)/排名分析
- 公司简介
- Alpek SAB de CV
- Alpla Group
- Biffa
- Evergreen
- Far Eastern New Century Corporation
- Ganesha Ecosphere Ltd.
- Indorama Ventures Public Company Limited
- Jiangsu Zhongyuan Industrial Group Co. Ltd
- Loop Industries Inc.
- Phoenix Technologies
- Plastipak Holdings Inc.
- PolyQuest Inc.
- Reliance Industries Ltd
- SUEZ
- Veolia
- Verdeco Recycling Inc.
- Visy
第七章 市场机会与未来展望
The recyclate PET market is expected to grow from 8.22 million tons in 2025 to 8.78 million tons in 2026 and is forecast to reach 12.23 million tons by 2031 at 6.85% CAGR over 2026-2031.
Regulatory mandates, rising brand-owner procurement targets, and cost convergence between virgin and recycled resin are jointly propelling structural demand shifts in the recyclate PET market. In Europe, bottle-to-bottle circularity is now embedded in law, while 12 U.S. states adopted Extended Producer Responsibility (EPR) statutes between 2024 and early 2025, reinforcing collection and recycled-content obligations. Asia-Pacific growth is accelerating on the back of China's 35% recycled-content mandate for 2025 and India's staged EPR roll-out under the 2024 Plastic Waste Management Amendment Rules. Parallel advances in enzymatic and solvent-based depolymerization enable food-grade output from formerly downcycled colored and opaque feedstock, thereby widening the addressable pool of post-consumer materials. Competitive dynamics are shifting as integrated petrochemical majors hedge their operations with both mechanical and chemical capacity, while waste-management operators add sorting and washing lines to capture margins across the value chain.
Global Recyclate PET Market Trends and Insights
Stricter Recycled-Content Mandates Drive Structural Demand
The European Union's Packaging and Packaging Waste Regulation sets binding recycled-content thresholds of 25% in 2025 and 30% in 2030 for PET beverage bottles, effectively turning voluntary pledges into legal requirements. Twelve U.S. states now enforce EPR statutes that impose minimum recycled content, with California's SB 54 leading the way, which increases to 50% by 2030. China's National Development and Reform Commission issued a 35% recycled-content mandate effective January 2025, redirecting domestic flake that formerly entered export channels. India's amended Plastic Waste Management Rules require brand owners to match their annual plastic footprints with equivalent collection and recycling efforts, thereby monetizing their collection assets. Collectively, these mandates create a legally guaranteed offtake, underpinning capital deployment in both mechanical and chemical capacity across the recyclate PET market.
Brand Commitments Anchor Long-Term Offtake
Global beverage and consumer-goods majors, including Coca-Cola, PepsiCo, Unilever, Nestle, and Danone, have pledged to source 25-50% of their PET from recycled materials by 2030, resulting in approximately 2 million tons of incremental demand annually at current packaging volumes. Coca-Cola's 2024 sustainability report shows 23% recycled content in its bottles and details multi-year offtake with Indorama Ventures and Loop Industries to secure food-grade flake through 2028. PepsiCo's joint venture with CarbonLite will deliver 60,000 tons per year of bottle-to-bottle resin in Texas starting in 2026, securing supply and mitigating spot-market volatility. Unilever earmarked GBP 1 billion for sustainable packaging, with a sizable allocation for chemical-recycled PET to meet branding goals. These binding contracts provide revenue certainty, derisking new plant financing, and accelerating expansion plans across the recyclate PET market.
Collection Infrastructure Gaps Constrain Feedstock
Collection rates in India, Indonesia, Nigeria, and Brazil range from 20% to 40%, far below the 90% achieved in German deposit-return systems. Informal waste-picker networks dominate, yet they lack aggregation and quality control processes, resulting in bales with more than 15% contamination that fail to meet food-grade standards. Indonesia's municipal waste coverage spans only 40% of urban zones, forcing recyclers to spend more on re-sorting and thus curbing machine utilization. Nigeria's nascent EPR scheme remains unenforced, leaving deposit infrastructure unfunded and feedstock redirected to export. Brazil's under-resourced reverse logistics collected only 25% of bottles in 2024, limiting local supply despite strong demand from packaging converters.
Other drivers and restraints analyzed in the detailed report include:
- Cost Parity Emerges in High-Oil Scenarios
- Depolymerization Unlocks Food-Grade Colored Feedstock
- Virgin-PET Oversupply Cycles Compress Margins
For complete list of drivers and restraints, kindly check the Table Of Contents.
Segment Analysis
PET staple fiber accounted for 41.20% of the 2025 volume in the recyclate PET market. The segment is expected to grow at a 7.05% CAGR through 2031, driven by apparel-sector Scope 3 reduction goals. The recyclate PET market size for staple fiber is forecast to expand by an additional 1.4 million tons over the period, underpinned by sourcing commitments from H&M, Inditex, and Nike. These brands have locked supply contracts with Far Eastern New Century and Jiangsu Zhongyuan, ensuring fiber offtake in a tightening bale environment. Mechanical recyclers prefer staple fiber because the viscosity requirements are less stringent than those in bottle applications, allowing the inclusion of lower-grade feedstock.
PET bottles, encompassing both food-grade and non-food-grade formats, accounted for 35.00% of the volume in 2025. Food-grade bottle resin is expanding faster because European and North American laws mandate 25-30% recycled content by 2030, driving premium pricing and long-term contracts. PET sheets or films demand is driven by thermoformed packaging for pharmaceuticals and electronics that value recycled content. PET straps witness pricing competition from virgin polypropylene, which constrains margins outside deposit-driven European markets. Other specialty product types, including engineering resins, are growing steadily as automakers test recycled PET in non-load-bearing parts.
The Recyclate PET Market Report is Segmented by Product Type (PET Staple Fiber, PET Straps, PET Sheets or Films, PET Bottles Food Grade, PET Bottles Non-Food Grade, and Other Product Types), Application (Packaging, Industrial Yarn, Building Materials, and Other Applications), and Geography (North America, South America, Europe, Asia-Pacific, and Middle-East and Africa). The Market Forecasts are Provided in Terms of Volume (Tons).
Geography Analysis
Asia-Pacific contributed 42.85% of 2025 volume and is forecast to post an 8.05% CAGR to 2031, the fastest regional trajectory for the recyclate PET market. China's 35% recycled-content rule, effective 2025, has redirected export-oriented capacity toward domestic bottlers, tightening bale competition and lifting flake pricing. India's EPR program formalized 1,200 recycler certificates in 2024, catalyzing capacity upgrades from sub-food to food grade. Japan extended its Plastic Resource Circulation Act, stipulating 50% recycled content by 2030, prompting Suntory and Asahi to sign decade-long offtake agreements. Southeast Asian markets such as Vietnam and Indonesia attract multilateral financing for collection infrastructure, yet bale quality remains inconsistent due to limited source segregation.
Europe remains an established hub with deposit-return systems that deliver >90% collection, ensuring a steady supply of high-quality feedstock. Germany's Pfandsystem recovered 98% of bottles in 2024, feeding 620,000 tons of mechanical capacity. Spain and Italy will adopt deposit-return in 2025 and 2026, respectively, harmonizing recycled-content requirements across the bloc and encouraging cross-border investments. Chemical-recycling build-outs in France and the Netherlands add 150,000 tons of premium food-grade output, shifting incremental growth toward advanced recycling rather than mechanical throughput.
North America is fragmented but advancing due to state-level mandates. California, Oregon, Maine, Colorado, and New Jersey now legislate 15-50% recycled content in beverage containers, compelling joint ventures like PepsiCo-CarbonLite and Indorama-Loop. Canada's federal Plastics Registry brings national transparency, while Mexico's 2024 law introduces EPR for PET bottles, spurring Alpek to retrofit its Toluca plant for food-grade production. Federal-level inconsistency in the United States creates compliance complexity, yet also incentivizes regional hubs that service multiple states from centralized facilities.
- Alpek S.A.B. de C.V.
- Alpla Group
- Biffa
- Evergreen
- Far Eastern New Century Corporation
- Ganesha Ecosphere Ltd.
- Indorama Ventures Public Company Limited
- Jiangsu Zhongyuan Industrial Group Co. Ltd
- Loop Industries Inc.
- Phoenix Technologies
- Plastipak Holdings Inc.
- PolyQuest Inc.
- Reliance Industries Ltd
- SUEZ
- Veolia
- Verdeco Recycling Inc.
- Visy
Additional Benefits:
- The market estimate (ME) sheet in Excel format
- 3 months of analyst support
TABLE OF CONTENTS
1 Introduction
- 1.1 Study Assumptions and Market Definition
- 1.2 Scope of the Study
2 Research Methodology
3 Executive Summary
4 Market Landscape
- 4.1 Market Overview
- 4.2 Market Drivers
- 4.2.1 Stricter recycled-content mandates (EU SUPD, PPWR, US state EPR)
- 4.2.2 Brand-led 2030 net-zero and recycled PET procurement targets
- 4.2.3 Cost parity of rPET chips vs. virgin PET in high-oil scenarios
- 4.2.4 Scale-up of depolymerisation unlocking food-grade coloured rPET
- 4.2.5 AI-enabled optical sorting boosting bale purity and yield
- 4.3 Market Restraints
- 4.3.1 PET bottle collection gaps in emerging economies
- 4.3.2 Virgin-PET oversupply cycles depressing rPET margins
- 4.3.3 High CAPEX for advanced recycling and food-grade compliance
- 4.4 Value Chain Analysis
- 4.5 Porter's Five Forces
- 4.5.1 Threat of New Entrants
- 4.5.2 Bargaining Power of Suppliers
- 4.5.3 Bargaining Power of Buyers
- 4.5.4 Threat of Substitutes
- 4.5.5 Competitive Rivalry
5 Market Size and Growth Forecasts (Volume)
- 5.1 By Product Type
- 5.1.1 PET Staple Fiber
- 5.1.2 PET Straps
- 5.1.3 PET Sheets or Films
- 5.1.4 PET Bottles (Food Grade)
- 5.1.5 PET Bottles (Non-food Grade)
- 5.1.6 Other Product Types
- 5.2 By Application
- 5.2.1 Packaging
- 5.2.2 Industrial Yarn
- 5.2.3 Building Materials
- 5.2.4 Other Applications
- 5.3 By Geography
- 5.3.1 North America
- 5.3.1.1 United States
- 5.3.1.2 Canada
- 5.3.1.3 Mexico
- 5.3.2 South America
- 5.3.2.1 Brazil
- 5.3.2.2 Argentina
- 5.3.2.3 Colombia
- 5.3.2.4 Rest of South America
- 5.3.3 Europe
- 5.3.3.1 Germany
- 5.3.3.2 United Kingdom
- 5.3.3.3 France
- 5.3.3.4 Italy
- 5.3.3.5 Spain
- 5.3.3.6 NORDIC Countries
- 5.3.3.7 Turkey
- 5.3.3.8 Russia
- 5.3.3.9 Rest of Europe
- 5.3.4 Asia-Pacific
- 5.3.4.1 China
- 5.3.4.2 India
- 5.3.4.3 Japan
- 5.3.4.4 South Korea
- 5.3.4.5 Malaysia
- 5.3.4.6 Thailand
- 5.3.4.7 Indonesia
- 5.3.4.8 Vietnam
- 5.3.4.9 Rest of Asia-Pacific
- 5.3.5 Middle-East and Africa
- 5.3.5.1 Saudi Arabia
- 5.3.5.2 Qatar
- 5.3.5.3 United Arab Emirates
- 5.3.5.4 Nigeria
- 5.3.5.5 Egypt
- 5.3.5.6 South Africa
- 5.3.5.7 Rest of Middle-East and Africa
- 5.3.1 North America
6 Competitive Landscape
- 6.1 Market Concentration
- 6.2 Strategic Moves
- 6.3 Market Share (%)/Ranking Analysis
- 6.4 Company Profiles (includes Global level Overview, Market level overview, Core Segments, Financials as available, Strategic Information, Market Rank/Share for key companies, Products and Services, and Recent Developments)
- 6.4.1 Alpek S.A.B. de C.V.
- 6.4.2 Alpla Group
- 6.4.3 Biffa
- 6.4.4 Evergreen
- 6.4.5 Far Eastern New Century Corporation
- 6.4.6 Ganesha Ecosphere Ltd.
- 6.4.7 Indorama Ventures Public Company Limited
- 6.4.8 Jiangsu Zhongyuan Industrial Group Co. Ltd
- 6.4.9 Loop Industries Inc.
- 6.4.10 Phoenix Technologies
- 6.4.11 Plastipak Holdings Inc.
- 6.4.12 PolyQuest Inc.
- 6.4.13 Reliance Industries Ltd
- 6.4.14 SUEZ
- 6.4.15 Veolia
- 6.4.16 Verdeco Recycling Inc.
- 6.4.17 Visy
7 Market Opportunities and Future Outlook
- 7.1 White-space and Unmet-Need Assessment
 全球热洗无色R- 宝特瓶瓶级片状和颗粒状塑胶市场规模、份额、趋势和成长分析报告(2026-2034年)
 按产品类型、回收製程、等级、应用和最终用途产业分類的再生PET切片市场-2026-2032年全球预测依产品类型、来源、回收製程、生产技术、等级、最终用途及通路分類的再生PET市场-2025-2032年全球预测再生PET部分取向纱市场(依应用、产品等级、类型、製程及通路)-2025-2032年全球预测
 2032 年再生 PET 市场预测:按类型、等级、来源、颜色、包装类型、回收流程、应用、最终用户和地区进行的全球分析
 全球瓶级高温清洗无色R- 宝特瓶市场全球再生PET(r-PET)瓶市场规模(依产品、等级、回收製程、应用和区域范围)预测
 再生PET市场规模、份额及成长分析(按类型、等级、来源、颜色、应用和地区)-2025-2032年产业预测
 热洗无色 R-PET 瓶级薄片和颗粒市场,按产品类型、加工类型、等级、最终用户、国家和地区 - 2024-2032 年行业分析、市场规模、市场份额和预测
 全球再生PET市场(2016-2036)