


 |
市场调查报告书
商品编码
1907295
玻璃纤维:市场占有率分析、产业趋势与统计、成长预测(2026-2031)Glass Fiber - Market Share Analysis, Industry Trends & Statistics, Growth Forecasts (2026 - 2031) |
||||||
※ 本网页内容可能与最新版本有所差异。详细情况请与我们联繫。
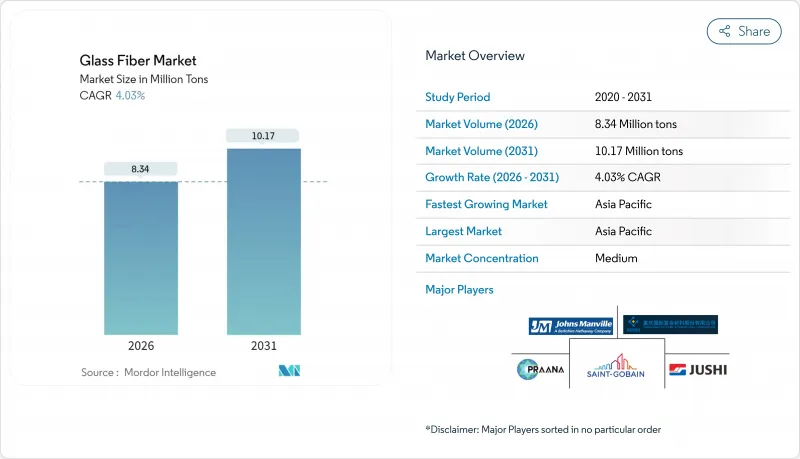
2025年玻璃纤维市场价值为802万吨,预计2031年将达到1,017万吨,高于2026年的834万吨。
预计在预测期(2026-2031 年)内,复合年增长率将达到 4.03%。
需求韧性反映了该材料兼具抗拉强度、耐腐蚀性和成本效益的独特优势,使其在基础设施、运输和能源系统中持续取代金属和其他传统材料。疫情导致的经济放缓之后,建筑隔热材料的订单迅速恢復。电动车 (EV) 专案加速了复合材料在汽车平台中的应用,而风力发电发展则推动了叶片产量创下新高。这三大需求支柱,以及低碳生产线和闭合迴路回收等产品创新,正帮助生产商抵御不断上涨的原料成本和贸易不确定性。产能合理化和区域自给自足计画也在重塑竞争策略,供应商正将自身定位在更靠近终端用户成长中心的位置。
全球玻璃纤维市场趋势与洞察
疫情后建筑业的加速发展推动了对玻璃绒的需求。
2024年,亚太地区的建筑支出强劲反弹,各国政府纷纷实施经济奖励策略,其中包括资料中心园区、半导体工厂和公共交通网路等项目。这些计划指定使用高性能隔热材料以减少营运过程中的碳排放,玻璃棉在玻璃纤维市场的竞标清单中优先于其他R值较低的替代品。在印度,绿建筑认证正被纳入市政审批流程,鼓励开发商选择可回收和阻燃的隔热材料。由于玻璃纤维增强聚合物(GFRP)钢筋在水下环境中的腐蚀速度比钢材慢,因此在地下交通走廊中越来越受到关注。主要製造商正在改造现有熔炉,并安装由再生能源运作的新型低碳熔炉,从而缩短大都会圈建设丛集的前置作业时间。 [1] 虽然新增产能缓解了供应紧张的局面,但预计到2026年,区域需求动能将使运转率维持在85%以上。
汽车轻量化复合复合材料集成
由于电池式电动车(BEV) 专案明显重视减重带来的每公斤续航里程优势,平台工程师正在用复合材料取代短切聚丙烯和长纤维热塑性塑料,用于结构支架、座椅框架和引擎室组件。一级供应商正在将复合材料钢板弹簧在保持疲劳寿命的同时,可减轻 30% 的非悬挂重量,从而推动玻璃纤维市场的需求成长。除了滑板式底盘外,高压电池机壳也越来越多地采用阻燃玻璃纤维/环氧树脂外层,而非结构发泡材,以提供隔热和电磁相容性。汽车采购团队也在评估混合层压结构,这种结构仅在应力集中区域使用碳纤维增强材料,并透过第二层玻璃纤维来抵消其高成本。这种材料组合增强了专为 A 级表面处理而设计的短切纤维、粗纱和多端粗纱的长期需求前景。
碳纤维的竞争给高端应用领域带来了压力。
中国、美国和中东的扩建计划预计将在2023年至2027年间使全球碳纤维名目产能翻倍。规模经济、聚丙烯腈前驱成本的不断降低以及自动化已使平均价格较2022年水准下降超过15%。随着成本曲线的下降,汽车和航太工程师正在重新评估特定结构部件的材料选择,这加剧了玻璃纤维市场的竞争压力。碳纤维和玻璃纤维交替使用的混纺织物,旨在平衡刚性和抗衝击性,进一步抑制了高性能材料市场对玻璃纤维的需求。玻璃纤维製造商正透过开发高模量S玻璃和耐腐蚀E-CR配方来应对,但这些改进只能缩小而非消除与碳纤维的价格差距。除非碳价格和回收补贴有利于玻璃纤维,否则在下一个产品週期中,高端应用市场份额可能会转向富含碳纤维的层压板。
细分市场分析
粗纱仍将是成长最快的产品形式,预计到2025年将占总需求的33.41%。其笔直的纤维结构为长度超过100公尺的涡轮机蒙皮提供了必要的单向强度,仅此一项应用就占全球粗纱货量的三分之一。受海外产能提升和汽车包覆成型复合复合材料(例如钢板弹簧、座椅靠背、电池框架)应用扩张的推动,粗纱所占的玻璃纤维市场规模预计将以每年4.39%的速度增长。诸如在线连续切割和先进的上浆配方等製程改进,能够改善润湿性并减少空隙率,从而提高拉挤成型和缠绕成型的生产效率。
製造商们也在测试在捲绕站应用虚拟感测器。数据传输到基于云端的品管模组可以减少废弃物并追踪碳足迹,凸显了数位化在玻璃纤维市场日益增长的重要性。毡材占据第二大市场份额,是喷涂船体和屋顶膜的首选材料,在这些应用中,贴合性比方向强度更为重要。纤维丝和纱线则服务于对直径公差要求严格、含胶量极低的细分市场,例如PCB层压板、过滤介质和5G雷达罩用织物。
本玻璃纤维报告按产品形态(粗纱、毡片、纤维束等)、纤维类型(E玻璃、S玻璃、E-CR玻璃等)、终端用户行业(建筑、汽车、风力发电、航太与国防、船舶、体育休閒及其他终端用户行业)和地区(亚太、北美、欧洲等)进行细分。市场预测以吨为单位。
区域分析
预计到2025年,亚太地区将占全球出货量的49.78%,并在2031年之前保持领先地位,年复合成长率达4.51%。各国产业政策正推动涡轮叶片、电动车零件和高铁零件的国内采购,有效保障了玻璃纤维市场的本土供应商。中国正在其风电场投资建造碳中和熔炉,这将减少隐含排放,并使出口产品转向低碳产品类型。
北美市场正在成长,抵消了因建筑节能标准提高和电动车平台推广而导致的石油天然气复合管道需求放缓的影响。太阳能和风能发电税收优惠政策的扩大正在加速涡轮机叶片的更换週期,这一趋势将使北美中部地区的粗纱纱厂受益。美国部分州强制使用再生材料的政策鼓励了玻璃废料的利用,从而支撑了废料市场并减少了对进口碱灰的依赖。欧洲的前景取决于北海和波罗的海离岸风力发电的扩张,但正在调查中的贸易保护措施可能会透过提高对亚洲产粗纱的关税来重组供应粗纱。玻璃纤维增强压力容器有望成为连接沿岸地区和欧洲的绿色氢能走廊的早期应用对象。拉丁美洲的基础规模较小,主要依赖巴西的风电场和墨西哥的汽车组装厂,这两家工厂在疫情后都在提高产量。儘管区域生产商可能面临原材料进口成本的挑战,但自由贸易协定和近岸外包计画正在吸引旨在缩短跨太平洋航运路线的投资。
其他福利:
- Excel格式的市场预测(ME)表
- 3个月的分析师支持
目录
第一章 引言
- 研究假设和市场定义
- 调查范围
第二章调查方法
第三章执行摘要
第四章 市场情势
- 市场概览
- 市场驱动因素
- 疫情后亚洲建筑业的蓬勃发展推动了对玻璃绒隔热材料的需求。
- 汽车轻量化趋势推动短切纤维复合材料在电动车平台中得到应用。
- 增加风力发电机叶片长度(超过120公尺)会增加粗纱消费量。
- 欧盟和北美强制性的建筑节能标准加快了建筑维修的进程。
- 考虑到耐化学性,氢气管道计划指定使用耐化学性优异的 E-CR 玻璃。
- 市场限制
- 碳纤维价格下跌缩小了与玻璃纤维的「价值差距」。
- 岩绒製造商瞄准暖通空调隔热材料市场的低密度细分市场(<100kg/m³)。
- 碱灰和能源价格上涨挤压了中国冶炼厂的利润空间
- 价值链分析
- 波特五力模型
- 供应商的议价能力
- 消费者议价能力
- 新进入者的威胁
- 替代品的威胁
- 竞争程度
第五章 市场规模与成长预测
- 按产品形式
- 粗纱
- 垫
- 斯特兰德
- 纱
- 玻璃绒
- 其他(磨碎纤维织物)
- 依纤维类型
- E玻璃
- S-玻璃
- E-CR玻璃
- C-玻璃
- 其他的
- 按最终用户行业划分
- 建筑/施工
- 车
- 风力发电
- 航太/国防
- 海洋
- 运动与休閒
- 其他终端用户产业(电子产品)
- 按地区
- 亚太地区
- 中国
- 印度
- 日本
- 韩国
- 印尼
- 越南
- 马来西亚
- 泰国
- 亚太其他地区
- 北美洲
- 美国
- 加拿大
- 墨西哥
- 欧洲
- 德国
- 法国
- 英国
- 义大利
- 西班牙
- 俄罗斯
- 土耳其
- 北欧国家
- 其他欧洲地区
- 南美洲
- 巴西
- 阿根廷
- 哥伦比亚
- 南美洲其他地区
- 中东和非洲
- 沙乌地阿拉伯
- 阿拉伯聯合大公国
- 卡达
- 埃及
- 南非
- 奈及利亚
- 其他中东和非洲地区
- 亚太地区
第六章 竞争情势
- 市场集中度
- 策略趋势
- 市占率(%)/排名分析
- 公司简介
- 3B-the fibreglass company
- AGY
- ASAHI FIBER GLASS Co., Ltd
- China Jushi Co., Ltd.
- Chongqing International Composite Materials Co., Ltd.
- Envalior
- Gurit Services AG
- Heraeus Holding
- Johns Manville
- Nippon Electric Glass Co., Ltd.
- PFG FIBER GLASS CORPORATION
- Praana Group
- Saint-Gobain
- Taishan Fiberglass Inc.(CTG)
- Taiwan Glass Ind. Corp.
第七章 市场机会与未来展望
The Glass Fiber Market was valued at 8.02 Million tons in 2025 and estimated to grow from 8.34 Million tons in 2026 to reach 10.17 Million tons by 2031, at a CAGR of 4.03% during the forecast period (2026-2031).
Demand resilience reflects the material's combination of tensile strength, corrosion resistance, and cost efficiency, characteristics that continue to displace metals and other legacy materials in infrastructure, mobility, and energy systems. Construction insulation orders recovered quickly after pandemic-related slowdowns, electric-vehicle (EV) programs accelerated composite uptake in automotive platforms, and wind-energy commitments triggered record blade production. These three demand pillars, together with product innovations such as low-carbon manufacturing lines and closed-loop recycling, are helping producers withstand raw-material cost inflation and trade uncertainties. Capacity rationalization and regional self-sufficiency programs are also reshaping competitive strategies as suppliers position themselves close to end-user growth hubs.
Global Glass Fiber Market Trends and Insights
Post-Pandemic Construction Acceleration Drives Glass Wool Demand
Asia-Pacific construction spending rebounded strongly in 2024 as governments advanced stimulus pipelines encompassing data-center campuses, semiconductor fabs, and mass-transit networks. These projects specify high-performance insulation to curb operational carbon, placing glass wool on tender lists ahead of lower-R-value substitutes within the glass fiber market. In India, green-building certification is embedded in municipal approval workflows, encouraging developers to select recyclable, flame-resistant insulation. Underground transit corridors highlight glass fiber reinforced polymer (GFRP) rebar because corrosion rates are lower than steel in water-logged environments. Major producers responded with brownfield furnace debottlenecking and new low-carbon melters powered by renewable electricity, actions that shorten lead times to metropolitan construction clusters[1]. Supply tightness has begun to ease as additional capacity ramps up, yet regional demand momentum suggests utilization will remain above 85% through 2026.
Automotive Lightweighting Accelerates Composite Integratio
Battery-electric vehicle programs reward every kilogram saved with measurable range extension, so platform engineers substitute chopped-strand polypropylene and long-fiber thermoplastics in structural brackets, seat frames, and under-hood components. Tier-1 suppliers have commercialized composite leaf springs that cut unsprung mass by 30% while retaining fatigue life, reinforcing demand trends in the glass fiber market. Beyond the skateboard chassis, high-voltage battery enclosures now specify flame-retardant glass fiber/epoxy skins over structural foams, combining thermal shielding with electromagnetic compatibility. Automotive procurement teams also evaluate hybrid lay-ups that place carbon reinforcement only in load-critical zones, offsetting the latter's higher cost with glass fiber in secondary layers. The resulting material mix strengthens long-term demand visibility for chopped strands, rovings, and multi-end rovings designed for class-A surface finishes.
Carbon-Fiber Price Competition Pressures Premium Applications
Expansion projects in China, the United States, and the Middle East are doubling global carbon-fiber nameplate capacity between 2023 and 2027. Economies of scale, lower-cost polyacrylonitrile precursors, and automation have already trimmed average prices by more than 15% compared with 2022 levels. As cost curves fall, automotive and aerospace engineers revisit material selection for selective structural parts, intensifying competitive pressures within the glass fiber market. Hybrid fabrics that alternate carbon and glass to balance stiffness and impact resistance further cannibalize glass volumes at the top of the performance pyramid. Glass fiber producers counteract by developing higher-modulus S-glass and corrosion-resistant E-CR formulations, though these upgrades narrow, rather than eliminate, the price gap to carbon. Unless carbon pricing or recycling credits favor glass, the premium application share may drift toward carbon-rich laminates over the next product cycle.
Other drivers and restraints analyzed in the detailed report include:
- Wind-Energy Expansion Drives Roving Consumption
- Building-Energy Codes Accelerate Insulation Retrofits
- Raw-Material Cost Inflation Pressures Manufacturing Margins
For complete list of drivers and restraints, kindly check the Table Of Contents.
Segment Analysis
Rovings anchored 33.41% of 2025 demand and remain the fastest-expanding product form. Their linear-strand architecture delivers the unidirectional strength essential for 100-meter-plus turbine skins, a use case that alone accounts for a third of global roving shipments. The glass fiber market size attributed to roving is forecast to grow 4.39% annually as offshore installations escalate and as automotive over-molded composites gain scale in leaf springs, seat backs, and battery frames. Process upgrades such as inline cake cutting and advanced sizing formulations improve wet-out and reduce void content, enabling higher throughput in pultrusion and filament winding.
Producers are also trialing virtual sensors on winder stations, transmitting data to cloud-based quality modules that cut waste and document carbon footprints-digital upgrades increasingly relevant across the glass fiber market. Mats occupy the second-largest slot, favored for spray-up boat hulls and roofing membranes where conformability outweighs directional strength. Strands and yarns cater to PCB laminates, filtration, and 5G radome fabrics, niches that demand tight diameter tolerance and minimal shot content.
The Glass Fiber Report is Segmented by Product Form (Roving, Mats, Strands, and More), Fiber Type (E-Glass, S-Glass, E-CR Glass, and More), End-User Industry (Building and Construction, Automotive, Wind Energy, Aerospace and Defense, Marine, Sports and Leisure, and Other End-User Industries), and Geography (Asia-Pacific, North America, Europe, and More). The Market Forecasts are Provided in Terms of Volume (Tons)
Geography Analysis
Asia-Pacific dominated with 49.78% of 2025 shipments and is projected to retain leadership through 2031 at a 4.51% CAGR. National industrial policies encourage domestic sourcing of turbine blades, EV parts, and high-speed rail components, effectively locking in local suppliers across the glass fiber market. China invests in carbon-neutral furnaces powered by captive wind farms, an initiative that lowers embedded emissions and qualifies exports for low-carbon product categories.
North America's market is growing wth building-energy codes and EV platform launches offsetting slower oil-and-gas composite pipe demand. Expanded solar and wind tax credits amplify the replacement cycle for turbine blades, a trend that benefits mid-continent roving plants. Recycled content mandates in select U.S. states encourage the use of cullet, supporting scrap markets and reducing dependence on imported soda ash. Europe's outlook hinges on offshore wind build-outs in the North Sea and Baltic, but trade defense measures under investigation may reshape supply chains should tariffs on Asian rovings intensify. Glass fiber reinforced pressure vessels could see early adoption in green-hydrogen corridors linking the Gulf to Europe. Latin America's modest baseline is anchored by Brazilian wind parks and Mexico's automotive assembly plants, both of which are ramping post-pandemic. Regional producers may struggle with feedstock import costs; nonetheless, free-trade agreements and nearshoring initiatives draw investment aimed at shortening trans-Pacific freight legs.
- 3B - the fibreglass company
- AGY
- ASAHI FIBER GLASS Co., Ltd
- China Jushi Co., Ltd.
- Chongqing International Composite Materials Co., Ltd.
- Envalior
- Gurit Services AG
- Heraeus Holding
- Johns Manville
- Nippon Electric Glass Co., Ltd.
- PFG FIBER GLASS CORPORATION
- Praana Group
- Saint-Gobain
- Taishan Fiberglass Inc.(CTG)
- Taiwan Glass Ind. Corp.
Additional Benefits:
- The market estimate (ME) sheet in Excel format
- 3 months of analyst support
TABLE OF CONTENTS
1 Introduction
- 1.1 Study Assumptions and Market Definition
- 1.2 Scope of the Study
2 Research Methodology
3 Executive Summary
4 Market Landscape
- 4.1 Market Overview
- 4.2 Market Drivers
- 4.2.1 Post-Pandemic Construction Boom in Asia Drives Demand for Glass Wool Insulation
- 4.2.2 Vehicle-Light-Weighting Pushes Chopped-Strand Composites into EV Platforms
- 4.2.3 Wind-Turbine Blade Length Growth (more than 120 M) Increases Roving Consumption
- 4.2.4 Mandatory Building-Energy Codes in EU and NA Accelerate Retrofit Insulation
- 4.2.5 Hydrogen-Pipe Projects Specify E-CR Glass for Chemical Resistance
- 4.3 Market Restraints
- 4.3.1 Carbon-Fiber Price Erosion Squeezes Glass-Fiber's "Value Gap"
- 4.3.2 Rock-Wool Makers Target less than 100 Kg/M3 Density Niche in HVAC Insulation
- 4.3.3 Rising Soda-Ash and Energy Prices Hurt Margin in China Smelters
- 4.4 Value Chain Analysis
- 4.5 Porter's Five Forces
- 4.5.1 Bargaining Power of Suppliers
- 4.5.2 Bargaining Power of Consumers
- 4.5.3 Threat of New Entrants
- 4.5.4 Threat of Substitute Products
- 4.5.5 Degree of Competition
5 Market Size and Growth Forecasts (Volume)
- 5.1 By Product Form
- 5.1.1 Roving
- 5.1.2 Mats
- 5.1.3 Strands
- 5.1.4 Yarn
- 5.1.5 Glass Wool
- 5.1.6 Others (Milled Fiber and Fabrics)
- 5.2 By Fiber Type
- 5.2.1 E-Glass
- 5.2.2 S-Glass
- 5.2.3 E-CR Glass
- 5.2.4 C-Glass
- 5.2.5 Others
- 5.3 By End-user Industry
- 5.3.1 Building and Construction
- 5.3.2 Automotive
- 5.3.3 Wind Energy
- 5.3.4 Aerospace and Defense
- 5.3.5 Marine
- 5.3.6 Sports and Leisure
- 5.3.7 Other End-user Industries (Electronics)
- 5.4 By Geography
- 5.4.1 Asia-Pacific
- 5.4.1.1 China
- 5.4.1.2 India
- 5.4.1.3 Japan
- 5.4.1.4 South Korea
- 5.4.1.5 Indonesia
- 5.4.1.6 Vietnam
- 5.4.1.7 Malaysia
- 5.4.1.8 Thailand
- 5.4.1.9 Rest of Asia-Pacific
- 5.4.2 North America
- 5.4.2.1 United States
- 5.4.2.2 Canada
- 5.4.2.3 Mexico
- 5.4.3 Europe
- 5.4.3.1 Germany
- 5.4.3.2 France
- 5.4.3.3 United Kingdom
- 5.4.3.4 Italy
- 5.4.3.5 Spain
- 5.4.3.6 Russia
- 5.4.3.7 Turkey
- 5.4.3.8 Nordics
- 5.4.3.9 Rest of Europe
- 5.4.4 South America
- 5.4.4.1 Brazil
- 5.4.4.2 Argentina
- 5.4.4.3 Colombia
- 5.4.4.4 Rest of South America
- 5.4.5 Middle-East and Africa
- 5.4.5.1 Saudi Arabia
- 5.4.5.2 United Arab Emirates
- 5.4.5.3 Qatar
- 5.4.5.4 Egypt
- 5.4.5.5 South Africa
- 5.4.5.6 Nigeria
- 5.4.5.7 Rest of Middle-East and Africa
- 5.4.1 Asia-Pacific
6 Competitive Landscape
- 6.1 Market Concentration
- 6.2 Strategic Moves
- 6.3 Market Share (%)/Ranking Analysis
- 6.4 Company Profiles (includes Global level Overview, Market level overview, Core Segments, Financials as available, Strategic Information, Market Rank/Share for key companies, Products and Services, and Recent Developments)
- 6.4.1 3B - the fibreglass company
- 6.4.2 AGY
- 6.4.3 ASAHI FIBER GLASS Co., Ltd
- 6.4.4 China Jushi Co., Ltd.
- 6.4.5 Chongqing International Composite Materials Co., Ltd.
- 6.4.6 Envalior
- 6.4.7 Gurit Services AG
- 6.4.8 Heraeus Holding
- 6.4.9 Johns Manville
- 6.4.10 Nippon Electric Glass Co., Ltd.
- 6.4.11 PFG FIBER GLASS CORPORATION
- 6.4.12 Praana Group
- 6.4.13 Saint-Gobain
- 6.4.14 Taishan Fiberglass Inc.(CTG)
- 6.4.15 Taiwan Glass Ind. Corp.
7 Market Opportunities and Future Outlook
- 7.1 White-space and Unmet-need Assessment
 玻璃纤维照明灯桿市场规模、份额和成长分析(按安装方式、灯桿类型、光纤方向、应用和地区划分)—产业预测(2026-2033 年)
 玻璃钢管市场规模、份额及成长分析(按纤维类型、产品类型、应用和地区划分)-产业预测(2026-2033 年)
 低介电常数玻璃纤维:全球市场份额和排名、总收入和需求预测(2025-2031年)E-玻璃纤维纱线和粗纱:2025-2031年全球市场份额和排名、总收入和需求预测
 玻璃钢管道市场机会、成长驱动因素、产业趋势分析及预测(2025-2034年)全球玻璃纤维增强环氧树脂管材市场-市场份额及排名、总收入、需求预测(2025-2031年)
 玻璃纤维增强塑胶(FRP)管道市场:按应用、产品类型、终端用户行业、压力等级和直径范围划分 - 全球预测(2025-2032年)玻璃纤维市场按产业、应用、产品形式、纤维类型和製造方法划分-2025-2032年全球预测玻璃纤维布市场按产品、纤维类型、最终用户和分销管道划分-2025-2032年全球预测
 玻璃纤维纱市场-全球产业规模、份额、趋势、机会和预测,按类型、按纱线类型、按应用、按最终用户产业、按地区和竞争情况细分,2020-2030 年