


 |
市场调查报告书
商品编码
1907319
锂:市场占有率分析、产业趋势和统计数据、成长预测(2026-2031)Lithium - Market Share Analysis, Industry Trends & Statistics, Growth Forecasts (2026 - 2031) |
||||||
※ 本网页内容可能与最新版本有所差异。详细情况请与我们联繫。
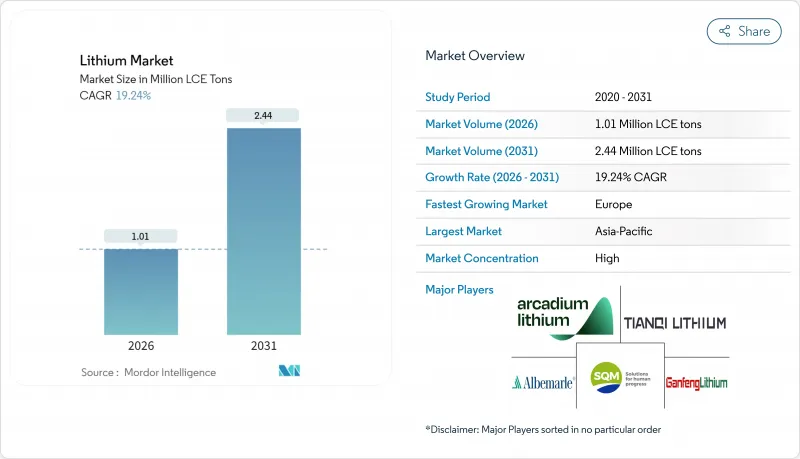
预计到 2026 年,锂市场规模将达到 101 万吨 LCE,高于 2025 年的 85 万吨 LCE。
预计到 2031 年,全球煤炭消费量将达到 244 万吨,2026 年至 2031 年的复合年增长率为 19.24%。
电池需求占据新增供应的大部分,电动车销售的强制规定和大规模储能部署明确了长期需求前景。随着高镍正极材料成为高阶电动车的主流化学体系,氢氧化锂的消费成长速度超过了碳酸锂。新的直接锂提取(DLE)计划正在缩短计划前置作业时间并减少用水量,使矿业公司能够更快地应对需求激增。区域生产和消费缺口依然存在,中国在加工方面占据主导地位,但蕴藏量有限,而欧洲正在加快下游投资以避免未来的供应衝击。一级生产商和科技公司之间日益加剧的整合加剧了竞争压力,并推动了大规模的资本支出计画。
全球锂市场趋势及展望
电动车渗透率目标和电池成本并行化
电池组价格持续下降,目标是每千瓦时100美元,这将缩小电动车和内燃机汽车之间的价格差距,即使在补贴减少后,电动车的普及速度也将加快。特斯拉每年从Liontown Resources采购15万吨锂辉石矿石,显示汽车製造商正在为未来数年储备上游原料。 Stellantis已与Vulcan Energy签署了一份为期五年的供应协议,采购高达9.9万吨氢氧化锂,为欧洲在2035年逐步淘汰内燃机汽车做好准备。高镍正极材料(例如NMC811)需要氢氧化物而非碳酸盐,这将进一步加速化合物的转化。中国新能源汽车渗透率将在2024年达到35%,显示政策和成本的趋同正在创造永续的需求週期。类似的势头也在美国形成,联邦政府的零排放目标与各州的法规一致,推动了锂市场的需求。
美国、欧盟和中国强制要求建造电网级储能设施(4小时或以上)。
具有法律约束力的储能要求将确保汽车产业以外的锂需求达到最低水准。美国《通膨控制法案》为独立储能计画提供30%的投资税额扣抵。加州要求到2026年新增11.5吉瓦的储能容量。中国的「十四五」规划设定了2025年实现30吉瓦储能的目标,并要求各省风能和太阳能发电工程的储能比例达到10%至20%。欧洲电网营运商估计,到2030年,需要200吉瓦的储能容量来平衡可再生能源。锂离子电池技术正逐渐成为主流,因为它符合四小时的续航标准,并且拥有最低的生命週期成本。这些强制性要求降低了氢氧化锂和碳酸锂生产商的收入波动,并为锂市场的长期价格预测奠定了基础。
中国二线加工商短期内供应过剩
中国锂加工企业计画在2024年将其碳酸锂产能扩大至每年120万吨,远超过国内每年80万吨的需求。由于长期合约有限,这些企业被迫将过剩产品倾销至现货市场,导致电池级碳酸锂价格跌至每吨9,000-12,000美元,年减65%。价格波动抑制了其他领域的投资,并给高成本的生产者带来了压力。不断上涨的环保法规合规成本和高能耗製程成本预计将逐步淘汰效率低下的企业。随着产业整合的持续进行,锂市场的定价权预计将趋于稳定。
细分市场分析
由于高高成本的碳酸盐转化,特斯拉在其4680电池中也全部使用氢氧化锂。氢氧化锂的高价(1000-2000美元/吨)反映了其供应紧张和加工过程的复杂性。欧洲的回收法规倾向于采用能够在多个生命週期内保持纯度的氢氧化锂生产方法,这进一步推动了市场需求。氯化锂和其他化合物服务于空气处理、製药和特殊化学品等细分市场,其市场成长持续但相对缓慢。
对氢氧化锂日益增长的需求正对以碳酸盐锂为核心的供应链构成挑战。澳洲和美国的计划计划在现场提炼氢氧化锂,以降低物流成本。在中国,加工厂正投资进行製程最佳化,以提高锂辉石製氢氧化锂的产率。成功的直接锂醚(DLE)试点计画提供了高纯度的原料解决方案,从而扩大了适用于氢氧化锂生产的来源基础。随着汽车製造商转向高镍含量的锂合金,合约订单量也倾向于氢氧化锂,加速了锂市场内部化合物的迁移。
本锂市场报告按化学化合物(碳酸盐、氯化物等)、应用领域(电池、润滑油和润滑脂、空气处理、製药等)、终端用户行业(工业、家用电子电器、储能、医疗、汽车等)以及地区(亚太地区、北美、欧洲、南美、中东和非洲)进行细分。市场预测以吨为单位。
区域分析
到2025年,亚太地区将占全球锂市场61.65%的份额。这主要得益于中国精炼了全球约70%的锂供应,但区域政策制定者正密切关注市场集中度风险。日本和韩国是先进电池製造领域的主导,需要高纯度氢氧化锂来製造富镍正极材料。印度的乘用车电气化计划和生产连结奖励计画(PLI)正在吸引电池製造商,从而推动锂需求的成长。澳洲虽然在硬岩矿石生产方面保持领先地位,但不得不出口大部分精矿进行加工,未能充分利用其增值潜力。区域进口商正在与南美盐湖计划和北美氢氧化锂工厂洽谈新的合作关係,以减少对中国冶炼厂的依赖。
欧洲将迎来最快成长,到2031年复合年增长率将达到25.33%。欧洲电池联盟的目标是年产能达到550吉瓦时,《关键原料法》要求采购来源多元化。德国将凭藉其汽车产业丛集支撑需求,而北欧国家将利用可再生能源并推动高能量炼油。法国、义大利和西班牙将吸引超级工厂投资,进而振兴当地的化学中间体产业。战略储备和回收义务将为本地加工的锂创造稳定的需求,使当地价格高于全球平均水平。
北美正利用《通膨控制法案》的激励措施,大力发展国内生产。美国正在扩大位于萨克帕斯和北卡罗来纳州的采矿和精炼产能;加拿大正根据其关键矿产战略推进电池级计划;墨西哥则受益于《美国墨加协定》(USMCA)下的优惠贸易。南美洲正从出口国向部分消费国转型,阿根廷和智利正在探索建造正极材料和电池工厂。巴西正在探索下游产业,以获得更大价值。中东和非洲仍处于发展初期,但随着波湾合作理事会(GCC)成员国和南非公共产业可再生能源和网格储存的扩张,它们的重要性可能日益凸显。
其他福利:
- Excel格式的市场预测(ME)表
- 3个月的分析师支持
目录
第一章 引言
- 研究假设和市场定义
- 调查范围
第二章调查方法
第三章执行摘要
第四章 市场情势
- 市场概览
- 市场驱动因素
- 电动车渗透率目标和电池成本并行化
- 美国、欧盟和中国强制要求建造电网级储能设施(4小时或以上)。
- 签订承购协议以确保供应并获得原始设备製造商 (OEM) 的支持
- 直接锂萃取(DLE)技术的兴起及成功的初步试验
- 《通膨控制法》下的下游税额扣抵
- 市场限制
- 中国二级加工商短週期产品供应过剩
- 由于利率急剧上升,储能係统采购意外放缓。
- 钠离子电池的商业化才刚开始。
- 价值链分析
- 波特五力模型
- 供应商的议价能力
- 买方的议价能力
- 新进入者的威胁
- 替代品的威胁
- 竞争程度
- 定价分析
- 技术概述
第五章 市场规模与成长预测
- 化合物
- 碳酸盐
- 氯化物
- 氢氧化物
- 其他的
- 透过使用
- 电池
- 润滑剂和润滑脂
- 空气处理
- 製药
- 玻璃和陶瓷(包括玻璃料)
- 聚合物
- 其他用途
- 按最终用户行业划分
- 产业
- 家用电子电器
- 储能
- 医疗保健
- 车
- 其他终端用户产业
- 按地区
- 生产和蕴藏量分析
- 澳洲
- 智利
- 中国
- 阿根廷
- 辛巴威
- 美国
- 其他地区
- 消费分析
- 亚太地区
- 中国
- 日本
- 印度
- 韩国
- 澳洲和纽西兰
- 亚太其他地区
- 北美洲
- 美国
- 加拿大
- 墨西哥
- 欧洲
- 德国
- 英国
- 法国
- 义大利
- 北欧国家
- 其他欧洲地区
- 南美洲
- 巴西
- 阿根廷
- 南美洲其他地区
- 中东和非洲
- 沙乌地阿拉伯
- 南非
- 其他中东和非洲地区
- 亚太地区
- 生产和蕴藏量分析
第六章 竞争情势
- 市场集中度
- 策略趋势
- 市占率(%)/排名分析
- 公司简介
- Albemarle Corporation
- Arcadium Lithium(Rio Tinto)
- Avalon Advanced Materials Inc.
- Ganfeng Lithium Group Co., Ltd.
- Lithium Americas Corp.
- Lithium Australia
- Mineral Resources
- Morella Corporation Limited
- Pilbara Minerals
- Sichuan Yahua Industrial Group Co. Ltd
- SQM
- Tianqi Lithium Corporation Limited
第七章 市场机会与未来展望
Lithium market size in 2026 is estimated at 1.01 Million LCE tons, growing from 2025 value of 0.85 Million LCE tons with 2031 projections showing 2.44 Million LCE tons, growing at 19.24% CAGR over 2026-2031.
Battery demand accounts for most incremental volumes, with policies that mandate electric-vehicle sales and grid-scale storage creating long-term visibility on offtake. Hydroxide consumption is expanding faster than carbonate as high-nickel cathodes become the preferred chemistry for premium electric cars. New direct-lithium-extraction (DLE) projects shorten project lead times and lowering water use, helping miners respond more quickly to demand spikes. Regional production-consumption gaps persist: China dominates processing yet owns limited reserves, while Europe accelerates downstream investments to avoid future supply shocks. Consolidation among tier-1 producers and technology companies intensifies competitive pressure and supports larger capital-spending plans.
Global Lithium Market Trends and Insights
EV Penetration Targets and Battery-Cost Parity
Battery packs moving toward USD 100/kWh enable price parity between electric and combustion vehicles, accelerating adoption even when subsidies fade. Tesla's 150,000 DMT annual spodumene offtake from Liontown Resources demonstrates how automakers now secure upstream inputs years in advance. Stellantis signed a five-year agreement for up to 99,000 MT of lithium hydroxide from Vulcan Energy to prepare for the 2035 European engine phase-out. Higher-nickel cathodes such as NMC 811 demand hydroxide rather than carbonate, reinforcing the compound shift. China's new-energy-vehicle penetration reached 35% in 2024, indicating that policy and cost convergence create self-sustaining demand cycles. Similar momentum is building in the United States as federal zero-emission targets align with state mandates, in the lithium market
Grid-Scale Storage Mandates (>=4 h) in US, EU and China
Legally binding storage requirements guarantee a minimum level of lithium demand outside the vehicle cycle. The U.S. Inflation Reduction Act offers a 30% investment tax credit for standalone storage, while California must add 11.5 GW by 2026. China's 14th Five-Year Plan sets a 30 GW storage target by 2025, and provinces enforce 10-20% storage ratios on wind and solar projects. Europe's transmission operators estimate 200 GW of storage will be needed by 2030 to balance renewables. Lithium-ion technology dominates because it meets the four-hour duration standard at the lowest life-cycle cost. These mandates reduce revenue volatility for hydroxide and carbonate producers and anchor long-run pricing expectations across the lithium market.
Short-Cycle Oversupply from Tier-2 Chinese Converters
Chinese converters expanded lithium carbonate capacity to 1.2 million tpy in 2024, overshooting domestic demand of 800,000 tpy. With limited long-term contracts, these firms dump excess product on spot markets, pushing battery-grade carbonate to USD 9,000-12,000/t, 65% lower than a year earlier. Price volatility deters investment elsewhere and squeezes producers with higher cost bases. Environmental compliance costs and energy-intensive processes are rising, which will gradually remove the least efficient operators. Once consolidation progresses, pricing power is expected to stabilise across the lithium market.
Other drivers and restraints analyzed in the detailed report include:
- OEM-Backed Off-take Agreements Securing Supply
- Rise of Direct-Lithium-Extraction (DLE) Pilot Successes
- Slower-than-Expected ESS Procurement due to Interest-Rate Spikes
For complete list of drivers and restraints, kindly check the Table Of Contents.
Segment Analysis
Lithium hydroxide posted a 23.02% CAGR outlook through 2031 because high-nickel cathodes need higher reactivity, while lithium carbonate maintained 64.78% market share in 2025 through well-established industrial routes. Battery manufacturers now specify hydroxide directly to avoid costly carbonate conversion, and Tesla employs only hydroxide in its 4680 cells. The hydroxide premium of USD 1,000-2,000/t reflects tighter supply and higher processing complexity. Recycling mandates in Europe favour hydroxide pathways because they preserve purity across multiple life cycles, further lifting demand. Lithium chloride and other compounds serve niche air-treatment, pharmaceutical and specialty-chemical markets with steady but comparatively slow expansion.
Growing hydroxide demand challenges supply chains optimised for carbonate. Projects in Australia and the United States plan hydroxide refining adjacent to mines to cut logistics costs. In China, converters invest in debottlenecking to raise hydroxide yield from spodumene. Successful DLE pilots broaden the resource base suitable for hydroxide production by delivering high-purity feed solutions. As more automakers shift to high-nickel chemistries, contract volumes favour hydroxide, sharpening the compound transition inside the lithium market.
The Lithium Market Report is Segmented by Compound (Carbonate, Chloride, and More), Application (Battery, Lubricants and Grease, Air Treatment, Pharmaceuticals, and More), End-User Industry (Industrial, Consumer Electronics, Energy Storage, Medical, Automotive, and More), and Geography (Asia-Pacific, North America, Europe, South America, and Middle East and Africa). The Market Forecasts are Provided in Terms of Volume (Tons).
Geography Analysis
Asia-Pacific retained 61.65% of the Lithium market size in 2025 because China refines about 70% of global supply, yet regional policymakers watch concentration risk closely. Japan and South Korea lead advanced battery manufacturing, demanding high-purity hydroxide for nickel-rich cathodes. India's passenger-vehicle electrification program and PLI incentives attract cell makers, creating incremental lithium pull. Australia dominates hard-rock production but must ship most concentrate for processing, leaving value-addition opportunities underexploited. Regional importers negotiate new partnerships with South American brine projects and North American hydroxide plants to reduce reliance on Chinese converters.
Europe expands fastest, recording a 25.33% CAGR to 2031. The European Battery Alliance targets 550 GWh annual capacity, and the Critical Raw Materials Act mandates diversified sourcing. Germany anchors demand through automotive clusters, while Nordic nations deploy renewable power to host energy-intensive refining. France, Italy and Spain attract gigafactory investment, stimulating local chemical intermediates. Strategic stockpiling and recycling quotas create captive demand for regionally processed lithium, supporting local prices above global averages.
North America leverages Inflation Reduction Act incentives that value domestic content. The United States adds extraction at Thacker Pass and refinery capacity in North Carolina, Canada promotes battery-grade projects under its Critical Minerals Strategy, and Mexico benefits from the United States-Mexico-Canada Agreement (USMCA) preferential trade. South America evolves from exporter to part-time consumer as Argentina and Chile explore cathode and cell plants. Brazil studies downstream options to capture greater value. The Middle East and Africa remain nascent but could gain prominence as renewables and grid storage scale across Gulf Cooperation Council states and South African utilities.
- Albemarle Corporation
- Arcadium Lithium (Rio Tinto)
- Avalon Advanced Materials Inc.
- Ganfeng Lithium Group Co., Ltd.
- Lithium Americas Corp.
- Lithium Australia
- Mineral Resources
- Morella Corporation Limited
- Pilbara Minerals
- Sichuan Yahua Industrial Group Co. Ltd
- SQM
- Tianqi Lithium Corporation Limited
Additional Benefits:
- The market estimate (ME) sheet in Excel format
- 3 months of analyst support
TABLE OF CONTENTS
1 Introduction
- 1.1 Study Assumptions and Market Definition
- 1.2 Scope of the Study
2 Research Methodology
3 Executive Summary
4 Market Landscape
- 4.1 Market Overview
- 4.2 Market Drivers
- 4.2.1 EV Penetration Targets and Battery-cost Parity
- 4.2.2 Grid-scale Storage Mandates (>=4 h) in U.S., EU and China
- 4.2.3 OEM-backed Off-take Agreements Securing Supply
- 4.2.4 Rise of Direct-lithium-extraction (DLE) Pilot Successes
- 4.2.5 Inflation-Reduction-Act Downstream Tax Credits
- 4.3 Market Restraints
- 4.3.1 Short-cycle Oversupply from Tier-2 Chinese Converters
- 4.3.2 Slower-than-expected ESS Procurement due to Interest-rate Spikes
- 4.3.3 Nascent Sodium-ion Battery Commercialization
- 4.4 Value Chain Analysis
- 4.5 Porter's Five Forces
- 4.5.1 Bargaining Power of Suppliers
- 4.5.2 Bargaining Power of Buyers
- 4.5.3 Threat of New Entrants
- 4.5.4 Threat of Substitutes
- 4.5.5 Degree of Competition
- 4.6 Pricing Analysis
- 4.7 Technology Snapshot
5 Market Size and Growth Forecasts (Volume)
- 5.1 By Compound
- 5.1.1 Carbonate
- 5.1.2 Chloride
- 5.1.3 Hydroxide
- 5.1.4 Others
- 5.2 By Application
- 5.2.1 Battery
- 5.2.2 Lubricants and Grease
- 5.2.3 Air Treatment
- 5.2.4 Pharmaceuticals
- 5.2.5 Glass and Ceramics (Including Frits)
- 5.2.6 Polymer
- 5.2.7 Other Applications
- 5.3 By End-user Industry
- 5.3.1 Industrial
- 5.3.2 Consumer Electronics
- 5.3.3 Energy Storage
- 5.3.4 Medical
- 5.3.5 Automotive
- 5.3.6 Other End-user Industries
- 5.4 By Geography
- 5.4.1 Production and Reserve Analysis
- 5.4.1.1 Australia
- 5.4.1.2 Chile
- 5.4.1.3 China
- 5.4.1.4 Argentina
- 5.4.1.5 Zimbabwe
- 5.4.1.6 United States
- 5.4.1.7 Other Regions
- 5.4.2 Consumption Analysis
- 5.4.2.1 Asia-Pacific
- 5.4.2.1.1 China
- 5.4.2.1.2 Japan
- 5.4.2.1.3 India
- 5.4.2.1.4 South Korea
- 5.4.2.1.5 Australia and New Zealand
- 5.4.2.1.6 Rest of Asia-Pacific
- 5.4.2.2 North America
- 5.4.2.2.1 United States
- 5.4.2.2.2 Canada
- 5.4.2.2.3 Mexico
- 5.4.2.3 Europe
- 5.4.2.3.1 Germany
- 5.4.2.3.2 United Kingdom
- 5.4.2.3.3 France
- 5.4.2.3.4 Italy
- 5.4.2.3.5 Nordic Countries
- 5.4.2.3.6 Rest of Europe
- 5.4.2.4 South America
- 5.4.2.4.1 Brazil
- 5.4.2.4.2 Argentina
- 5.4.2.4.3 Rest of South America
- 5.4.2.5 Middle East and Africa
- 5.4.2.5.1 Saudi Arabia
- 5.4.2.5.2 South Africa
- 5.4.2.5.3 Rest of Middle East and Africa
- 5.4.2.1 Asia-Pacific
- 5.4.1 Production and Reserve Analysis
6 Competitive Landscape
- 6.1 Market Concentration
- 6.2 Strategic Moves
- 6.3 Market Share (%)**/Ranking Analysis
- 6.4 Company Profiles (includes Global level Overview, Market level overview, Core Segments, Financials as available, Strategic Information, Market Rank/Share, Products and Services, Recent Developments)
- 6.4.1 Albemarle Corporation
- 6.4.2 Arcadium Lithium (Rio Tinto)
- 6.4.3 Avalon Advanced Materials Inc.
- 6.4.4 Ganfeng Lithium Group Co., Ltd.
- 6.4.5 Lithium Americas Corp.
- 6.4.6 Lithium Australia
- 6.4.7 Mineral Resources
- 6.4.8 Morella Corporation Limited
- 6.4.9 Pilbara Minerals
- 6.4.10 Sichuan Yahua Industrial Group Co. Ltd
- 6.4.11 SQM
- 6.4.12 Tianqi Lithium Corporation Limited
7 Market Opportunities and Future Outlook
- 7.1 White-space and Unmet-need Assessment
 2026-2034年全球锂市场规模、份额、趋势和成长分析报告氯化锂市场规模、份额、成长及全球产业分析:按类型、应用和地区划分,并预测至2026-2034年
 2026年全球锂市场报告全球直接锂萃取 (DLE) 市场 (2026-2036)锂离子电池电解液(LiFSI)市场规模、占有率、成长及全球产业分析:依类型、应用和地区划分的洞察与预测(2026–2034)2026年全球锂电池电气设备市场报告
 锂市场-全球产业规模、份额、趋势、机会、预测:按产品、应用、地区和竞争对手划分,2021-2031年
 三萜皂素提取服务市场:按提取方法、类型、原料和应用划分-2026-2032年全球预测锂萃取和精炼市场(按精炼产品、萃取方法、製程技术、纯度等级和最终用途产业划分)-全球预测,2026-2032年
 氯化锂市场规模、份额及成长分析(按类型、应用、终端用户产业及地区划分)-2026-2033年产业预测