


 |
市场调查报告书
商品编码
1910454
工业润滑油:市场占有率分析、产业趋势与统计、成长预测(2026-2031)Industrial Lubricants - Market Share Analysis, Industry Trends & Statistics, Growth Forecasts (2026 - 2031) |
||||||
※ 本网页内容可能与最新版本有所差异。详细情况请与我们联繫。
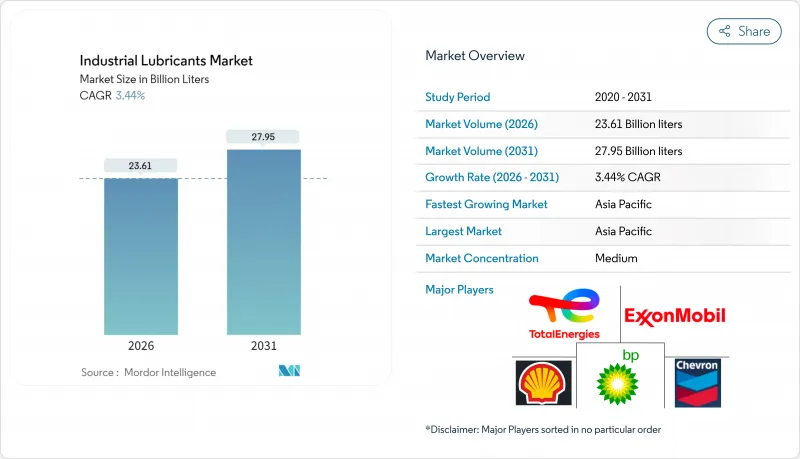
预计工业润滑油市场将从 2025 年的 228.2 亿公升成长到 2026 年的 236.1 亿公升,到 2031 年将达到 279.5 亿公升,2026 年至 2031 年的复合年增长率为 3.44%。
这种稳定成长的趋势标誌着润滑油产业正从大众市场商品转向客製化润滑油,以最大限度地提高产能运转率和能源效率。风力发电机机装机量的快速增长以及向工业4.0的升级,使得润滑油的性能要求超越了传统规范,从而推动了对合成和生物基化学品的需求。亚太地区目前消费量,这主要得益于大规模的製造业投资以及炼油和石化一体化联合企业占据了高价值的润滑油利润。为了因应日益严格的环境法规和预测性维护的普及,全球製造商也主导研发不含PFAS的添加剂和状态监测润滑油。
全球工业润滑油市场趋势及展望
风力发电机机齿轮箱润滑油需求激增
全球风力发电的扩张推动了对专用齿轮箱油的需求,而标准润滑油无法满足这项需求。预计到2023年12月,中国风电装置容量将达到440吉瓦,许多风机故障都是因为润滑不足造成的。添加了增强型抗磨剂和防腐蚀抑制剂的合成油可将换油週期从六个月延长至三年,从而降低离岸风电场的维护成本。优异的水分离性能对于偏远地区的风扇至关重要,可最大限度地减少直升机维护的需求。开发人员越来越多地指定使用ISO VG 320-460 PAO混合油,这种混合油能够在较大的温度波动范围内保持黏度,即使在强风等恶劣条件下也能保护兆瓦级齿轮箱。一台15兆瓦的离岸风力发电机每次换油週期可能消耗超过800公升润滑油,因此,随着机组功率的增大,工业润滑油市场的需求预计将直接成长。
工业自动化和工业4.0中润滑剂用量增加
智慧工厂配备了在高温高速下运作的精密机械,因此需要黏度公差严格且感测器干扰最小的润滑油。自动化润滑系统是基于即时分析控制润滑油的计量,在提高运转率的同时,可降低30-40%的润滑油消费量。添加剂的溶解度和金属离子含量受到严格控制,即使在磁性塞和红外线碎屑监测装置的作用下,也能保持摩擦学稳定性。人工智慧平台现在可以读取振动和温度数据,动态调整配方建议。这迫使供应商开发模组化、可现场客製化的添加剂组合,加速工业润滑油市场向高端合成和混合产品的长期结构转变。
加强对废油和溢油的监管
欧盟和美国多个州的 PFAS 逐步淘汰强制令迫使配方商重新设计传统产品。替代化学品的认证会延长产品上市时间并增加研发预算。在使用者层面,回收系统必须记录从生产到处置的可追溯性,这会增加处置成本和储存设施的资本支出。洩漏预防指令要求使用双层壁储槽和即时洩漏警报系统,这会增加小规模工厂的基础设施成本。虽然这些障碍限制了短期需求,但也为符合规范且利润丰厚的工业润滑油组合药物创造了新的市场机会。
细分市场分析
预计到2025年,机油将占总销售额的23.29%,用于保护重工业应用中的关键发电机和固定式压缩机。这一份额反映了根深蒂固的维护习惯,即传统引擎倾向于使用单一黏度等级的SAE 40和15W-40多级黏度等级的润滑油。然而,随着原始设备製造商(OEM)转向换油週期更长的燃气引擎,对发动机油的需求趋于平稳。同时,受机器人、射出成型机和风力发电机变桨系统的扩张推动,液压油和变速箱油预计将以3.92%的复合年增长率成长。金属加工液将受益于亚太地区工具机的投资,而离子液体切削液将比矿物油基准产品提供更长的刀具寿命。
采用二硫化钼和石墨配製的合成润滑脂在承受200°C高温窑炉出口的极压轴承领域市占率不断扩大,而加工油的需求则与中国、印度和美国石化厂产能提升的直接相关。新兴的电机冷却油则体现了不断变化的机械结构如何持续重塑工业润滑油市场。
工业润滑油市场报告按产品类型(引擎油、液压油和变速箱油、金属加工液等)、终端用户产业(发电、重型机械、食品饮料加工、冶金和金属加工、化学和製程工业、其他产业)以及地区(亚太地区、北美地区等)进行细分。市场预测以公升为单位。
区域分析
预计到2025年,亚太地区将占全球润滑油市场份额的46.88%,并在2031年之前以3.61%的复合年增长率成长。在中国,炼油商正日益整合化学品以提高润滑油利润率。印度正吸引大量外资,路博润公司投资2亿美元在奥兰加巴德新建工厂,该工厂是印度第二大润滑油工厂。东南亚国家欢迎工厂搬迁和可再生能源计划,从而推动了对油压油和齿轮油的需求。由于日本和韩国拥有精密製造业,且节能目标严格,两国对合成油的采用率高于平均值。
北美和欧洲正着力研发不含全氟烷基和多氟烷基物质(PFAS)的配方,并提高碳效率。美国正在利用页岩油衍生原料,而电动车的兴起将逐步降低对传统机油的需求。欧洲在主导,推动了配方的快速转变。加拿大的油砂开采将继续推动对高温润滑油的需求,而墨西哥的汽车产业投资也将增加当地的需求。
中东和非洲地区依赖油气开采计划来保障基础油供应,并正向化工领域多元化发展。 Richful Farabi在沙乌地阿拉伯新建的添加剂工厂预计将缩短区域调配商的供应链。南非的深层采矿和尼日利亚的炼油升级正在创造利基市场机会。南美洲受益于巴西石化产业瓶颈的消除和智利铜矿的扩张,实现了强劲的局部成长,这将巩固其作为工业润滑油市场供应商规模虽小但重要的出口管道的地位。
其他福利:
- Excel格式的市场预测(ME)表
- 分析师支持(3个月)
目录
第一章 引言
- 研究假设和市场定义
- 调查范围
第二章调查方法
第三章执行摘要
第四章 市场情势
- 市场概览
- 市场驱动因素
- 风力发电机机齿轮箱润滑油需求激增
- 润滑剂在工业自动化和工业4.0的应用
- 向长效合成油和半合成油过渡
- 扩大矿业及施工机械设备规模
- 碳定价对超低摩擦生物润滑剂的需求驱动效应
- 市场限制
- 加强对废油和洩漏的监管
- 原油衍生基础油的价格波动
- 干式驱动马达降低了对油的需求
- 价值链分析
- 波特五力模型
- 供应商的议价能力
- 买方的议价能力
- 新进入者的威胁
- 替代品的威胁
- 竞争程度
第五章 市场规模与成长预测
- 依产品类型
- 机油
- 液压油和变速箱油
- 金属加工油
- 通用工业油
- 齿轮油
- 润滑脂
- 加工油
- 其他的
- 按最终用户行业划分
- 发电
- 重型机械
- 食品/饮料加工
- 冶金与金属加工
- 化学和加工工业
- 其他行业(纸浆和造纸、航运等)
- 按地区
- 亚太地区
- 中国
- 印度
- 日本
- 韩国
- 印尼
- 泰国
- 越南
- 马来西亚
- 亚太其他地区
- 北美洲
- 美国
- 加拿大
- 墨西哥
- 欧洲
- 德国
- 英国
- 法国
- 义大利
- 西班牙
- 俄罗斯
- 其他欧洲地区
- 南美洲
- 巴西
- 阿根廷
- 哥伦比亚
- 其他南美洲
- 中东和非洲
- 沙乌地阿拉伯
- 阿拉伯聯合大公国
- 南非
- 埃及
- 其他中东和非洲地区
- 亚太地区
第六章 竞争情势
- 市场集中度
- 策略趋势
- 市占率(%)/排名分析
- 公司简介
- AMSOIL Inc.
- Bharat Petroleum Corp. Ltd
- Blaser Swisslube AG
- BP plc(Castrol)
- Carl Bechem GmbH
- Chevron Corporation
- China National Petroleum Corporation(PetroChina)
- China Petroleum & Chemical Corp.(Sinopec)
- ENEOS Corporation
- Eni SpA
- Exxon Mobil Corporation
- FUCHS SE
- Gazprom Neft PJSC
- GS Caltex Corporation
- Gulf Oil International
- Hindustan Petroleum Corp. Ltd
- Idemitsu Kosan Co. Ltd
- Indian Oil Corporation Ltd.
- Kluber Lubrication
- LUKOIL
- Motul
- Petrobras
- Petronas Lubricants International
- Phillips 66 Company
- PT Pertamina(Persero)
- Repsol
- ROCOL
- ROSNEFT
- Shell plc
- TotalEnergies SE
- Valvoline Inc.
第七章 市场机会与未来展望
The Industrial Lubricants Market market is expected to grow from 22.82 billion liters in 2025 to 23.61 billion liters in 2026 and is forecast to reach 27.95 billion liters by 2031 at 3.44% CAGR over 2026-2031.
This steady trajectory shows the sector's shift from bulk commodity sales to tailor-made fluids that maximize equipment uptime and energy efficiency. Rapid wind-turbine installations and Industry 4.0 upgrades are expanding lubricant performance requirements beyond legacy specifications, spurring demand for synthetic and bio-based chemistries. Asia-Pacific dominates current consumption thanks to large-scale manufacturing investments and integrated refinery-petrochemical complexes that capture higher-value lubricant margins. Producers worldwide are also channeling R&D toward PFAS-free additives and condition-monitoring-ready fluids in response to tightening environmental rules and predictive-maintenance adoption.
Global Industrial Lubricants Market Trends and Insights
Surging Wind-Turbine Gearbox Lubricant Demand
Global wind-power build-outs are multiplying specialized gearbox-oil requirements that standard fluids cannot satisfy. China's installed wind capacity reached 440 GW by December 2023, with many turbine failures traced to lubrication shortcomings. Synthetic oils fortified with anti-wear and corrosion inhibitors extend service intervals from 6 months to 3 years, trimming offshore maintenance costs. Robust water-separation properties are essential because remote turbines must minimize helicopter-based servicing. Developers increasingly specify ISO VG 320-460 PAO blends that preserve viscosity across wide temperature swings, protecting multi-megawatt gearsets during harsh gust events. Each 15-MW offshore turbine can consume over 800 liters per service cycle, so the industrial lubricants market sees a direct volume lift from larger unit ratings.
Industrial Automation and Industry 4.0 Lubrication Intensity
Smart factories deploy precision equipment that runs hotter and faster, demanding fluids with narrow viscosity tolerances and negligible sensor interference. Automated lubrication systems meter doses based on real-time analytics, cutting consumption 30%-40% while boosting uptime. Fluids must keep tribological stability when exposed to magnetic-plug or infrared debris monitoring, so additive solubility and metal-ion content are tightly specified. Artificial-intelligence platforms now adjust formulation recommendations by reading vibration and temperature feeds, pushing suppliers to create modular additive packages for on-site customization. These developments anchor a long-term upward mix shift within the industrial lubricants market toward premium synthetic and hybrid products.
Stricter Waste-Oil and Spill Regulations
PFAS-phaseout mandates in the EU and several U.S. states force formulators to redesign long-standing products. Certification of alternative chemistries slows time-to-market and inflates R&D budgets. At the user level, collection systems must now document cradle-to-grave traceability, lifting disposal costs and capital outlays for containment. Spill-prevention directives require double-walled tanks and real-time leak alarms, raising infrastructure costs for small workshops. While these hurdles dampen short-term demand, they also open niches for compliant, higher-margin formulations within the industrial lubricants market.
Other drivers and restraints analyzed in the detailed report include:
- Shift Toward Synthetic and Semi-Synthetic Long-Drain Oils
- Expansion of Mining and Construction Equipment Fleets
- Crude-Derived Base-Oil Price Volatility
For complete list of drivers and restraints, kindly check the Table Of Contents.
Segment Analysis
Engine oil contributed 23.29% of 2025 sales, safeguarding critical generators and stationary compressors across heavy industries. This share underscores deep-rooted maintenance routines that favor monograde SAE 40 and 15W-40 multigrades compatible with legacy engines. Yet demand plateaus as OEMs pivot to gas engines with longer drain specifications. Hydraulic and transmission fluids, in contrast, are set to grow at a 3.92% CAGR as robotics, injection-molding machines, and wind-turbine pitch systems expand. Metalworking fluids benefit from Asia-Pacific machine-tool investments, and ionic-liquid cutting oils deliver longer tool life than mineral benchmarks.
Synthetic grease blends incorporating molybdenum disulfide and graphite are grabbing share in extreme-pressure bearings exposed to 200 °C kiln outlets. Meanwhile, demand for process oils ties directly to petrochemical debottlenecking in China, India, and the U.S. Up-and-coming electric-motor cooling oils illustrate how evolving machinery profiles continuously reshape the industrial lubricants market.
The Industrial Lubricants Market Report is Segmented by Product Type (Engine Oil, Hydraulic and Transmission Fluid, Metalworking Fluid, and More), End-User Industry (Power Generation, Heavy Equipment, Food and Beverage Processing, Metallurgy and Metalworking, Chemical and Process Industries, and Other Industries), and Geography (Asia-Pacific, North America, and More). The Market Forecasts are Provided in Terms of Volume (Liters).
Geography Analysis
Asia-Pacific accounted for 46.88% of 2025 volumes and is tracking a 3.61% CAGR through 2031, where Chinese refiners integrate chemicals to lift lubricant margins. India draws heavy foreign investment, with Lubrizol earmarking USD 200 million for a new Aurangabad plant that will be its second-largest worldwide. Southeast Asian countries welcome factory relocations and renewable-energy projects, driving hydraulic and gear oil uptake. Japan and South Korea sustain above-average synthetic penetration due to precision manufacturing and stringent energy-saving targets.
North America and Europe concentrate on PFAS-free formulations and carbon-linked efficiency gains. The U.S. leverages shale-derived feedstocks, yet EV adoption gradually curbs traditional engine oil demand. Europe leads the policy push that elevates bio-lubricants, compelling rapid formulation shifts. Canada's oil-sands mining keeps high-temperature lubricant requirements active, whereas Mexico's automotive investments broaden local demand.
The Middle-East and Africa rely on hydrocarbon extraction projects that underpin base oil supply and diversify into chemicals. A new additive plant from the Richful-Farabi venture in Saudi Arabia will shorten supply lines for regional blenders. South Africa's deep-level mining and Nigeria's refining upgrades contribute niche opportunities. South America shows pockets of high growth around Brazilian petrochemical debottlenecking and Chilean copper expansions, cementing its role as an important albeit smaller outlet for industrial lubricants market suppliers.
- AMSOIL Inc.
- Bharat Petroleum Corp. Ltd
- Blaser Swisslube AG
- BP p.l.c. (Castrol)
- Carl Bechem GmbH
- Chevron Corporation
- China National Petroleum Corporation (PetroChina)
- China Petroleum & Chemical Corp. (Sinopec)
- ENEOS Corporation
- Eni SpA
- Exxon Mobil Corporation
- FUCHS SE
- Gazprom Neft PJSC
- GS Caltex Corporation
- Gulf Oil International
- Hindustan Petroleum Corp. Ltd
- Idemitsu Kosan Co. Ltd
- Indian Oil Corporation Ltd.
- Kluber Lubrication
- LUKOIL
- Motul
- Petrobras
- Petronas Lubricants International
- Phillips 66 Company
- PT Pertamina (Persero)
- Repsol
- ROCOL
- ROSNEFT
- Shell plc
- TotalEnergies SE
- Valvoline Inc.
Additional Benefits:
- The market estimate (ME) sheet in Excel format
- 3 months of analyst support
TABLE OF CONTENTS
1 Introduction
- 1.1 Study Assumptions and Market Definition
- 1.2 Scope of the Study
2 Research Methodology
3 Executive Summary
4 Market Landscape
- 4.1 Market Overview
- 4.2 Market Drivers
- 4.2.1 Surging wind-turbine gearbox lubricant demand
- 4.2.2 Industrial automation and Industry 4.0 lubrication intensity
- 4.2.3 Shift toward synthetic and semi-synthetic long-drain oils
- 4.2.4 Expansion of mining and construction equipment fleets
- 4.2.5 Carbon-pricing pull for ultra-low-friction bio-lubricants
- 4.3 Market Restraints
- 4.3.1 Stricter waste-oil and spill regulations
- 4.3.2 Crude-derived base-oil price volatility
- 4.3.3 Dry-drive electric motors reducing oil demand
- 4.4 Value Chain Analysis
- 4.5 Porter's Five Forces
- 4.5.1 Bargaining Power of Suppliers
- 4.5.2 Bargaining Power of Buyers
- 4.5.3 Threat of New Entrants
- 4.5.4 Threat of Substitutes
- 4.5.5 Degree of Competition
5 Market Size and Growth Forecasts (Volume)
- 5.1 By Product Type
- 5.1.1 Engine Oil
- 5.1.2 Hydraulic and Transmission Fluid
- 5.1.3 Metalworking Fluid
- 5.1.4 General Industrial Oil
- 5.1.5 Gear Oil
- 5.1.6 Grease
- 5.1.7 Process Oil
- 5.1.8 Others
- 5.2 By End-user Industry
- 5.2.1 Power Generation
- 5.2.2 Heavy Equipment
- 5.2.3 Food and Beverage Processing
- 5.2.4 Metallurgy and Metalworking
- 5.2.5 Chemical and Process Industries
- 5.2.6 Other Industries (Pulp and Paper, Marine, etc.)
- 5.3 By Geography
- 5.3.1 Asia-Pacific
- 5.3.1.1 China
- 5.3.1.2 India
- 5.3.1.3 Japan
- 5.3.1.4 South Korea
- 5.3.1.5 Indonesia
- 5.3.1.6 Thailand
- 5.3.1.7 Vietnam
- 5.3.1.8 Malaysia
- 5.3.1.9 Rest of Asia-Pacific
- 5.3.2 North America
- 5.3.2.1 United States
- 5.3.2.2 Canada
- 5.3.2.3 Mexico
- 5.3.3 Europe
- 5.3.3.1 Germany
- 5.3.3.2 United Kingdom
- 5.3.3.3 France
- 5.3.3.4 Italy
- 5.3.3.5 Spain
- 5.3.3.6 Russia
- 5.3.3.7 Rest of Europe
- 5.3.4 South America
- 5.3.4.1 Brazil
- 5.3.4.2 Argentina
- 5.3.4.3 Colombia
- 5.3.4.4 Rest of South America
- 5.3.5 Middle-East and Africa
- 5.3.5.1 Saudi Arabia
- 5.3.5.2 United Arab Emirates
- 5.3.5.3 South Africa
- 5.3.5.4 Egypt
- 5.3.5.5 Rest of Middle-East and Africa
- 5.3.1 Asia-Pacific
6 Competitive Landscape
- 6.1 Market Concentration
- 6.2 Strategic Moves
- 6.3 Market Share(%)/Ranking Analysis
- 6.4 Company Profiles (includes Global level Overview, Market level overview, Core Segments, Financials as available, Strategic Information, Market Rank/Share for key companies, Products and Services, and Recent Developments)
- 6.4.1 AMSOIL Inc.
- 6.4.2 Bharat Petroleum Corp. Ltd
- 6.4.3 Blaser Swisslube AG
- 6.4.4 BP p.l.c. (Castrol)
- 6.4.5 Carl Bechem GmbH
- 6.4.6 Chevron Corporation
- 6.4.7 China National Petroleum Corporation (PetroChina)
- 6.4.8 China Petroleum & Chemical Corp. (Sinopec)
- 6.4.9 ENEOS Corporation
- 6.4.10 Eni SpA
- 6.4.11 Exxon Mobil Corporation
- 6.4.12 FUCHS SE
- 6.4.13 Gazprom Neft PJSC
- 6.4.14 GS Caltex Corporation
- 6.4.15 Gulf Oil International
- 6.4.16 Hindustan Petroleum Corp. Ltd
- 6.4.17 Idemitsu Kosan Co. Ltd
- 6.4.18 Indian Oil Corporation Ltd.
- 6.4.19 Kluber Lubrication
- 6.4.20 LUKOIL
- 6.4.21 Motul
- 6.4.22 Petrobras
- 6.4.23 Petronas Lubricants International
- 6.4.24 Phillips 66 Company
- 6.4.25 PT Pertamina (Persero)
- 6.4.26 Repsol
- 6.4.27 ROCOL
- 6.4.28 ROSNEFT
- 6.4.29 Shell plc
- 6.4.30 TotalEnergies SE
- 6.4.31 Valvoline Inc.
7 Market Opportunities and Future Outlook
- 7.1 White-space and Unmet-Need Assessment
 工业润滑油市场:2026-2030年全球市场依产品类型、基础油、最终用户及通路分類的预测
 工业润滑油市场规模、份额和成长分析(按基础油类型、产品类型、应用、最终用户产业和地区划分)-2026-2033年产业预测
 工业润滑油市场:依类型(液压油、金属加工油、齿轮油、压缩机油、润滑脂)及产业(建筑与矿业、金属生产、水泥与化工、发电、石油与天然气)划分-全球预测至2036年
 工业润滑剂市场分析及预测(至2035年):类型、产品类型、应用、技术、最终用户、功能、形态、材质类型、设备
 工业润滑油市场规模、份额和趋势分析报告:按产品、应用、地区和细分市场预测,2026-2033年滑道油市场规模、份额和趋势分析报告:按产品、应用、地区和细分市场预测(2026-2033 年)工业油脂分离器市场:依产品类型、材料类型、安装类型、容量、最终用户和分销管道划分-全球预测,2026-2032年
 日本工业润滑油市场报告(依产品类型、基础油、最终用途产业和地区划分,2026-2034年)
 重型设备润滑油市场-2025年至2030年预测润滑油桶市场规模、占有率、成长及全球产业分析:按类型、应用和地区划分的洞察,2024-2032 年预测