


 |
市场调查报告书
商品编码
1910476
高效能资料分析:市场占有率分析、产业趋势与统计、成长预测(2026-2031)High-Performance Data Analytics - Market Share Analysis, Industry Trends & Statistics, Growth Forecasts (2026 - 2031) |
||||||
※ 本网页内容可能与最新版本有所差异。详细情况请与我们联繫。
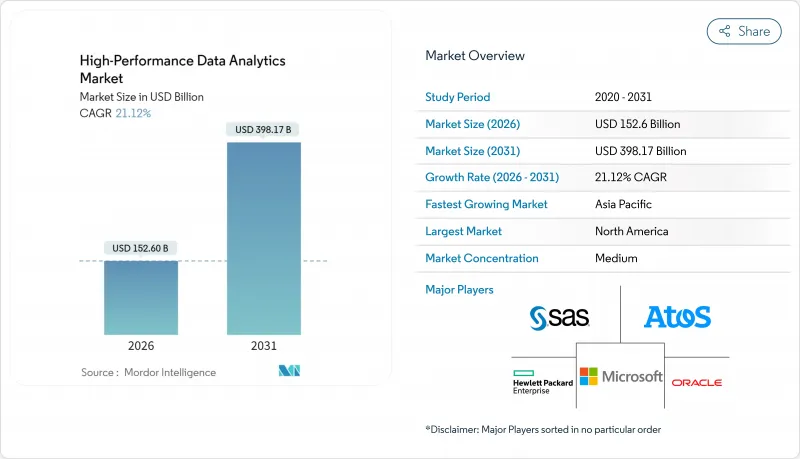
高效能资料分析市场预计将从 2025 年的 1,259.9 亿美元成长到 2026 年的 1,526 亿美元,预计到 2031 年将达到 3,981.7 亿美元,2026 年至 2031 年的复合年增长率为 21.12%。
人工智慧、云端运算和企业数据爆炸性成长共同推动了这一成长势头。金融服务仍然是领先的应用领域,因为即时诈欺分析对于确保银行交易安全至关重要。虽然软体收入占比高达 46.2%,但服务板块的成长速度最快,这主要得益于专业的 AI 咨询服务。目前,本地部署主导主导地位,市场份额高达 57.8%,但随着供应商不断扩大全球 GPU 容量,云端解决方案以 30.1% 的复合年增长率 (CAGR) 成为明显的成长引擎。从区域来看,北美市场占有率为 35.4%,但由于亚太地区正在大力推动数位转型,预计该地区将实现最快成长。虽然大型企业是目前的主导力量,但 GPU 租赁价格的暴跌正在缩小与中小企业之间的差距。例如,H100 实例每小时 3.35 美元的价格比超大规模资料中心业者大规模资料中心的标价低 90% 以上。
全球高性能资料分析市场趋势与洞察
加速在银行、金融服务和保险 (BFSI) 行业中采用即时分析技术进行诈欺检测
社交工程诈骗激增十倍,目前已占数位银行诈骗的23%,这正推动金融机构迅速采用高效能诈骗侦测引擎。道明银行(TD Bank)在荣获2024年FICO决策奖后,实现了企业级即时监控。该人工智慧平台在处理1Gbps资料流的同时,也能达到98.5%的侦测准确率,且无延迟。因此,银行、金融服务和保险(BFSI)机构正在将低延迟分析技术融入支付系统、信用风险评分和客户身份验证(KYC)流程,以保护其声誉和财务资本。这些应用为高效能资料分析市场整体5.2%的复合年增长率奠定了基础。
人工智慧/机器学习模型训练的快速成长需要Petabyte级资料处理。
生成式人工智慧模型中的参数数量每六个月翻一番,这需要Petabyte的资料撷取和百万兆级计算丛集。与人工智慧工作负载相关的超大规模资料中心投资预计将从2024年的1,627.9亿美元增加到2030年的6,085.4亿美元。微软和Google等供应商已为下一代人工智慧设施总合拨款1,550亿美元。这些资本支出将推动对分散式檔案系统、高吞吐量互连和高阶调度软体的需求,从而促进市场成长6.8%。
专用高效能运算丛集的总拥有成本高
预计到2025年,数据中心建设的资本支出将超过2,500亿美元,而不断增长的电力需求预计到2030年还将增加5,000亿美元。许多开发中国家面临电力短缺,这阻碍了本地高效能运算(HPC)设施的推出。设备、冷却和熟练人员的人事费用,使得企业难以证明部署本地丛集的合理性,从而抑制了资源匮乏地区的部署,并导致整体复合年增长率仅为2.1%。
细分市场分析
到2025年,软体业务将占总营收的45.78%,反映出市场对使用者友善分析引擎、资料架构层和AI编配工具的需求。供应商正在整合工作流程自动化和特征储存功能,以加速跨业务部门的模型部署。 DevOps整合正在缩短回馈週期,授权结构也正转向与价值创造挂钩的付费使用制。硬体销售将继续保持其基础性地位,这主要得益于硅技术的进步,例如NVIDIA Blackwell Ultra GPU,它能够为变压器工作负载提供高密度张量核心。
服务领域成长最快,预计到2031年将以25.05%的复合年增长率成长。咨询团队目前正将资料策略设计、MLOps实施和持续模型调校服务打包,以填补复杂混合架构中的专业知识缺口。服务提供者开始提供人工智慧即服务(AIaaS)编配,包括託管特征工程、偏差审核和联邦学习编排。这些变化正在扩大潜在需求,并推动高效能资料分析即服务合约的市场规模成长,尤其是在首次采用者该服务的企业用户中。
截至2025年,本地部署将占据57.05%的市场份额,这主要得益于对延迟和资料主权要求较高的行业,例如政府机构和银行业。各组织机构表示,直接控制硬体以及遵守严格的资料居住法规是其主要动机。许多公司正在利用现有资料中心的沉没成本,透过节点更新来优化运转率,而不是完全迁移到云端。
受弹性扩展、付费使用制和全球边缘区域部署的推动,云端平台正以 29.25% 的复合年增长率 (CAGR) 成长。为了缓解监管方面的担忧,服务提供者正在扩展机密运算实例和主权云端区域。混合云和多重云端模式在新计画占据主导地位,将本地加速器与用于人工智慧训练的突发容量相结合。这种转变正在扩大以消费为导向的高效能资料分析市场规模,同时降低资源受限企业的进入门槛。
区域分析
2025年,北美地区维持了34.85%的收入份额,这主要得益于其庞大的超超大规模资料中心业者资料中心布局和企业级人工智慧的早期应用。为满足人工智慧推理的激增需求,美国资料中心供应量年增26%,达到5.2吉瓦。 TD银行等金融机构已采用利用全国支付遥测数据的即时诈欺评分技术,显示该行业已日趋成熟。预计2024年北维吉尼亚的租金将上涨41.6%,显示产能紧张正在推动资料中心的持续扩张。
亚太地区预计将成为成长最快的地区,复合年增长率将达到27.2%。印度计划在2026年将其资料中心装置容量翻一番,达到约1.8吉瓦,这得益于国内外投资者数十亿美元的投资。台湾预计到2028年将在设施建设方面投入超过30亿美元,以满足晶片设计模拟和大型语言模型(LLM)训练的需求。中国正在缩小与美国在模型品质方面的差距,省级津贴正在刺激下一代人工智慧框架的开发。然而,严格的资料本地化法规迫使企业建构特定国家的分析堆迭,而不是统一的全球基础架构。
欧洲正大力推动边缘到云端的转型,以实现製造业和关键基础设施的现代化。欧盟的目标是到2030年实现75%的企业云采用率,并部署1万个气候中和的边缘节点。各国政府正在资助6G测试平台(需要低延迟分析)、通讯业者边缘云端试点计画以及工业元宇宙示范计划。欧洲首家人工智慧工厂将于2024年投入运营,为希望在不汇出资料的情况下训练模型的汽车、航太和能源公司提供自主运算环境。
其他福利:
- Excel格式的市场预测(ME)表
- 3个月的分析师支持
目录
第一章 引言
- 研究假设和市场定义
- 调查范围
第二章调查方法
第三章执行摘要
第四章 市场情势
- 市场概览
- 市场驱动因素
- 加速北美金融服务业(BFSI)采用即时分析技术进行诈欺侦测
- 亚洲人工智慧/机器学习模型训练的快速成长需要Petabyte级资料处理能力。
- 欧洲智慧製造领域高效能运算从边缘到云端的发展
- 中东各国政府的国防巨量资料现代化项目
- 可再生能源电网优化倡议推动南美洲高效能运算分析的发展
- GPU/CPU丛集单核心成本的下降使得全球中小企业能够负担得起高效能运算(HPC)。
- 市场限制
- 加勒比海和非洲专用高效能运算丛集的总拥有成本高昂
- 欧洲和大洋洲缺乏熟练的高效能运算和平行程式设计专家
- 资料主权法规限制了亚洲的跨境云分析。
- 新兴市场的基础设施可靠性问题阻碍了数据的连续传输。
- 监理展望
- 技术展望
- 高效能丛集运算的演进
- 网格计算
- 记忆体内分析
- 资料库库内分析
- 波特五力分析
- 供应商的议价能力
- 买方的议价能力
- 新进入者的威胁
- 替代品的威胁
- 竞争对手之间的竞争
- 投资分析
第五章 市场规模与成长预测
- 按组件
- 硬体
- 软体
- 服务
- 按部署模式
- 本地部署
- 按需/云端
- 按组织规模
- 小型企业
- 大公司
- 按最终用户行业划分
- 银行、金融服务和保险(BFSI)
- 政府和国防机构
- 能源与公用事业
- 零售与电子商务
- 医疗保健和生命科学
- 通讯和资讯科技服务
- 製造业
- 按地区
- 北美洲
- 美国
- 加拿大
- 墨西哥
- 南美洲
- 巴西
- 阿根廷
- 智利
- 秘鲁
- 其他南美洲
- 欧洲
- 德国
- 英国
- 法国
- 义大利
- 西班牙
- 其他欧洲
- 亚太地区
- 中国
- 日本
- 韩国
- 印度
- 澳洲
- 纽西兰
- 亚太其他地区
- 中东
- 阿拉伯聯合大公国
- 沙乌地阿拉伯
- 土耳其
- 其他中东地区
- 非洲
- 南非
- 其他非洲地区
- 北美洲
第六章 竞争情势
- 策略发展
- 供应商定位分析
- 公司简介
- Amazon Web Services, Inc.(AWS)
- Google LLC
- Microsoft Corporation
- IBM Corporation
- Hewlett Packard Enterprise(HPE)
- Dell Technologies Inc.
- SAS Institute Inc.
- Oracle Corporation
- Fujitsu Limited
- Intel Corporation
- ATOS SE
- Juniper Networks Inc.
- NEC Corporation
- Cisco Systems, Inc.
- Teradata Corporation
- Cray Inc.(HPE Cray)
- Altair Engineering Inc.
- Cloudera, Inc.
- Huawei Technologies Co., Ltd.
- Hitachi Vantara LLC
- Super Micro Computer, Inc.
第七章 市场机会与未来展望
The high-performance data analytics market is expected to grow from USD 125.99 billion in 2025 to USD 152.6 billion in 2026 and is forecast to reach USD 398.17 billion by 2031 at 21.12% CAGR over 2026-2031.
Momentum comes from the convergence of AI, cloud computing, and the swelling volume of enterprise data. Financial services remain a prime adopter as real-time fraud analytics become essential for secure transaction banking. Software accounts for 46.2% revenue, while services are expanding fastest on the back of specialized AI consulting. On-premise deployments presently lead with 57.8% share, yet cloud-based solutions are the clear growth engine at a 30.1% CAGR as providers scale global GPU capacity. Regionally, North America commands 35.4% share, but Asia-Pacific is on track for the quickest gains given sweeping digital-transformation programs. Large enterprises dominate adoption, though SMEs are narrowing the gap thanks to plummeting GPU rental rates, exemplified by USD 3.35-per-hour H100 instances that undercut hyperscaler list prices by more than 90%.
Global High-Performance Data Analytics Market Trends and Insights
Accelerating Adoption of Real-Time Analytics in BFSI for Fraud Detection
Financial institutions have recorded a tenfold rise in social-engineering scams, now 23% of digital-banking fraud cases, prompting rapid rollouts of high-performance fraud-detection engines. TD Bank achieved enterprise-wide real-time monitoring after winning the 2024 FICO Decisions Award. AI-enabled platforms are attaining 98.5% detection accuracy while processing 1 Gbps data streams without latency. As a result, BFSI institutions are embedding low-latency analytics into payment rails, credit-risk scoring, and know-your-customer checks to safeguard reputational and financial capital. These deployments underpin a 5.2% lift in the overall CAGR for the high-performance data analytics market.
Surge in AI/ML Model Training Requiring Petabyte-Scale Data Processing
Generative-AI models are doubling in parameter count every six months, demanding petabyte-scale data ingestion and exascale compute clusters. Hyperscale data-center investment tied to AI workloads is set to climb from USD 162.79 billion in 2024 to USD 608.54 billion by 2030. Providers such as Microsoft and Google have earmarked a combined USD 155 billion for next-generation AI facilities. This capital outlay elevates demand for distributed file systems, high-throughput interconnects, and advanced scheduling software, translating into a 6.8% positive push on market growth.
High Total Cost of Ownership for Dedicated HPC Clusters
Capital expenditure on data-center builds is projected to surpass USD 250 billion in 2025, and expanding power needs add a further USD 500 billion through 2030. Many developing nations face electricity shortfalls that hinder the launch of local HPC facilities. Organizations struggle to justify on-premise clusters once equipment, cooling, and skilled-staff costs are tallied, curbing adoption in resource-constrained regions and trimming overall CAGR by 2.1%.
Other drivers and restraints analyzed in the detailed report include:
- Growth of Edge-to-Cloud HPC for Smart Manufacturing
- Falling Cost-Per-Core for GPU/CPU Clusters Enabling Affordable HPC for SMEs
- Shortage of Skilled HPC & Parallel-Programming Professionals
For complete list of drivers and restraints, kindly check the Table Of Contents.
Segment Analysis
The software segment generated 45.78% of revenue in 2025, reflecting demand for user-friendly analytics engines, data-fabric layers, and AI orchestration tools. Vendors are embedding workflow automation and feature-store capabilities that hasten model deployment across business units. DevOps integration is tightening feedback cycles, and license structures are shifting toward consumption-based billing that aligns cost with value creation. Hardware sales remain foundational, propelled by silicon advances such as NVIDIA Blackwell Ultra GPUs that field higher tensor-core density for transformer workloads.
Services are the quickest-expanding line, projected at 25.05% CAGR through 2031. Consulting teams now bundle data-strategy design, MLOps implementation, and continuous-model-tuning services, filling expertise gaps in complex hybrid stacks. Providers are launching AI-as-a-Service offerings that include managed feature engineering, bias auditing, and federated-learning orchestration. These shifts broaden addressable demand and lift the high-performance data analytics market size for service engagements, especially among first-time enterprise adopters.
On-premise deployments held 57.05% share in 2025, anchored by sectors that guard latency or sovereignty, including government and banking. Organizations cite direct hardware control and compliance with strict data-residency statutes as prime motives. Many firms also leverage existing data-center sunk costs, optimizing occupancy rates by refreshing nodes rather than migrating wholesale to cloud.
Cloud platforms are climbing at a 29.25% CAGR, propelled by elastic scaling, consumption pricing, and global edge-zone rollouts. Providers have broadened confidential-computing instances and sovereign-cloud regions to mollify regulatory concerns. Hybrid and multi-cloud patterns now dominate greenfield projects, combining local accelerators with burst capacity for AI training. The shift is enlarging the high-performance data analytics market size attached to consumption models while easing entry for resource-constrained enterprises.
The High-Performance Data Analytics Market Report is Segmented by Component (Hardware, Software, and Services), Deployment Model (On-Premise, and On-Demand/Cloud), Organization Size (Small and Medium Enterprises, and Large Enterprises), End-User Industry (BFSI, Government and Defense, Energy and Utilities, and More), and Geography. The Market Forecasts are Provided in Terms of Value (USD).
Geography Analysis
North America maintained 34.85% revenue leadership in 2025, buoyed by deep hyperscaler footprints and early enterprise AI adoption. U.S. data-center supply rose by 26% year on year to 5.2 GW, matching proliferating AI inference demand. Banks such as TD leverage national payment telemetry for instant fraud scoring, underscoring sector maturity. Rental rates in Northern Virginia advanced 41.6% in 2024, evidencing tight capacity that spurs continued build-outs.
Asia-Pacific is the fastest-growing region with a 27.2% CAGR outlook. India plans to double installed data-center capacity to nearly 1.8 GW by 2026, underwritten by multibillion-dollar commitments from domestic and global investors. Taiwan's facility builds are forecast to exceed USD 3 billion by 2028 to service chip-design simulations and large-language-model training. China is closing the model-quality gap with the United States, with provincial grants catalyzing next-generation AI frameworks. Yet, stringent data-localization rules are compelling firms to engineer country-specific analytics stacks rather than unified global fabrics.
Europe is scaling edge-to-cloud initiatives to modernize manufacturing and critical infrastructure. The EU aims to reach 75% business-cloud adoption and deploy 10,000 climate-neutral edge nodes by 2030. National programs channel capital toward 6G testbeds, telco-edge cloud pilots, and industrial metaverse demonstrators that require low-latency analytics. The opening of the first European AI factories in 2024 provides sovereign compute for automotive, aerospace, and energy firms seeking to train models without exporting data.
- Amazon Web Services, Inc. (AWS)
- Google LLC
- Microsoft Corporation
- IBM Corporation
- Hewlett Packard Enterprise (HPE)
- Dell Technologies Inc.
- SAS Institute Inc.
- Oracle Corporation
- Fujitsu Limited
- Intel Corporation
- ATOS SE
- Juniper Networks Inc.
- NEC Corporation
- Cisco Systems, Inc.
- Teradata Corporation
- Cray Inc. (HPE Cray)
- Altair Engineering Inc.
- Cloudera, Inc.
- Huawei Technologies Co., Ltd.
- Hitachi Vantara LLC
- Super Micro Computer, Inc.
Additional Benefits:
- The market estimate (ME) sheet in Excel format
- 3 months of analyst support
TABLE OF CONTENTS
1 Introduction
- 1.1 Study Assumptions and Market Definition
- 1.2 Scope of the Study
2 Research Methodology
3 Executive Summary
4 Market Landscape
- 4.1 Market Overview
- 4.2 Market Drivers
- 4.2.1 Accelerating Adoption of Real-Time Analytics in BFSI for Fraud Detection in North America
- 4.2.2 Surge in AI/ML Model Training Requiring Petabyte-Scale Data Processing in Asia
- 4.2.3 Growth of Edge-to-Cloud HPC for Smart Manufacturing in Europe
- 4.2.4 National Defense Big-Data Modernization Programs Across Middle East Governments
- 4.2.5 Renewable-Energy Grid Optimization Initiatives Driving HPC Analytics in South America
- 4.2.6 Falling Cost-per-Core for GPU/CPU Clusters Enabling Affordable HPC for SMEs Globally
- 4.3 Market Restraints
- 4.3.1 High Total Cost of Ownership for Dedicated HPC Clusters in Caribbeans and Africa
- 4.3.2 Shortage of Skilled HPC and Parallel Programming Professionals in Europe and Oceania
- 4.3.3 Data-Sovereignty Regulations Limiting Cross-Border Cloud Analytics in Asia
- 4.3.4 Infrastructure Reliability Issues in Emerging Markets Hampering Continuous Data Streams
- 4.4 Regulatory Outlook
- 4.5 Technological Outlook
- 4.5.1 High-Performance Cluster Computing Evolution
- 4.5.2 Grid Computing
- 4.5.3 In-Memory Analytics
- 4.5.4 In-Database Analytics
- 4.6 Porter's Five Forces Analysis
- 4.6.1 Bargaining Power of Suppliers
- 4.6.2 Bargaining Power of Buyers
- 4.6.3 Threat of New Entrants
- 4.6.4 Threat of Substitutes
- 4.6.5 Intensity of Competitive Rivalry
- 4.7 Investment Analysis
5 Market Size and Growth Forecasts
- 5.1 By Component
- 5.1.1 Hardware
- 5.1.2 Software
- 5.1.3 Services
- 5.2 By Deployment Model
- 5.2.1 On-Premise
- 5.2.2 On-Demand/Cloud
- 5.3 By Organization Size
- 5.3.1 Small and Medium Enterprises (SMEs)
- 5.3.2 Large Enterprises
- 5.4 By End-User Industry
- 5.4.1 Banking, Financial Services and Insurance (BFSI)
- 5.4.2 Government and Defense
- 5.4.3 Energy and Utilities
- 5.4.4 Retail and E-Commerce
- 5.4.5 Healthcare and Life Sciences
- 5.4.6 Telecommunication and IT Services
- 5.4.7 Manufacturing
- 5.5 By Geography
- 5.5.1 North America
- 5.5.1.1 United States
- 5.5.1.2 Canada
- 5.5.1.3 Mexico
- 5.5.2 South America
- 5.5.2.1 Brazil
- 5.5.2.2 Argentina
- 5.5.2.3 Chile
- 5.5.2.4 Peru
- 5.5.2.5 Rest of South America
- 5.5.3 Europe
- 5.5.3.1 Germany
- 5.5.3.2 United Kingdom
- 5.5.3.3 France
- 5.5.3.4 Italy
- 5.5.3.5 Spain
- 5.5.3.6 Rest of Europe
- 5.5.4 Asia-Pacific
- 5.5.4.1 China
- 5.5.4.2 Japan
- 5.5.4.3 South Korea
- 5.5.4.4 India
- 5.5.4.5 Australia
- 5.5.4.6 New Zealand
- 5.5.4.7 Rest of Asia-Pacific
- 5.5.5 Middle East
- 5.5.5.1 United Arab Emirates
- 5.5.5.2 Saudi Arabia
- 5.5.5.3 Turkey
- 5.5.5.4 Rest of Middle East
- 5.5.6 Africa
- 5.5.6.1 South Africa
- 5.5.6.2 Rest of Africa
- 5.5.1 North America
6 Competitive Landscape
- 6.1 Strategic Developments
- 6.2 Vendor Positioning Analysis
- 6.3 Company Profiles (includes Global level Overview, Market level overview, Core Segments, Financials as available, Strategic Information, Products and Services, and Recent Developments)
- 6.3.1 Amazon Web Services, Inc. (AWS)
- 6.3.2 Google LLC
- 6.3.3 Microsoft Corporation
- 6.3.4 IBM Corporation
- 6.3.5 Hewlett Packard Enterprise (HPE)
- 6.3.6 Dell Technologies Inc.
- 6.3.7 SAS Institute Inc.
- 6.3.8 Oracle Corporation
- 6.3.9 Fujitsu Limited
- 6.3.10 Intel Corporation
- 6.3.11 ATOS SE
- 6.3.12 Juniper Networks Inc.
- 6.3.13 NEC Corporation
- 6.3.14 Cisco Systems, Inc.
- 6.3.15 Teradata Corporation
- 6.3.16 Cray Inc. (HPE Cray)
- 6.3.17 Altair Engineering Inc.
- 6.3.18 Cloudera, Inc.
- 6.3.19 Huawei Technologies Co., Ltd.
- 6.3.20 Hitachi Vantara LLC
- 6.3.21 Super Micro Computer, Inc.
7 Market Opportunities and Future Outlook
- 7.1 White-space and Unmet-Need Assessment


