


 |
市场调查报告书
商品编码
1910545
房车(休閒车)租赁:市场份额分析、行业趋势和统计数据、成长预测(2026-2031)Recreational Vehicle Rental - Market Share Analysis, Industry Trends & Statistics, Growth Forecasts (2026 - 2031) |
||||||
※ 本网页内容可能与最新版本有所差异。详细情况请与我们联繫。
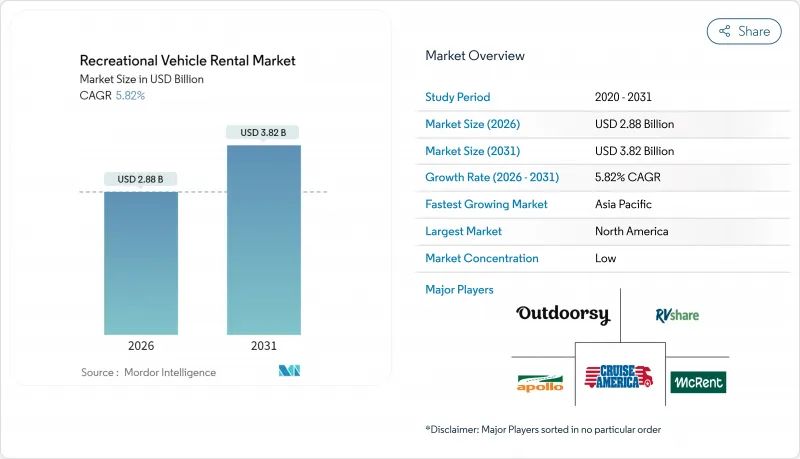
预计到 2025 年,休閒车 (RV) 租赁市场价值将达到 27.2 亿美元,从 2026 年的 28.8 亿美元成长到 2031 年的 38.2 亿美元。
预计在预测期(2026-2031 年)内,复合年增长率将达到 5.82%。
儘管燃油价格上涨和区域规划限制增加了营运成本,但市场仍保持稳定成长。自驾游度假方式的转变、P2P预订平台的普及以及更易于驾驶和维护的现代车辆设计的改进,都在推动市场需求。营运商正在加速采用远端资讯处理技术以提高车辆运转率,而一些州和欧盟国家的政策制定者正在努力将零排放奖励与车辆更换週期相匹配。竞争格局瞬息万变,整合尝试面临反垄断审查,但采购和保险方面的规模经济效益仍有利于大型车队所有者。
全球房车(休閒车)租借市场趋势及洞察
国内自驾游旅游业蓬勃发展
国内公路旅行已从疫情期间的替代出行方式转变为主流休閒选择。调查显示,70%的美国旅客计划在2025年至少进行一次公路旅行,高于2023年的57%。富裕家庭也加入了这一趋势,推高了平均每日租金,但并未减少使用。随着公路旅客寻求自给自足的交通方式,越来越多的家庭选择配备车载淋浴设备和Wi-Fi的旅居车。旅行社报告称,2025年中期预订的旅游套装中,近一半将包含自驾游行程,是前一年的两倍。这种持续成长的趋势凸显了独立旅行方式的持续转变,直接惠及房车租赁市场。
P2P(P2P)租赁平台的成长
P2P网路释放了未充分利用的库存。光是Outdoorsy一家公司预计到2024年累计预订额就将超过30亿美元,并计画到2029年达到80亿美元。房东数量的成长速度超过了专业车队的扩张速度,使得房车租赁市场能够在无需大量资产负债表投资的情况下扩大车辆选择范围和地理覆盖范围。为都市区旅行者解决「最后一公里」难题的配送服务,已将P2P行程的平均时间延长至7天。平台提供的保险计划和全天候道路救援服务降低了新用户的风险感知。极具吸引力的单价成长使价格涨幅低于饭店业的通膨水平,从而扩大了价值差距,鼓励用户重复预订。
高昂的维护和保险成本
现代房车配备了复杂的电池、滑出式机构和资讯娱乐系统,推高了维修成本。熟练技工仍供不应求,主要市场的维修厂人工费超过每小时 160 美元。大型车队可以协商多车保险,但小规模车主却无法做到,这进一步扩大了房车租赁市场的成本差距。预防性维护计划和延长保固虽然有效,但需要资金投入,这对于现金流紧张的营运商来说可能是一笔不小的负担。
细分市场分析
到2025年,车队营运商的收入占总收入的69.60%,其中私人车队营运商的成长率最高。规模经济使企业车队能够获得批量采购折扣、集中维护和全面的保险。合併后的公司正寻求透过收购来扩大区域覆盖范围,但竞争监管机构正在阻止反竞争行为,例如澳洲Apollo Tourism和Tourism Holdings提案的收购方案。零排放法规相关的遵循成本有利于资金雄厚的车队,因为它们可以资金筹措充电桩和技术人员再培训的费用。
在P2P平台提供一站式预订、验证和保险服务的环境下,个体车主蓬勃发展。许多车主透过专注于本地活动或宠物友善露营车等细分市场,提高了全年运转率。平台提供的维护网路使小规模车主无需自行建造基础设施即可完成安全检查。这些趋势使个体车主成为灵活的补充而非直接替代,最终丰富了整个休閒车租赁市场。
到2025年,线上通路将占租赁市场份额的61.10%,复合年增长率达7.89%,这反映出租赁市场正在发生决定性的数位转型。即时库存管理、动态定价和整合支付等技术已将预订週期从数週缩短至数天。年轻的租车者依赖行动应用程式规划行程,并要求营运商提供360度全景车辆展示和人工智慧聊天支援。
对于行程复杂的客户而言,线下预订仍然至关重要,因为首次预订的客户需要咨询车辆类型、营地选择和路线安全等问题。营运商正越来越多地采用「线上线下结合」的模式,客户先在线上完成预订流程,然后透过展示室参观或视讯通话最终确认条款。这种混合模式既能满足更广泛的房车租赁市场需求,也能保持线下服务的可靠性。
区域分析
预计到2025年,北美将维持46.30%的收入份额。美国拥有广泛的露营地网络、成熟的保险产品以及较高的可支配收入,这些都支撑着蓬勃发展的休閒车(RV)租赁市场。加州的「先进清洁卡车」法规已被九个州采纳,该法规要求从2025年起逐步扩大零排放车辆的销售。虽然这会带来一些初期成本,但预计从长远来看,这将降低营运成本(rvia.org)。加拿大受益于丰富的自然景观和国内旅游税收优惠政策,而墨西哥的高速公路建设和不断壮大的中产阶级正在推动潜在需求并促进早期成长。
到2031年,亚太地区将以11.18%的复合年增长率成为成长最快的地区。截至2024年,日本将拥有16.5万辆註册露营车和超过500家获得认证的房车营地。在中国,由于国内电动车供应链和新建高速公路网络的推动,汽车租赁生态系统正在迅速运作中。澳洲仍然是背包客的重要目的地,但竞争监管机构反对车辆整合,因为这可能导致价格上涨。印度的新增旅客数量显着增加,各邦旅游局支持的路边设施正在降低房车租赁市场的进入门槛。
由于跨境旅行法规的统一和低排放区的扩大,欧洲房车市场正经历稳定成长。 Erwin Hymer集团2024年销售额达33.6亿美元,占欧洲23.6%的市占率(erwinhymergroup.com)。德国的高速公路网络和密集的经销商网络推动了房车的更新换代需求,而法国和西班牙则依靠其沿海地区的吸引力和悠久的露营文化。凝聚基金改善了东欧成员国的道路状况,并逐步提高了房车的普及率。一条从挪威延伸至义大利的电动车充电走廊增强了人们对电池驱动旅居车的信心,并将欧洲打造成为零排放车辆的试验场。
其他福利:
- Excel格式的市场预测(ME)表
- 3个月的分析师支持
目录
第一章 引言
第二章调查方法
第三章执行摘要
第四章 市场情势
- 市场概览
- 市场驱动因素
- 国内自驾游旅游业蓬勃发展
- P2P(P2P)租赁平台的成长
- 千禧世代和Z世代可支配收入不断成长。
- 利用远端资讯运转率优化车队利用率
- 企业将房车用作移动式临时办公空间
- 零排放房车奖励加速了电动车的普及
- 市场限制
- 高昂的维护和保险成本
- 资产运转率的季节性下降
- 地方政府对休閒车辆过夜停车有限制。
- 由于零件供应瓶颈,运转率降低。
- 价值/供应链分析
- 监管环境
- 技术展望
- 波特五力模型
- 供应商的议价能力
- 消费者议价能力
- 新进入者的威胁
- 替代品的威胁
- 竞争对手之间的竞争
第五章 市场规模及成长预测(金额)
- 按租赁供应商类型
- 个人和私人业主
- 车队营运商
- 按预订类型
- 线下预订
- 线上预订
- 依产品类型
- 旅居车
- A级旅居车
- B级旅居车
- C级旅居车
- 拖曳式房车
- 第五轮拖车
- 旅行拖车
- 卡车露营车
- 运动型多用途拖车
- 旅居车
- 按租赁期限
- 短期(1-7天)
- 期中(8-30天)
- 长期(超过30天)
- 按地区
- 北美洲
- 美国
- 加拿大
- 北美其他地区
- 南美洲
- 巴西
- 阿根廷
- 南美洲其他地区
- 欧洲
- 德国
- 英国
- 法国
- 西班牙
- 义大利
- 俄罗斯
- 其他欧洲地区
- 亚太地区
- 中国
- 印度
- 日本
- 韩国
- 澳洲
- 亚太其他地区
- 中东和非洲
- 阿拉伯聯合大公国
- 沙乌地阿拉伯
- 土耳其
- 南非
- 其他中东和非洲地区
- 北美洲
第六章 竞争情势
- 市场集中度
- 策略趋势
- 市占率分析
- 公司简介
- Cruise America
- Apollo Tourism & Leisure Ltd
- Outdoorsy, Inc.
- RVshare
- McRent
- Indie Campers
- RoadSurfer GmbH
- Camplify
- Yescapa
- El Monte RV
- Just Go Motorhome Hire
- Escape Campervans
- JUCY Rentals
- Spaceships Rentals
- Bunk Campers
第七章 市场机会与未来展望
The RV Rental Market was valued at USD 2.72 billion in 2025 and estimated to grow from USD 2.88 billion in 2026 to reach USD 3.82 billion by 2031, at a CAGR of 5.82% during the forecast period (2026-2031).
Consistent growth is visible even as fuel inflation and zoning constraints raise operating costs. A structural pivot toward road-trip vacations lifts demand, the spread of peer-to-peer booking platforms, and design upgrades that make modern vehicles easier to drive and maintain. Operators are accelerating telematics roll-outs to improve vehicle uptime, while policymakers in several states and EU countries are linking zero-emission incentives to fleet turnover. Competitive dynamics remain fluid as consolidation attempts meet antitrust scrutiny, yet scale advantages in procurement and insurance continue to favor large fleet owners.
Global Recreational Vehicle Rental Market Trends and Insights
Surge in Domestic Road-Trip Tourism
Domestic road-trip travel has moved from pandemic workaround to mainstream leisure choice. Surveys show 70% of U.S. travelers plan at least one road trip during 2025, up from 57% in 2023. Affluent households are joining the trend, lifting average daily rental rates without dampening volume. Road travelers seek self-contained mobility, which pushes more families toward motorized units equipped with onboard showers and Wi-Fi. Travel agencies report that nearly half of packaged vacations booked in mid-2025 revolve around drive-in itineraries, double the prior year. This continued adoption confirms a lasting shift toward independent travel that directly benefits the RV rental market.
Expansion of Peer-to-Peer (P2P) Rental Platforms
P2P networks have unlocked underused inventory. Outdoorsy alone surpassed USD 3 billion in lifetime bookings in 2024 and targets USD 8 billion by 2029. Host growth outpaces professional fleet additions, helping the RV rental market widen vehicle choice and geographic reach without heavy balance-sheet investment. Average P2P trip length rose to seven days, aided by delivery services that solve last-mile issues for urban renters. Platform insurance programs and 24/7 roadside support lower perceived risk for first-time users. Attractive unit economics keep price increases below hotel inflation, extending the value gap that fuels repeat bookings.
High Maintenance & Insurance Costs
Modern RVs carry complex batteries, slide-outs, and infotainment systems that drive repair bills higher. Skilled technicians remain scarce, pushing workshop labor rates past USD 160 per hour in top markets. Large fleets can negotiate multi-vehicle policies that small owners cannot match, widening cost disparities inside the RV rental market. Preventive programs and extended warranties help, yet they demand capital outlays that weigh on cash-flow-constrained operators.
Other drivers and restraints analyzed in the detailed report include:
- Rising Disposable Income Among Millennials & Gen-Z
- Telematics-Enabled Fleet Uptime Optimization
- Municipal Restrictions on Overnight RV Parking
For complete list of drivers and restraints, kindly check the Table Of Contents.
Segment Analysis
Fleet operators controlled 69.60% of 2025 revenue while individual owners delivered the fastest growth. Scale lets corporate fleets secure bulk purchasing discounts, centralized maintenance, and umbrella insurance. Consolidators pursue bolt-on acquisitions to extend regional coverage, yet competition watchdogs have blocked anticompetitive moves such as the Apollo Tourism-Tourism Holdings proposal in Australia. Compliance costs linked to zero-emission mandates favor well-capitalized fleets that can finance depot chargers and technician re-training.
Private owners thrive where P2P platforms provide turnkey booking, verification, and insurance. Many reach higher annual utilization by targeting local events and niche formats such as pet-friendly campervans. Platform-provided maintenance networks allow small owners to meet safety inspections without building infrastructure. These dynamics position individual hosts as agile complements rather than direct substitutes, ultimately enriching choice across the RV rental market.
Online channels captured 61.10% of 2025 rentals and compound at an 7.89% rate, reflecting a decisive digital shift. Real-time inventory, dynamic pricing, and integrated payments shorten the booking window from weeks to days. Younger renters rely on mobile apps for trip planning, pushing operators to offer 360-degree vehicle tours and AI chat support.
Offline bookings remain relevant for complex itineraries where first-time users seek advice on vehicle class, campground selection, and route safety. Operators increasingly integrate chat-to-store models: customers start online, then finalize terms through showroom visits or video calls. This hybrid approach preserves the trust advantage of personal service while scaling the reach of the RV rental market.
The RV Rental Market is Segmented by Rental Supplier Type (Private and Individual Owners and Fleet Operators), Booking Type (Offline Booking and Online Booking), Product Type (Motorized RVs and Towable RVs), Rental Duration (Short-Term, Mid-Term and Long-Term), and Geography (North America, South America, Europe, Asia-Pacific and Middle East and Africa). The Market Forecasts are Provided in Terms of Value (USD).
Geography Analysis
North America retained a 46.30% revenue share in 2025. The United States supplies an extensive campground grid, mature insurance products, and high disposable income that keep the rv rental market buoyant. California's Advanced Clean Trucks rule, already adopted by nine additional states, will require escalating zero-emission sales from 2025, creating upfront costs but long-term operating savings rvia.org. Canada benefits from expansive wilderness routes and tax incentives for domestic tourism, while Mexico shows early promise where highway upgrades and middle-class expansion widen addressable demand.
Asia-Pacific posts the fastest 11.18% CAGR through 2031. Japan leads with 165,000 registered campervans and over 500 certified RV parks as of 2024. China's car-rental ecosystem grows quickly on the back of domestic EV supply chains and new highway corridors. Australia remains a core backpacker circuit, though competition authorities oppose fleet mergers that could raise prices. India supplies a sizable pipeline of first-time travelers; supportive state tourism boards fund roadside amenities that lower entry barriers for the RV rental market.
Europe delivers steady growth as cross-border travel rules harmonize and low-emission zones expand. The Erwin Hymer Group captured 23.6% European market share in 2024 on USD 3.36 billion sales erwinhymergroup.com. Germany's autobahn network and dense dealer footprint foster high replacement demand, while France and Spain rely on coastal draws and established campsite cultures. Eastern EU members receive cohesion-funded road upgrades that gradually raise RV adoption rates. Electric-charging corridors from Norway to Italy enhance confidence in battery-powered motorhomes, positioning Europe as a test bed for zero-emission fleets.
- Cruise America
- Apollo Tourism & Leisure Ltd
- Outdoorsy, Inc.
- RVshare
- McRent
- Indie Campers
- RoadSurfer GmbH
- Camplify
- Yescapa
- El Monte RV
- Just Go Motorhome Hire
- Escape Campervans
- JUCY Rentals
- Spaceships Rentals
- Bunk Campers
Additional Benefits:
- The market estimate (ME) sheet in Excel format
- 3 months of analyst support
TABLE OF CONTENTS
1 Introduction
2 Research Methodology
3 Executive Summary
4 Market Landscape
- 4.1 Market Overview
- 4.2 Market Drivers
- 4.2.1 Surge in Domestic Road-Trip Tourism
- 4.2.2 Expansion of Peer-To-Peer (P2P) Rental Platforms
- 4.2.3 Rising Disposable Income Among Millennials & Gen-Z
- 4.2.4 Telematics-Enabled Fleet Uptime Optimisation
- 4.2.5 Corporate Use of Rvs As Mobile Pop-Up Spaces
- 4.2.6 Zero-Emission RV Incentives Accelerating Electrified Fleets
- 4.3 Market Restraints
- 4.3.1 High Maintenance and Insurance Costs
- 4.3.2 Seasonality-Driven Low Asset Utilisation
- 4.3.3 Municipal Restrictions On Overnight RV Parking
- 4.3.4 Spare-Part Supply Bottlenecks Delaying Turnaround
- 4.4 Value / Supply-Chain Analysis
- 4.5 Regulatory Landscape
- 4.6 Technological Outlook
- 4.7 Porter's Five Forces
- 4.7.1 Bargaining Power of Suppliers
- 4.7.2 Bargaining Power of Consumers
- 4.7.3 Threat of New Entrants
- 4.7.4 Threat of Substitute Products
- 4.7.5 Intensity of Competitive Rivalry
5 Market Size & Growth Forecasts (Value (USD))
- 5.1 By Rental Supplier Type
- 5.1.1 Private and Individual Owners
- 5.1.2 Fleet Operators
- 5.2 By Booking Type
- 5.2.1 Offline Booking
- 5.2.2 Online Booking
- 5.3 By Product Type
- 5.3.1 Motorized RVs
- 5.3.1.1 Class A Motorhomes
- 5.3.1.2 Class B Motorhomes
- 5.3.1.3 Class C Motorhomes
- 5.3.2 Towable RVs
- 5.3.2.1 Fifth-Wheel Trailers
- 5.3.2.2 Travel Trailers
- 5.3.2.3 Truck Campers
- 5.3.2.4 Sports Utility Trailers
- 5.3.1 Motorized RVs
- 5.4 By Rental Duration
- 5.4.1 Short-term (1-7 days)
- 5.4.2 Mid-term (8-30 days)
- 5.4.3 Long-term (More than 30 days)
- 5.5 By Geography
- 5.5.1 North America
- 5.5.1.1 United States
- 5.5.1.2 Canada
- 5.5.1.3 Rest of North America
- 5.5.2 South America
- 5.5.2.1 Brazil
- 5.5.2.2 Argentina
- 5.5.2.3 Rest of South America
- 5.5.3 Europe
- 5.5.3.1 Germany
- 5.5.3.2 United Kingdom
- 5.5.3.3 France
- 5.5.3.4 Spain
- 5.5.3.5 Italy
- 5.5.3.6 Russia
- 5.5.3.7 Rest of Europe
- 5.5.4 Asia-Pacific
- 5.5.4.1 China
- 5.5.4.2 India
- 5.5.4.3 Japan
- 5.5.4.4 South Korea
- 5.5.4.5 Australia
- 5.5.4.6 Rest of Asia-Pacific
- 5.5.5 Middle East and Africa
- 5.5.5.1 United Arab Emirates
- 5.5.5.2 Saudi Arabia
- 5.5.5.3 Turkey
- 5.5.5.4 South Africa
- 5.5.5.5 Rest of Middle East and Africa
- 5.5.1 North America
6 Competitive Landscape
- 6.1 Market Concentration
- 6.2 Strategic Moves
- 6.3 Market Share Analysis
- 6.4 Company Profiles (Includes Global Level Overview, Market Level Overview, Core Segments, Financials as Available, Strategic Information, Market Rank/Share for Key Companies, Products and Services, SWOT Analysis, and Recent Developments)
- 6.4.1 Cruise America
- 6.4.2 Apollo Tourism & Leisure Ltd
- 6.4.3 Outdoorsy, Inc.
- 6.4.4 RVshare
- 6.4.5 McRent
- 6.4.6 Indie Campers
- 6.4.7 RoadSurfer GmbH
- 6.4.8 Camplify
- 6.4.9 Yescapa
- 6.4.10 El Monte RV
- 6.4.11 Just Go Motorhome Hire
- 6.4.12 Escape Campervans
- 6.4.13 JUCY Rentals
- 6.4.14 Spaceships Rentals
- 6.4.15 Bunk Campers


