


 |
市场调查报告书
商品编码
1910557
企业网路设备:市场占有率分析、产业趋势与统计、成长预测(2026-2031)Enterprise Network Equipment - Market Share Analysis, Industry Trends & Statistics, Growth Forecasts (2026 - 2031) |
||||||
※ 本网页内容可能与最新版本有所差异。详细情况请与我们联繫。
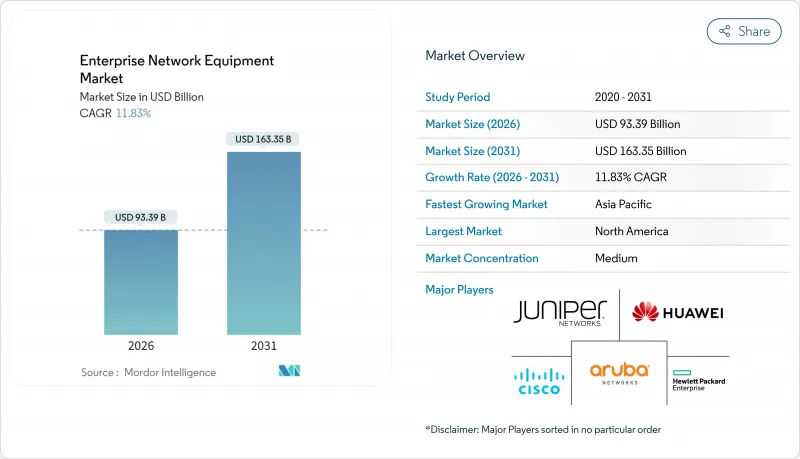
预计到 2025 年,企业网路设备市场规模将达到 835.1 亿美元,从 2026 年的 933.9 亿美元成长到 2031 年的 1,633.5 亿美元。
预计在预测期(2026-2031 年)内,复合年增长率将达到 11.83%。
企业正从依赖传统硬体转向采用人工智慧优化、云端管理的基础设施,这种基础设施强调软体定义控制、频宽可扩展性和自动化运营,而推动这一成长的正是这种趋势。资料中心对 400G 和 800G 交换器的强劲需求、园区网路迫切需要升级到 Wi-Fi 7,以及分店对 SD-WAN 的日益普及,都进一步推动了支出成长。高速光收发器的供应链限制导致库存紧张,使垂直整合的供应商获得了价格优势。同时,永续性计画正在推动低功耗晶片的发展,在五年周期内将整体拥有成本降低 15-20%。平台供应商正在加速将交换、安全和人工智慧分析整合到统一的协定堆迭中,从而推动了产业整合。
全球企业网路设备市场趋势与洞察
物联网和边缘运算推动了频宽需求的激增。
边缘架构将处理环节移至更靠近资料来源的位置,增加了传统园区网路无法承受的流量负载。工业IoT站点传输Terabyte的感测器讯息,需要25G或100G的上行链路,且不能出现延迟。思科2025财年的财务预测显示,其边缘网路部门的营收将成长34%,主要得益于製造业和物流业的预测性维修计划。整合的专用5G和Wi-Fi网路将提高混合设备的密度,电脑视觉工作负载的频宽将比以往增加10到15倍,因此需要采用东西向而非南北向的流量设计。
快速将企业范围内的网路升级到 Wi-Fi 7 园区区域网
在无线速度驱动生产力指标的时代,Wi-Fi 7 加速了装置更新换代週期。 IEEE 802.11be 标准在 320 MHz 频道上可达到 46 Gbps 的传输速度,使企业能够以可靠的无线连结取代有线桌面。 Arista 报告称,2025 年第一季园区交换器业务将成长 27.6%,其中 60% 的成长与 Wi-Fi 7回程传输和 PoE 升级相关。高密度场所(例如会议区)受益于确定性延迟,从而支持製造业和医疗培训中的扩增实境 (AR) 应用。
高成本的维护成本和合规性主导的安全成本
HIPAA、PCI DSS 4.0 和新的人工智慧法规要求持续监控、资料分段和审核日誌记录,导致营运成本占 IT 预算的 20% 至 30%。金融公司正在实施零信任架构,这需要专用设备和专业服务,其生命週期成本甚至超过了初始硬体成本。
细分市场分析
2025年,交换器将占企业网路设备市场41.12%的份额,凸显其在园区网路和资料中心拓朴结构中的核心地位。随着人工智慧工作负载的成长,对400G和800G网路架构线速无阻塞效能的需求日益增长,预计交换器的企业网路设备市场也将随之扩大。无线区域网路将维持其最快成长速度,复合年增长率将达到13.45%,这主要得益于Wi-Fi 7在办公室、医疗和教育环境中实现的高密度、低延迟移动性。路由器在SD-WAN领域仍将扮演重要角色,而网路安全设备则因微隔离和行为分析技术的进步而日益普及。
园区现代化改造将整合 PoE 升级和新型多Gigabit布线,以支援电力消耗量的Wi-Fi 7网路基地台。接入控制器将采用云端控制面板,实现频道分配和威胁防御的自动化。边缘交换器将整合时间敏感网路 (TSN) 技术,以承载工业IoT)流量。供应商将增强 ASIC 遥测功能,使 IT 团队能够了解缓衝区使用情况,这对于控制 AI 推理中的抖动至关重要。
2025年,受金融和政府机构采购部门资料主权法规的推动,本地部署方案将贡献51.05%的收入。然而,随着企业优先考虑基于营运支出(OPEX)的订阅模式和快速部署,云端管理解决方案的采用率将继续以13.32%的复合年增长率成长。随着中小企业采用透过多租户入口网站管理的即插即用型Wi-Fi和SD-WAN解决方案,云端管理平台预计将在企业网路设备市场占据越来越大的份额。
受监管行业正日益青睐混合控制方案,该方案将策略引擎保留在本地,同时将分析资料传送到云端。 API优先的设计使DevOps团队能够将网路工作流程整合到CI/CD管道中。付费使用制可以平滑现金流,并降低分店扩张的门槛。供应商正透过人工智慧引擎来脱颖而出,这些引擎可以预测故障并提出无需人工提交工单的修復措施提案。
区域分析
北美地区预计到2025年将维持37.85%的营收份额,这主要得益于人工智慧架构的早期应用以及大型超大规模资料中心面积的扩张。金融和医疗保健产业的监管正在推动零信任架构和园区Wi-Fi 7部署的快速现代化。该地区的企业网路设备市场规模受益于强劲的资本预算和完善的合作伙伴生态系统。
到2031年,亚太地区将以13.54%的复合年增长率保持在最高水准。中国5G私有化进程的推进以及日本「社会5.0」策略下的数位化,正在推动无线和边缘设备的订单。中国的在地采购政策有利于国内交换器供应商,从而导致厂商市场占有率的重组。印度的云端运算蓬勃发展,也带动了中小企业对云端管理SD-WAN和Wi-Fi的需求。
欧洲将基于GDPR合规性、数位主权和绿色技术指令保持稳定成长。德国的工业4.0计画将推动确定性乙太网路的普及,而北欧的永续性法规则则有利于低功耗硅晶片的发展。在中东和非洲,智慧城市建设资金将用于建设光纤骨干网路和都市区Wi-Fi,但宏观经济波动将限制支出。南美洲将投资5G回程传输和市政宽频,但汇率波动将影响合约签订时间。
其他福利:
- Excel格式的市场预测(ME)表
- 分析师支持(3个月)
目录
第一章 引言
- 研究假设和市场定义
- 调查范围
第二章调查方法
第三章执行摘要
第四章 市场情势
- 市场概览
- 市场驱动因素
- 物联网和边缘运算推动了频宽需求的激增。
- 快速将企业范围内的网路升级到 Wi-Fi 7 园区区域网
- 云端管理网路和SD-WAN的采用
- 政府主导的智慧城市基础建设
- 人工智慧主导企业资料中心对 400/800G 交换器的需求
- 永续性,推动了低功耗开关硅的发展。
- 市场限制
- 高昂的维护和合规安全成本
- 半导体供应链持续受阻
- 熟练的软体定义网路 (SDN) 工程师短缺
- 疫情期间库存过剩导致产品更新週期延迟
- 产业价值链分析
- 宏观经济因素的影响
- 监管环境
- 技术展望
- 波特五力分析
- 供应商的议价能力
- 消费者议价能力
- 新进入者的威胁
- 替代品的威胁
- 竞争对手之间的竞争
第五章 市场规模与成长预测
- 按类型
- 转变
- 路由器
- WLAN
- 网路安全
- 网路基地台和控制器
- 按部署模式
- 本地部署
- 云端管理
- 杂交种
- 按公司规模
- 小型企业
- 大公司
- 按最终用户行业划分
- 资讯科技和电信
- BFSI
- 卫生保健
- 製造业
- 政府
- 零售与电子商务
- 其他终端用户产业
- 按地区
- 北美洲
- 美国
- 加拿大
- 墨西哥
- 南美洲
- 巴西
- 阿根廷
- 智利
- 南美洲其他地区
- 欧洲
- 德国
- 英国
- 法国
- 义大利
- 西班牙
- 其他欧洲地区
- 亚太地区
- 中国
- 日本
- 韩国
- 印度
- 新加坡
- 澳洲
- 亚太其他地区
- 中东和非洲
- 中东
- 沙乌地阿拉伯
- 阿拉伯聯合大公国
- 土耳其
- 其他中东地区
- 非洲
- 南非
- 奈及利亚
- 埃及
- 其他非洲地区
- 中东
- 北美洲
第六章 竞争情势
- 市场集中度
- 策略趋势
- 市占率分析
- 公司简介
- Cisco Systems Inc.
- Huawei Technologies Co. Ltd.
- Hewlett Packard Enterprise Company
- Aruba Networks LLC
- Juniper Networks Inc.
- Arista Networks Inc.
- Extreme Networks Inc.
- Dell Technologies Inc.
- Broadcom Inc.
- Fortinet Inc.
- Palo Alto Networks Inc.
- Check Point Software Technologies Ltd.
- F5 Inc.
- VMware LLC
- New H3C Technologies Co. Ltd.
- Nokia Corporation
- ZTE Corporation
- Ubiquiti Inc.
- Alcatel-Lucent Enterprise
- NETSCOUT Systems Inc.
- A10 Networks Inc.
- TP-Link Technologies Co. Ltd.
第七章 市场机会与未来展望
The enterprise network equipment market was valued at USD 83.51 billion in 2025 and estimated to grow from USD 93.39 billion in 2026 to reach USD 163.35 billion by 2031, at a CAGR of 11.83% during the forecast period (2026-2031).
This expansion stems from enterprise migration toward AI-optimized, cloud-managed infrastructure that favors software-defined control, bandwidth scalability, and automated operations over legacy hardware dependence. Strong demand for 400 G and 800 G switching inside data centers, urgent Wi-Fi 7 upgrades on campus networks, and rising SD-WAN roll-outs in branch sites all reinforce spending momentum. Supply-chain constraints for high-speed optical transceivers tighten inventory, giving vertically integrated vendors a pricing edge. In parallel, sustainability programs push low-power silicon that cuts the total cost of ownership by 15-20% during five-year cycles. Industry consolidation accelerates as platform vendors merge switching, security, and AI analytics into unified stacks.
Global Enterprise Network Equipment Market Trends and Insights
Surging Bandwidth Demand from IoT and Edge Computing
Edge architectures move processing close to data sources, multiplying traffic loads that older campus networks cannot support. Industrial IoT sites stream terabytes of sensor information that require 25 G or 100 G uplinks without latency penalties. Cisco's 2025 results showed 34% revenue growth in edge networking, fueled by manufacturing and logistics predictive-maintenance projects. Converged private 5G and Wi-Fi domains add hybrid device density, while computer-vision workloads consume 10-15 times traditional bandwidth, forcing east-west traffic design over north-south flows.
Rapid Enterprise-Wide Upgrades to Wi-Fi 7 Campus LANs
Wi-Fi 7 accelerates refresh cycles because wireless speed now drives productivity metrics. The IEEE 802.11be spec reaches 46 Gbps using 320 MHz channels, letting firms replace wired desktops with reliable wireless links. Arista recorded 27.6% campus switching growth in Q1 2025, with 60% tied to Wi-Fi 7 backhaul and PoE upgrades. High-density venues such as conference areas benefit from deterministic latency that supports AR in manufacturing and medical training.
High Maintenance and Compliance-Driven Security Costs
HIPAA, PCI DSS 4.0, and emerging AI laws force continuous monitoring, segmentation, and audit logging that raise operating expenses 20-30% of IT budgets. Financial firms deploy zero-trust overlays that need specialized appliances and expert services, lifting lifecycle costs above initial hardware spend.
Other drivers and restraints analyzed in the detailed report include:
- Cloud-Managed Networking and SD-WAN Adoption
- Government-Backed Smart-City Backbone Roll-Outs
- Ongoing Semiconductor Supply-Chain Constraints
For complete list of drivers and restraints, kindly check the Table Of Contents.
Segment Analysis
Switches captured 41.12% of the enterprise network equipment market in 2025, underscoring their centrality in campus and data-center topologies. The enterprise network equipment market size for switches is projected to rise with AI workloads that demand 400 G and 800 G fabrics offering line-rate, non-blocking performance. Wireless LAN remains the fastest mover at a 13.45% CAGR as Wi-Fi 7 enables high-density, low-latency mobility inside office, healthcare, and education environments. Routers maintain relevance in SD-WAN, while network-security appliances gain traction through micro-segmentation and behavior analytics.
Campus modernizations merge PoE upgrades with new multi-gigabit cabling to support power-hungry Wi-Fi 7 access points. Access controllers adopt cloud dashboards that automate channel assignment and threat mitigation. Edge switches integrate time-sensitive networking to carry industrial IoT traffic. Vendors enhance ASIC telemetry to give IT teams visibility down to buffer utilization, a capability vital for AI inference jitter control.
On-premises installations delivered 51.05% revenue in 2025, driven by data sovereignty rules among finance and government buyers. Still, cloud-managed adoption outpaces at 13.32% CAGR as organizations favor opex subscriptions and rapid rollout. The enterprise network equipment market share for cloud-managed platforms will widen as SMEs adopt plug-and-play Wi-Fi and SD-WAN solutions administered from multitenant portals.
Hybrid control gains fans in regulated industries that keep policy engines on-site while feeding analytics to the cloud. API-first design lets DevOps teams integrate network workflows into CI/CD pipelines. Consumption pricing smooths cash flows and lowers the barrier to branch expansion. Vendors differentiate through AI engines that predict faults and recommend remediation without manual ticketing.
The Enterprise Network Equipment Market Report is Segmented by Type (Switches, Routers, WLAN, and More), Deployment Model (On-Premises, Cloud-Managed, and Hybrid), Enterprise Size (Small and Medium Enterprises and Large Enterprises), End-User Vertical (IT and Telecom, BFSI, Healthcare, Manufacturing, and More), and Geography. The Market Forecasts are Provided in Terms of Value (USD).
Geography Analysis
North America retained 37.85% of 2025 revenue, fueled by early uptake of AI-centric fabrics and large hyperscale data-center footprints. Financial and healthcare regulations encourage rapid modernization with zero-trust overlays and campus Wi-Fi 7 adoption. The enterprise network equipment market size in the region benefits from strong capital budgets and a robust partner ecosystem.
Asia-Pacific shows the highest 13.54% CAGR through 2031. Chinese private 5G liberalization and Japanese digitization under Society 5.0 boost orders for wireless and edge equipment. Local procurement guidelines in China favor domestic switching suppliers, reshaping vendor share. India's cloud boom magnifies SME demand for cloud-managed SD-WAN and Wi-Fi.
Europe posts steady growth anchored in GDPR compliance, digital sovereignty, and green-tech directives. German Industry 4.0 programs drive deterministic Ethernet adoption, while Nordic sustainability rules reward low-power silicon. Middle East and Africa secure smart-city funding that installs fiber backbones and metro Wi-Fi, though macro volatility tempers spending. South America invests in 5G backhaul and municipal broadband, but currency fluctuations influence deal timing.
- Cisco Systems Inc.
- Huawei Technologies Co. Ltd.
- Hewlett Packard Enterprise Company
- Aruba Networks LLC
- Juniper Networks Inc.
- Arista Networks Inc.
- Extreme Networks Inc.
- Dell Technologies Inc.
- Broadcom Inc.
- Fortinet Inc.
- Palo Alto Networks Inc.
- Check Point Software Technologies Ltd.
- F5 Inc.
- VMware LLC
- New H3C Technologies Co. Ltd.
- Nokia Corporation
- ZTE Corporation
- Ubiquiti Inc.
- Alcatel-Lucent Enterprise
- NETSCOUT Systems Inc.
- A10 Networks Inc.
- TP-Link Technologies Co. Ltd.
Additional Benefits:
- The market estimate (ME) sheet in Excel format
- 3 months of analyst support
TABLE OF CONTENTS
1 INTRODUCTION
- 1.1 Study Assumptions and Market Definition
- 1.2 Scope of the Study
2 RESEARCH METHODOLOGY
3 EXECUTIVE SUMMARY
4 MARKET LANDSCAPE
- 4.1 Market Overview
- 4.2 Market Drivers
- 4.2.1 Surging bandwidth demand from IoT and edge computing
- 4.2.2 Rapid enterprise-wide upgrades to Wi-Fi 7 campus LANs
- 4.2.3 Cloud-managed networking and SD-WAN adoption
- 4.2.4 Government-backed smart-city backbone roll-outs
- 4.2.5 AI-driven need for 400/800 G switches in enterprise data centers
- 4.2.6 Sustainability mandates pushing low-power switching silicon
- 4.3 Market Restraints
- 4.3.1 High maintenance and compliance-driven security costs
- 4.3.2 Ongoing semiconductor supply-chain constraints
- 4.3.3 Shortage of skilled engineers for software-defined networks
- 4.3.4 Pandemic-era inventory overhang delaying refresh cycles
- 4.4 Industry Value Chain Analysis
- 4.5 Impact of Macroeconomic Factors
- 4.6 Regulatory Landscape
- 4.7 Technological Outlook
- 4.8 Porter's Five Forces Analysis
- 4.8.1 Bargaining Power of Suppliers
- 4.8.2 Bargaining Power of Consumers
- 4.8.3 Threat of New Entrants
- 4.8.4 Threat of Substitutes
- 4.8.5 Intensity of Competitive Rivalry
5 MARKET SIZE AND GROWTH FORECASTS (VALUES)
- 5.1 By Type
- 5.1.1 Switches
- 5.1.2 Routers
- 5.1.3 WLAN
- 5.1.4 Network Security
- 5.1.5 Access Points and Controllers
- 5.2 By Deployment Model
- 5.2.1 On-Premises
- 5.2.2 Cloud-Managed
- 5.2.3 Hybrid
- 5.3 By Enterprise Size
- 5.3.1 Small and Medium Enterprises
- 5.3.2 Large Enterprises
- 5.4 By End-User Vertical
- 5.4.1 IT and Telecom
- 5.4.2 BFSI
- 5.4.3 Healthcare
- 5.4.4 Manufacturing
- 5.4.5 Government
- 5.4.6 Retail and E-commerce
- 5.4.7 Other End-User Verticals
- 5.5 By Geography
- 5.5.1 North America
- 5.5.1.1 United States
- 5.5.1.2 Canada
- 5.5.1.3 Mexico
- 5.5.2 South America
- 5.5.2.1 Brazil
- 5.5.2.2 Argentina
- 5.5.2.3 Chile
- 5.5.2.4 Rest of South America
- 5.5.3 Europe
- 5.5.3.1 Germany
- 5.5.3.2 United Kingdom
- 5.5.3.3 France
- 5.5.3.4 Italy
- 5.5.3.5 Spain
- 5.5.3.6 Rest of Europe
- 5.5.4 Asia-Pacific
- 5.5.4.1 China
- 5.5.4.2 Japan
- 5.5.4.3 South Korea
- 5.5.4.4 India
- 5.5.4.5 Singapore
- 5.5.4.6 Australia
- 5.5.4.7 Rest of Asia-Pacific
- 5.5.5 Middle East and Africa
- 5.5.5.1 Middle East
- 5.5.5.1.1 Saudi Arabia
- 5.5.5.1.2 United Arab Emirates
- 5.5.5.1.3 Turkey
- 5.5.5.1.4 Rest of Middle East
- 5.5.5.2 Africa
- 5.5.5.2.1 South Africa
- 5.5.5.2.2 Nigeria
- 5.5.5.2.3 Egypt
- 5.5.5.2.4 Rest of Africa
- 5.5.5.1 Middle East
- 5.5.1 North America
6 COMPETITIVE LANDSCAPE
- 6.1 Market Concentration
- 6.2 Strategic Moves
- 6.3 Market Share Analysis
- 6.4 Company Profiles (includes Global level Overview, Market level overview, Core Segments, Financials as available, Strategic Information, Market Rank/Share for key companies, Products and Services, and Recent Developments)
- 6.4.1 Cisco Systems Inc.
- 6.4.2 Huawei Technologies Co. Ltd.
- 6.4.3 Hewlett Packard Enterprise Company
- 6.4.4 Aruba Networks LLC
- 6.4.5 Juniper Networks Inc.
- 6.4.6 Arista Networks Inc.
- 6.4.7 Extreme Networks Inc.
- 6.4.8 Dell Technologies Inc.
- 6.4.9 Broadcom Inc.
- 6.4.10 Fortinet Inc.
- 6.4.11 Palo Alto Networks Inc.
- 6.4.12 Check Point Software Technologies Ltd.
- 6.4.13 F5 Inc.
- 6.4.14 VMware LLC
- 6.4.15 New H3C Technologies Co. Ltd.
- 6.4.16 Nokia Corporation
- 6.4.17 ZTE Corporation
- 6.4.18 Ubiquiti Inc.
- 6.4.19 Alcatel-Lucent Enterprise
- 6.4.20 NETSCOUT Systems Inc.
- 6.4.21 A10 Networks Inc.
- 6.4.22 TP-Link Technologies Co. Ltd.
7 MARKET OPPORTUNITIES AND FUTURE OUTLOOK
- 7.1 White-space and Unmet-need Assessment
