


 |
市场调查报告书
商品编码
1910672
纸杯产业:市场占有率分析、产业趋势与统计、成长预测(2026-2031)Paper Cups Industry - Market Share Analysis, Industry Trends & Statistics, Growth Forecasts (2026 - 2031) |
||||||
※ 本网页内容可能与最新版本有所差异。详细情况请与我们联繫。
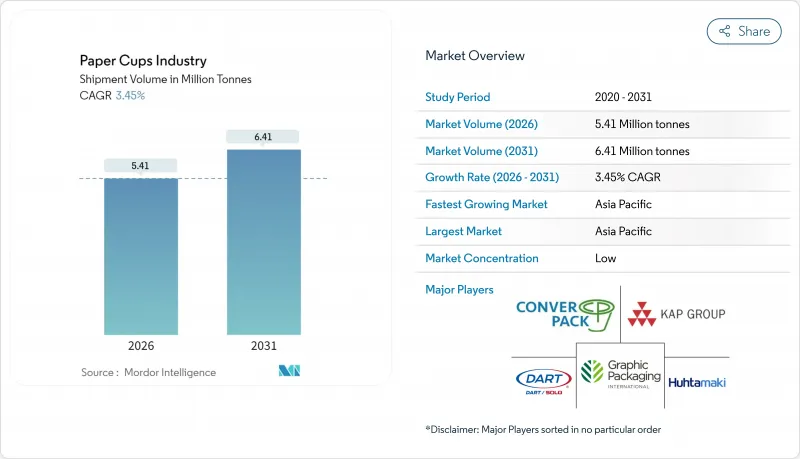
预计到2026年,纸杯产业市场规模将达到541万吨,较2025年的523万吨持续成长。预计到2031年,市场规模将达到641万吨,2026年至2031年的复合年增长率为3.45%。
纸杯市场的稳定扩张反映了纤维基包装面临的监管压力、水性及矿物基涂层技术的快速发展,以及餐饮品牌对易于回收包装形式的日益青睐。消费者行为的改变、外带饮料需求的增长、快餐店的扩张以及高速模塑生产线的技术进步,都在推动纸杯销量的增长;而成熟经济体的优质化则推动了单价的提升。受都市化和外送市场成长的驱动,亚太地区将在2024年成为全球领先的纸杯生产地区,市占率将达到39.56%。同时,北美和欧洲市场正转向使用低PFAS含量的全可回收热饮杯,这类产品利润率更高。市场竞争依然温和,现有企业凭藉着规模经济、垂直整合和研发投入,在新兴的、专注于满足特定永续性需求的特种加工商领先。
全球纸杯产业趋势与洞察
外出饮用饮料的需求不断成长
移动生活方式的兴起增加了人们对日常外带饮品的需求,纸杯也因此成为外带饮品的标准包装。都市区通勤者需要防漏纸杯,以符合公共运输礼仪;而弹性的工作时间也促使人们在午休时间购买咖啡。预计到2024年,美国外送市场规模将达到1.22兆美元,年增长率达8.29%,这表明数位平台如何将应用程式订餐与纸杯需求的成长联繫起来。在东南亚和中东地区扩张的特色咖啡馆正在推出高端纸杯设计,这些设计能够更好地保留咖啡油脂,并方便清晰地印刷品牌标誌。会员应用程式鼓励小额消费,在不增加新客户流量的情况下增加了包装消费量。这些趋势正在推动各地对纸杯持续、高频的需求,与零售商追求便利服务的概念相辅相成。
政府对一次性塑胶製品的限制
立法者正逐步淘汰一次性塑胶製品,转而采用高成本更高、用途更有限的替代方案,从而推动向纤维材料的系统性转变。欧盟《包装及包装废弃物条例》于2024年3月最终定稿,该条例强制要求包装完全可回收,并设定了到2030年将废弃物减少5%的目标。南澳将于2024年9月起禁止使用塑胶饮料容器,将立即刺激对纤维杯替代品的需求。苏格兰计划在2025年底前对每个一次性饮料杯附加税25便士的税,鼓励零售商参与循环利用,同时将纸杯定位为成本最低的一次性替代品。这些立法措施形成了一个可预测的替代循环,使加工商能够合理地调整对新模塑生产线的资本投资。
废弃物处理和回收基础设施的问题
许多市政系统仍然缺乏分离纸杯纤维和涂层的设备,这意味着许多技术上可回收的纸杯最终都被掩埋。开发中国家有限的资源回收预算阻碍了纸杯分类系统的实施。欧盟的循环经济规则加强了对废弃物处理途径的审查,企业买家现在要求在签订合约前提供当地纸杯回收的证明。在基础设施完善之前,纸杯行业面临声誉风险,这可能会导致需求转向小众咖啡馆和机构中可重复使用的试点计画。
细分市场分析
预计到2025年,保温杯将占据44.92%的市场份额,并在2031年之前以5.24%的复合年增长率增长。纸杯产业受益于全球专门食品咖啡店的兴起,这些咖啡店需要高隔热性能和醒目的杯身图案来讲述品牌故事。优质的阻隔涂层和双层壁结构使连锁店能够合理地提高定价。冷饮杯在冰茶、汽水和冰沙市场保持着一定的市场份额,但由于轻质PET杯的持续竞争,其在气候温暖地区的成长速度有所放缓。锥形杯和特殊设计的杯子在活动餐饮领域占据了一个细分市场,在这个领域,差异化比销量更为重要。星巴克转向矿物涂层表明,热饮杯仍然是研发投资和利润率的基础。冷饮杯的创新主要集中在无吸管杯盖和纤维基油墨上,但由于对隔热性能的需求较低,其单价仍然较低。
热饮杯的主导地位也体现在区域气候特征和饮用习惯。在北欧和北美,较长的凉爽季节维持了人们对热饮的日常需求。虽然亚太地区的特大城市对冰饮的需求不断增长,但热茶的基准消费量仍然足够高,足以支撑均衡的产品系列。纸杯产业正在透过提供可切换冷热版本的模组化复合生产线来适应这一变化,从而确保全年产能运转率。专业烘焙商要求供应商降低最低订购量,以适应频繁的设计变更,而只有先进的加工商才能满足这种服务水准。这种客户趋势透过有利于整合设计、成型和物流的大型企业,限制了市场碎片化。
到2025年,双层杯将占据47.10%的市场份额,其优越的触感和保温性能备受青睐。在连锁咖啡馆中,双层杯也像征着奢华的触感。然而,单层杯预计将以5.78%的复合年增长率成长至2031年,成为成长最快的产品。这一成长加速主要得益于价格敏感型市场中降低成本的目标,以及能够在不影响性能的前提下实现更薄杯壁的涂层技术。含有微气孔的水性内衬确保了单层杯具有足够的耐热性,使快餐店经营者能够以更少的杯壁满足顾客的需求。三层杯目前仍属于小众市场,主要用于盛装沸汤的工业食堂。
电子商务包装政策的改变——强调轻量化以减少运输排放——也推动了单层层级构造。直接面向消费者的咖啡烘焙商,尤其是那些提供盒装饮品套装的商家,更倾向于使用符合严格碳排放标准的纤细纸杯。在生产製造方面,加工商正在优化层级构造纸杯的成型工艺,并提高生产线速度。然而,双层纸杯在高利润市场仍占有一席之地。拥有强大品牌资产的连锁店将较厚的纸杯作为感官体验的一部分。这导致纸杯市场的产品组合呈现两极化:单层纸杯被广泛应用于价格亲民的大众市场,而双层纸杯则被用于盈利更高的核心产品。
本纸杯市场报告按杯型(例如,热饮纸杯、冷饮纸杯)、壁厚结构(例如,单层、双层、三层)、容量(例如,4-8盎司、9-12盎司)、终端用户(例如,快餐店、咖啡连锁店和自动售货机运营商)、分销渠道(例如,直接B2B合约)和地区进行分析。市场预测以百万吨为单位。
区域分析
预计到2025年,亚太地区将占全球纸杯产量的39.10%,并在2031年之前以6.55%的复合年增长率成长,成为所有地区中成长最快的地区。中国造纸业在2024年将国内产能提高了10%,确保了2025年纸杯加工基材的稳定供应。预计到2025年,印度包装市场规模将达到2,048.1亿美元,复合年增长率高达26.7%,进一步深化了外带杯的终端市场需求。越南包装市场正以9.73%的年增长率成长,展现出强大的製造竞争力,并支撑着纸杯在东协地区的出口。可支配收入的成长和品牌咖啡文化的兴起正在推动区域需求,使亚太地区成为纸杯行业成长的关键驱动力。
北美市场已趋于成熟,但技术仍在不断进步。美国食品药物管理局(FDA) 计画于 2025 年 2 月逐步淘汰全氟合成化合物 (PFAS),这推动了水性及矿物基阻隔涂料的普及。乔治亚-太平洋公司于 2024 年投资 20 亿美元,用于其在美国的七家工厂,以保持生产柔软性并实现永续性目标。现代化的回收系统和企业 ESG 报告推动了高级产品的推出,加工商之间的竞争也从单纯的价格战转向了产品报废认证。儘管销量成长较为温和,但纤维封口等增值特性正在提升利润率。
欧洲正走在以监管为先的道路上。到2030年,强制性回收措施将稳步推动塑胶包装被纸杯取代。 2024年10月,Huhtamäki公司扩大了在北爱尔兰的纤维杯盖产能,以满足当地对无塑胶组件的需求。该地区已采取按杯收费和税收优惠政策,鼓励消费者使用可重复使用的产品,但纤维杯仍被视为符合规定的一次性用品。东欧市场的成长机会主要得益于速食店(QSR)的日益普及,弥补了西欧市场规模趋于成熟的不足。
中东、非洲和南美洲是新兴的机会地区。基础设施不足和经济波动限制了其即时规模扩张,但外送应用和国际咖啡连锁店已率先站稳脚跟。加工商正与当地造纸厂成立合资企业,以实现供应本地化并降低外汇风险和进口关税。儘管它们目前对纸杯市场规模的贡献仍然有限,但长期的人口趋势预计将推动其产量逐步成长。
其他福利:
- Excel格式的市场预测(ME)表
- 3个月的分析师支持
目录
第一章 引言
- 研究假设和市场定义
- 调查范围
第二章调查方法
第三章执行摘要
第四章 市场情势
- 市场概览
- 市场驱动因素
- 外出饮用饮料的需求不断成长
- 政府禁止使用一次性塑胶製品
- 拓展快餐店 (QSR) 与食品配送生态系统
- 推出采用水性涂层的全可回收热饮杯
- 零浪费体育场馆和活动采购指示
- 透过人工智慧驱动的高速成型线降低成本
- 市场限制
- 缺乏废弃物处理和回收基础设施
- 纸浆价格波动对利润率带来压力
- 咖啡连锁店试行引进可重复使用杯子循环系统
- PFAS淘汰计划延期、重新设计和认证
- 供应链分析
- 监管环境
- 技术展望
- 波特五力分析
- 供应商的议价能力
- 买方的议价能力
- 新进入者的威胁
- 替代品的威胁
- 竞争对手之间的竞争
第五章 市场规模与成长预测
- 按杯子类型
- 热纸杯
- 冷纸杯
- 甜筒和专门食品杯
- 依墙体类型
- 单层墙体
- 双层壁
- 三层壁
- 按体积(盎司)
- 4-8
- 9-12
- 13-20
- >20
- 最终用户
- 速食店(QSR)
- 咖啡连锁店和自动贩卖机营运商
- 企业餐饮
- 航空公司和铁路公司
- 其他的
- 透过分销管道
- 直接(B2B合约)
- 分销商和批发商
- 线上B2B市场
- 按地区
- 北美洲
- 美国
- 加拿大
- 墨西哥
- 欧洲
- 德国
- 英国
- 法国
- 义大利
- 西班牙
- 俄罗斯
- 其他欧洲地区
- 亚太地区
- 中国
- 印度
- 日本
- 韩国
- 澳洲和纽西兰
- 亚太其他地区
- 中东和非洲
- 中东
- 阿拉伯聯合大公国
- 沙乌地阿拉伯
- 土耳其
- 其他中东地区
- 非洲
- 南非
- 奈及利亚
- 埃及
- 其他非洲地区
- 中东
- 南美洲
- 巴西
- 阿根廷
- 南美洲其他地区
- 北美洲
第六章 竞争情势
- 市场集中度
- 策略趋势
- 市占率分析
- 公司简介
- Huhtamaki Oyj
- Dart Container Corp.
- Graphic Packaging International
- Georgia-Pacific LLC
- Seda International Packaging
- Kap Cones Pvt Ltd
- ConverPack Inc.
- Go-Pak UK Ltd(SCGP)
- Benders Paper Cups
- Hotpack Global
- Tekni-Plex Inc.
- CEE Schisler Packaging
- International Paper Foodservice
- Stora Enso Food-Service Boards
- Lollicup USA(Karat)
- Detmold Group
- F-Bender & Co.
- Nissin Paper Products
- Reynolds Consumer Products
- Pactiv Evergreen
第七章 市场机会与未来展望
Paper Cups Industry market size in 2026 is estimated at 5.41 Million tonnes, growing from 2025 value of 5.23 Million tonnes with 2031 projections showing 6.41 Million tonnes, growing at 3.45% CAGR over 2026-2031.
This steady rise in the paper cups market size reflects a regulatory push toward fiber-based packaging, rapid upgrades in aqueous and mineral coatings, and the widening preference of food-service brands for easily recyclable formats. Shifts in consumer behavior toward take-away beverages, the roll-out of new QSR outlets, and technological advances in high-speed forming lines are widening volume demand, while premiumization in mature economies is lifting unit revenues. Asia-Pacific leads global tonnage with 39.56% share in 2024, propelled by urbanization and food-delivery growth, whereas North America and Europe are pivoting toward low-PFAS, fully recyclable hot-cup formats that command higher margins. Competitive intensity remains moderate; incumbents leverage scale, vertical integration, and R&D investment to stay ahead of emerging specialty converters that target niche sustainability needs.
Global Paper Cups Industry Trends and Insights
Rising Demand for On-the-Go Beverages
Mobile lifestyles are lifting daily takeaway beverage volumes, positioning paper cups as the default pack for transit-friendly drinks. Urban commuters seek spill-proof formats that fit public-transport etiquette, and flexible work patterns elevate mid-day coffee runs. The U.S. food-delivery market is on track to generate USD 1.22 trillion in 2024, growing at 8.29% annually, underscoring how digital platforms translate app orders into incremental cup lifts. Specialty cafes expanding in Southeast Asia and the Middle East are introducing premium cup specifications that keep crema intact and print branding crisp. Loyalty apps encourage micro-purchases, which compound packaging volumes without requiring new footfall. Across regions, the result is a consistent, high-frequency pull on the paper cups market that aligns with retailer ambitions for frictionless service.
Government Bans on Single-Use Plastics
Legislators are turning single-use plastics into a costlier, restricted option, forcing a systemic shift toward fiber formats. The EU Packaging and Packaging Waste Regulation finalized in March 2024 mandates full recyclability and sets a 5% waste-cut target by 2030. South Australia banned plastic beverage containers from September 2024, instantly channeling demand to fiber cup alternatives. Scotland intends to levy a 25-pence surcharge on each single-use beverage cup by end-2025, nudging retailers toward reusable loops while positioning paper cups as the least-cost single-use substitute. These legal levers create predictable replacement cycles that let converters rationalize capex in new forming lines.
Disposal and Recycling Infrastructure Gaps
Many municipal systems still lack the equipment to delaminate cup fiber from coatings, so collected cups often end in landfill despite technical recyclability. Developing economies face limited material-recovery budgets, hindering paper cup sorting adoption. EU circular-economy rules tighten scrutiny on end-of-life pathways, and corporate buyers now demand evidence of regional cup recovery before awarding contracts. Until infrastructure catches up, the paper cups industry contends with reputational questions that can shift volumes to reusable pilots in niche cafes and venues.
Other drivers and restraints analyzed in the detailed report include:
- Expansion of QSR and Food-Delivery Ecosystems
- Aqueous-Coated Fully-Recyclable Hot-Cup Launches
- Pulp-Price Volatility Squeezing Margins
For complete list of drivers and restraints, kindly check the Table Of Contents.
Segment Analysis
Hot cups represented 44.92% of 2025 volume, and the segment is projected to expand at a 5.24% CAGR through 2031. The paper cups industry benefits from a global surge in specialty coffee houses that require high heat retention and vivid on-cup graphics for brand storytelling. Premium barrier coatings and double-wall builds deliver both, letting chains justify higher ticket prices. Cold cups protect share in iced tea, soda, and smoothie channels, yet growth lags because competition from lightweight PET cups persists in warm climates. Cone and specialty designs occupy event catering niches where differentiation, not mass volume, rules. Starbucks' switch to mineral coatings underscores how hot cups anchor R&D investment and margin capture. Cold-cup innovation focuses on strawless lids and fiber inks, but without the thermal barrier imperative, unit values stay lower.
Hot-cup leadership also reflects regional weather patterns and beverage rituals. Northern Europe and North America experience extended cool seasons that sustain daily hot-drink demand. In APAC mega-cities, iced beverage upticks occur, but hot tea traditions keep baseline consumption high enough to support a balanced portfolio. The paper cups industry adapts by offering modular lamination lines that toggle between hot and cold specs, ensuring asset utilization year-round. Specialty roasters ask suppliers for smaller minimum order quantities with frequent artwork changeovers, a service level only advanced converters can accommodate. This client dynamic moderates fragmentation by favoring scale players that bundle design, forming, and logistics.
Double-wall cups held 47.10% share in 2025, preferred for superior hand comfort and heat insulation. They also serve as a tactile signal of premium positioning in chain cafes. Yet single-wall designs are forecast to grow fastest at 5.78% CAGR through 2031. This acceleration stems from cost-saving goals in price-sensitive markets and from coating technologies that allow thin walls without hurting performance. Aqueous liners with micro-air pockets give single-wall cups sufficient heat resistance, enabling QSR operators to downgrade wall count while meeting customer expectations. Triple-wall cups remain niche, used in industrial canteens where boiling-hot broths are common.
Shifts in e-commerce packaging policies-favoring lower-weight parcels to cut freight emissions-also help single-wall formats. Direct-to-consumer coffee roasters that ship boxed drink kits favor slim cups to fit tight carbon calculators. On factory floors, converters re-engineer forming cycles to align with single-wall geometry, increasing line speed. Still, double-wall cups keep a foothold in high-margin markets. Chains with strong brand equity treat the thicker feel as part of the sensory experience. The paper cups market thus offers a bifurcated product mix: single-wall for broad affordability and double-wall for revenue-rich flagships.
The Paper Cups Market Report is Segmented by Cup Type (Hot Paper Cups, Cold Paper Cups, and More), Wall Type (Single Wall, Double Wall, Triple Wall), Capacity (4-8 Oz, 9-12 Oz, and More), End User (Quick-Service Restaurants, Coffee Chains and Vending Operators, and More), Distribution Channel (Direct B2B Contracts, and More), and Geography. The Market Forecasts are Provided in Terms of Volume (Million Tonnes).
Geography Analysis
Asia-Pacific accounted for 39.10% of global tonnage in 2025 and is projected to grow at 6.55% CAGR to 2031, the highest among all regions. China's paper sector added 10% domestic capacity in 2024, ensuring ample substrate for cup converting in 2025. India's packaging market is expected to reach USD 204.81 billion by 2025, expanding at 26.7% CAGR, a scale that deepens end-market pull for cups in food delivery. Vietnam's packaging growth of 9.73% annually demonstrates manufacturing competitiveness that also feeds cup exports across ASEAN. Rising disposable incomes and a shift toward branded cafe culture underpin regional volume, making APAC the growth anchor of the paper cups industry.
North America remains a mature yet technologically progressive market. The PFAS phase-out finalized by the U.S. FDA in February 2025 is propelling adoption of aqueous and mineral barrier coatings. Georgia-Pacific invested USD 2 billion in seven U.S. facilities in 2024 to sustain production agility and comply with sustainability targets. Modern recycling systems and corporate ESG reporting encourage premium offerings, with converters competing on end-of-life certification rather than pure price. Unit growth is slower, but margins are stronger through value-added specs such as fiber lids.
Europe follows a regulation-first trajectory. Mandatory recyclability by 2030 ensures steady substitution away from plastic packaging to paper-based cups. Huhtamaki expanded fiber-lid capacity in Northern Ireland in October 2024 to meet regional demand for plastic-free components. The region adopts pay-per-cup or tax incentives to nudge consumers toward reusables but still positions fiber cups as the compliant single-use option. Eastern European growth pockets, driven by rising QSR penetration, help offset Western Europe's mature volumes.
The Middle East and Africa and South America constitute emerging opportunity zones. Infrastructure gaps and economic swings temper immediate scale, yet food-delivery apps and international coffee chains are planting early seeds. Converters form joint ventures with local paper mills to localize supply, mitigating currency risk and import tariffs. While their contribution to the paper cups market size is still modest, longer-term demographic trends suggest incremental tonnage upside.
- Huhtamaki Oyj
- Dart Container Corp.
- Graphic Packaging International
- Georgia-Pacific LLC
- Seda International Packaging
- Kap Cones Pvt Ltd
- ConverPack Inc.
- Go-Pak UK Ltd (SCGP)
- Benders Paper Cups
- Hotpack Global
- Tekni-Plex Inc.
- CEE Schisler Packaging
- International Paper Foodservice
- Stora Enso Food-Service Boards
- Lollicup USA (Karat)
- Detmold Group
- F-Bender & Co.
- Nissin Paper Products
- Reynolds Consumer Products
- Pactiv Evergreen
Additional Benefits:
- The market estimate (ME) sheet in Excel format
- 3 months of analyst support
TABLE OF CONTENTS
1 INTRODUCTION
- 1.1 Study Assumptions and Market Definition
- 1.2 Scope of the Study
2 RESEARCH METHODOLOGY
3 EXECUTIVE SUMMARY
4 MARKET LANDSCAPE
- 4.1 Market Overview
- 4.2 Market Drivers
- 4.2.1 Rising demand for on-the-go beverages
- 4.2.2 Government bans on single-use plastics
- 4.2.3 Expansion of QSR and food-delivery ecosystems
- 4.2.4 Aqueous-coated fully-recyclable hot-cup launches
- 4.2.5 Zero-waste stadium and event procurement mandates
- 4.2.6 AI-driven high-speed forming lines lowering cost
- 4.3 Market Restraints
- 4.3.1 Disposal and recycling infrastructure gaps
- 4.3.2 Pulp-price volatility squeezing margins
- 4.3.3 Reusable cup loop pilots in coffee chains
- 4.3.4 PFAS-phase-out redesign and certification delays
- 4.4 Supply-Chain Analysis
- 4.5 Regulatory Landscape
- 4.6 Technological Outlook
- 4.7 Porter's Five Forces Analysis
- 4.7.1 Bargaining Power of Suppliers
- 4.7.2 Bargaining Power of Buyers
- 4.7.3 Threat of New Entrants
- 4.7.4 Threat of Substitutes
- 4.7.5 Competitive Rivalry
5 MARKET SIZE AND GROWTH FORECASTS (VALUE)
- 5.1 By Cup Type
- 5.1.1 Hot Paper Cups
- 5.1.2 Cold Paper Cups
- 5.1.3 Cone and Specialty Cups
- 5.2 By Wall Type
- 5.2.1 Single Wall
- 5.2.2 Double Wall
- 5.2.3 Triple Wall
- 5.3 By Capacity (oz)
- 5.3.1 4-8
- 5.3.2 9-12
- 5.3.3 13-20
- 5.3.4 >20
- 5.4 By End User
- 5.4.1 Quick-Service Restaurants (QSR)
- 5.4.2 Coffee Chains and Vending Operators
- 5.4.3 Institutional Catering
- 5.4.4 Airlines and Railways
- 5.4.5 Others
- 5.5 By Distribution Channel
- 5.5.1 Direct (B2B Contracts)
- 5.5.2 Distributors and Wholesalers
- 5.5.3 Online B2B Marketplaces
- 5.6 By Geography
- 5.6.1 North America
- 5.6.1.1 United States
- 5.6.1.2 Canada
- 5.6.1.3 Mexico
- 5.6.2 Europe
- 5.6.2.1 Germany
- 5.6.2.2 United Kingdom
- 5.6.2.3 France
- 5.6.2.4 Italy
- 5.6.2.5 Spain
- 5.6.2.6 Russia
- 5.6.2.7 Rest of Europe
- 5.6.3 Asia-Pacific
- 5.6.3.1 China
- 5.6.3.2 India
- 5.6.3.3 Japan
- 5.6.3.4 South Korea
- 5.6.3.5 Australia and New Zealand
- 5.6.3.6 Rest of Asia-Pacific
- 5.6.4 Middle East and Africa
- 5.6.4.1 Middle East
- 5.6.4.1.1 United Arab Emirates
- 5.6.4.1.2 Saudi Arabia
- 5.6.4.1.3 Turkey
- 5.6.4.1.4 Rest of Middle East
- 5.6.4.2 Africa
- 5.6.4.2.1 South Africa
- 5.6.4.2.2 Nigeria
- 5.6.4.2.3 Egypt
- 5.6.4.2.4 Rest of Africa
- 5.6.4.1 Middle East
- 5.6.5 South America
- 5.6.5.1 Brazil
- 5.6.5.2 Argentina
- 5.6.5.3 Rest of South America
- 5.6.1 North America
6 COMPETITIVE LANDSCAPE
- 6.1 Market Concentration
- 6.2 Strategic Moves
- 6.3 Market Share Analysis
- 6.4 Company Profiles (includes Global level Overview, Market level overview, Core Segments, Financials as available, Strategic Information, Market Rank/Share for key companies, Products and Services, and Recent Developments)
- 6.4.1 Huhtamaki Oyj
- 6.4.2 Dart Container Corp.
- 6.4.3 Graphic Packaging International
- 6.4.4 Georgia-Pacific LLC
- 6.4.5 Seda International Packaging
- 6.4.6 Kap Cones Pvt Ltd
- 6.4.7 ConverPack Inc.
- 6.4.8 Go-Pak UK Ltd (SCGP)
- 6.4.9 Benders Paper Cups
- 6.4.10 Hotpack Global
- 6.4.11 Tekni-Plex Inc.
- 6.4.12 CEE Schisler Packaging
- 6.4.13 International Paper Foodservice
- 6.4.14 Stora Enso Food-Service Boards
- 6.4.15 Lollicup USA (Karat)
- 6.4.16 Detmold Group
- 6.4.17 F-Bender & Co.
- 6.4.18 Nissin Paper Products
- 6.4.19 Reynolds Consumer Products
- 6.4.20 Pactiv Evergreen
7 MARKET OPPORTUNITIES AND FUTURE OUTLOOK
- 7.1 White-space and Unmet-Need Assessment
 纸杯市场:2026-2032年全球市场预测(按材料、容量、壁体结构、应用、最终用户和销售管道划分)
 一次性餐盘市场分析及预测(至2035年):依类型、材质、应用、产品类型、最终用户、技术、功能、製程、部署类型及服务划分环保纸盘市场分析及预测(至2035年):类型、产品类型、材料类型、应用、最终用户、製造流程、技术、功能、安装类型、解决方案
 全球一次性餐盘市场规模、份额、趋势和成长分析报告(2026-2034年)
 中东和非洲纸杯市场-份额分析、产业趋势、统计和成长预测(2026-2031)
 日本纸杯市场规模、份额、趋势和预测:按杯型、壁型、应用、分销管道、最终用户和地区划分,2026-2034年
 纸杯市场规模、份额和成长分析(按杯型、终端用途产业、壁厚类型、杯容量、销售管道和地区划分)-2026-2033年产业预测
 全球自动贩卖杯市场纸杯市场:2025-2030年预测一次性盘子的全球市场