


 |
市场调查报告书
商品编码
1910691
液化石油气(LPG):市占率分析、产业趋势与统计、成长预测(2026-2031)Liquefied Petroleum Gas (LPG) - Market Share Analysis, Industry Trends & Statistics, Growth Forecasts (2026 - 2031) |
||||||
※ 本网页内容可能与最新版本有所差异。详细情况请与我们联繫。
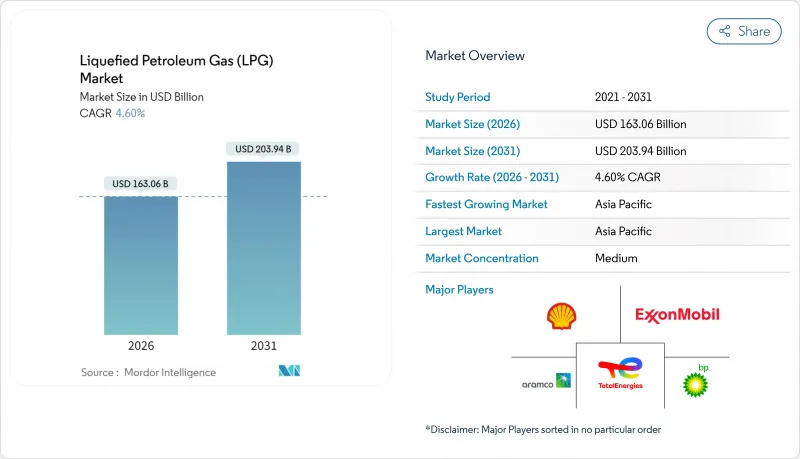
2025年液化石油气市场价值为1,558.9亿美元,预计到2031年将达到2,039.4亿美元,而2026年为1,630.6亿美元。
预计在预测期(2026-2031 年)内,复合年增长率将达到 4.60%。
亚洲石化原料的成长、印度和印尼大规模农村烹饪计画的发展,以及IMO-2020法规收紧后对高硫燃料替代品的持续需求,支撑了需求的韧性。随着卡达和阿联酋提高产量,以及北美生产商最大限度地提高页岩气产量,供应多样性正在扩大,但出口瓶颈导致价格频繁波动。生物液化石油气在欧盟脱碳法规的推动下发展势头强劲,印度、美国和西非的管道投资旨在降低物流成本和安全风险。因此,市场参与企业善于掌握一系列平衡的机会:稳定的家庭消费、不断增长的石化产品需求以及重视低碳分子的监管变化。
全球液化石油气(LPG)市场趋势与洞察
液化石油气炉灶计划扩大了无污染燃料的取得途径
印尼将5,000万户家庭从煤油转换为液化石油气,展现了快速扩充性,并为其他开发中国家树立了典范。印度的「总理乌贾瓦拉计画」(Pradhan Mantri Ujjawala Yojana)旨在2024年新增750万个液化石油气钢瓶连接,即便补贴合理化仍在继续,进口量仍将增加24%。西非各国政府目前正与世界银行的全球液化石油气伙伴伙伴关係(Global LPG Partnership)合作,复製这些发展模式。喀麦隆的目标是到2030年将其液化石油气普及率从12%提高到58%。鑑于农村电力供应持续不足,液化石油气与电炉灶相比仍然具有竞争力,尤其是在电网不稳定的地区。因此,持续的补贴目标明确化和末端配送创新是维持家庭普及的关键。
亚洲对石化原料需求的激增正在重塑贸易流量。
到2024年,中国的丙烷脱氢装置产能将达到每年2,260万吨,有助于稳定海运进口,儘管经济週期放缓。随后,印度投资80亿美元在巴迪纳尔建造了一座年产150万吨的乙烷裂解装置,确保了国内原料供应,并降低了对海外供应的依赖。随着关税下调改善套利经济效益,预计2025年美国对华乙烷出口将进一步成长9%至34%。里昂巴塞尔炼油装置关闭后,丙烯供需紧张,推动美国聚合级丙烯价格超过每磅0.40美元。亚洲总投资超过160亿美元的管道和储存基础设施预计将透过吸收区域需求波动,在支撑液化石油气市场长期成长方面发挥关键作用。
美国出口限制导致价格波动
2024年,美国沿岸地区的码头运转率接近100%,蒙特贝尔维尤港的运费溢价一度上涨至每加仑32.5美分,但随着过剩丙烷流入仓储设施,溢价随后回落。 Enterprise公司在休士顿的日产能30万桶扩建工程要到2026年底才能建成,而ONEOK-MPLX公司在德克萨斯城的日产能40万桶计划则要到2028年才能完工,这暂时造成了供给能力短缺。在美国日产量213万桶的丙烷中,70%用于出口,套利机会的消失可能导致库存迅速增加和价格波动。中国作为最大的买家,加剧了地缘政治风险。新一轮的关税争端可能迫使亚洲进口商转向价格更高的中东货物。波动性加剧,促使纸面避险工具的使用量增加,2024 年乙烷-丙烷衍生交易量激增 43% 便证明了这一点。
细分市场分析
受北美页岩气和联产气计划带来的低边际成本推动,液态天然气(NGL)预计在2025年将占据液化石油气(LPG)市场60.45%的份额。卡达北部气田的扩建将使该国的LPG产量从2024年的1,070万吨增加到2030年的1,760万吨。同时,阿布达比国家石油公司(ADNOC)天然气公司的三个项目将在同一时期新增250万吨产量,从而增强区域供应安全。由于印度和中国的炼油厂转向石化产品并减少燃料调和组分的运转率,炼厂衍生的LPG面临压力。虽然生物LPG市场规模仍然小规模,但随着欧盟法规和政府奖励释放新的产能,预计到2025年,其复合年增长率将达到14.58%。此细分市场具有即插即用的优势,且生命週期排放最多可减少90%,这使得供应商能够在企业净零排放采购合约中获得溢价。然而,原料供应不足以及可再生柴油的竞争限制了近期扩张,而传统液化石油气的过剩,尤其是在北美,降低了绿色溢价。
不同地区的采用路径各不相同。欧洲主要采用以废弃食用油和废弃物为原料的加氢处理植物油(HVO)工艺,而美国则倾向于利用现有可再生柴油工厂的加氢处理乙醇(HEFA)工艺。生物液化石油气(Bio-LPG)在亚洲的应用仍处于起步阶段,但随着日本和韩国宣布整合产品流的航空脱碳策略,其应用可能会加速。液化石油气(LPG)市场份额正向可再生分子转移,预计在预测期内将持续成长。然而,至少到2030年,化石燃料衍生的液态天然气(NGL)仍将维持主导地位。这种双重供应体系将促使现有企业透过投资页岩气相关扩建计画和新兴生物精炼来规避风险。
本报告按生产来源(炼油厂衍生液化石油气、液态天然气、生物液化石油气/可再生丙烷)、分销管道(瓶装气、管道/虚拟管道、散装供应/零售散装供应)、应用(住宅/商业烹饪/供暖、石化原料、汽车燃料/汽车燃气等)和地区(北美、欧洲、亚太地区等)进行细分。
区域分析
预计到2025年,亚太地区将占全球收入的43.60%,并在2031年之前保持5.38%的复合年增长率,这主要得益于石化产品需求抵消了都市区感应改造带来的需求增长。中国2,260万吨的丙烷脱氢装置(PDH)产能将确保海运丙烷需求的持续成长,即使国内经济成长放缓。印度的进口量在2024年激增24%,但随着补贴的减少,预计成长将放缓。然而,烹饪用燃气在该国的农村燃气扩建计划中仍然占据重要地位。印尼计划在2050年将液化石油气(LPG)的使用量减少31%,这带来了一定的阻力,但东南亚工业和旅游业的扩张支撑了整体需求。日本和韩国保持稳定的工业需求,而越南和菲律宾则在人口成长和强劲的建筑业的推动下,正在崛起为新的成长中心。
北美拥有日产213万桶的丙烷生产基地,儘管港口拥堵,但仍出口超过70%的产量。 Keyera斥资51.5亿美元收购加拿大Plains NGL资产,将整合其储存和分馏能力,增强对太平洋盆地的供应冗余。墨西哥继续受益于跨境管道连接,以弥补国内供应缺口,而专业经销商正在扩展虚拟管道,为尚未覆盖的中部高原城市提供服务。
欧洲亟需实现供应链多元化,摆脱对俄罗斯的依赖。由于高度依赖波兰,贸易商不得不以高昂的运费美国和中东购买丙烷。英国斥资6亿英镑推出的可再生丙烷计画表明了其战略对冲意图,而OMV Petrom对巴西石油公司的投资则在东南欧建立了首个大型可持续空气燃料生物液化石油气(SAF-bio-LPG)枢纽。中东生产商(主要是卡达和阿联酋)到2030年将新增940万吨产能,从而能够对亚洲市场提供更具竞争力的供应,并削弱美国在该路线上的份额。儘管撒哈拉以南非洲地区持续面临供不应求,但位于南非、耗资10亿兰特的理查兹湾仓储设施已投入运作,有助于提升该地区的供应稳定性。拉丁美洲的成长受到气瓶安全事故的阻碍,但哥伦比亚和秘鲁正在对其管道进行现代化改造,以提高可靠性并降低终端用户成本。
其他福利:
- Excel格式的市场预测(ME)表
- 分析师支持(3个月)
目录
第一章 引言
- 研究假设和市场定义
- 调查范围
第二章调查方法
第三章执行摘要
第四章 市场情势
- 市场概览
- 市场驱动因素
- 向液化石油气兼容型混合式炉灶过渡计划(印度、印尼)
- 新兴亚洲地区对石化原料的需求快速成长
- 加速炼油厂升级改造,以生产符合IMO-2020标准的燃料
- 农村电气化进程的延误支撑了对燃气钢瓶的需求(非洲)
- 补贴改革鼓励商业部门采用(中东)
- 在北美和欧盟脱碳计画中扩大可再生丙烷的使用规模
- 市场限制
- 与美国页岩气出口套利相关的价格波动
- 加速中国和欧盟都市区电磁炉的普及
- 更严格的甲烷浓度标准有利于管道天然气而非液化石油气。
- 气瓶物流安全事故损害民众信任(拉丁美洲)
- 供应链分析
- 监管环境
- 技术展望
- 波特五力模型
- 供应商的议价能力
- 消费者议价能力
- 新进入者的威胁
- 替代产品和服务的威胁
- 竞争对手之间的竞争
第五章 市场规模与成长预测
- 按生产来源
- 炼油厂的液化石油气
- 液态天然气(联产气,NGL)
- 生物液化石油气/可再生丙烷
- 透过分销管道
- 钢瓶(包装)气体
- 散装供应和零售散装供应
- 管道和虚拟管道
- 透过使用
- 住宅和商用烹饪/供暖
- 工业和商业流程
- 汽车燃料/汽车燃气
- 石油化学原料
- 农业及其他
- 按地区
- 北美洲
- 美国
- 加拿大
- 墨西哥
- 欧洲
- 德国
- 英国
- 法国
- 义大利
- 俄罗斯
- 其他欧洲
- 亚太地区
- 中国
- 印度
- 日本
- 韩国
- 东南亚国协
- 亚太其他地区
- 南美洲
- 巴西
- 阿根廷
- 南美洲其他地区
- 中东和非洲
- 沙乌地阿拉伯
- 阿拉伯聯合大公国
- 南非
- 埃及
- 其他中东和非洲地区
- 北美洲
第六章 竞争情势
- 市场集中度
- 策略性倡议(併购、伙伴关係、购电协议)
- 市场占有率分析(主要企业的市场排名和份额)
- 公司简介
- BP plc
- Exxon Mobil Corporation
- Shell plc
- TotalEnergies SE
- Chevron Corporation
- ConocoPhillips
- Abu Dhabi National Oil Company(ADNOC)
- QatarEnergy
- Gazprom PJSC
- Novatek PAO
- China Petroleum & Chemical Corporation(Sinopec)
- China National Petroleum Corporation(CNPC)
- Indian Oil Corporation Ltd
- Reliance Industries Ltd(Reliance Gas)
- SHV Energy BV
- UGI Corp/AmeriGas
- Ferrellgas Partners LP
- Petronas
- PTT Public Company Ltd
- KazMunayGas
第七章 市场机会与未来展望
The Liquefied Petroleum Gas Market was valued at USD 155.89 billion in 2025 and estimated to grow from USD 163.06 billion in 2026 to reach USD 203.94 billion by 2031, at a CAGR of 4.60% during the forecast period (2026-2031).
Demand resilience is anchored by Asian petrochemical feedstock growth, large-scale rural cooking programs in India and Indonesia, and continuing substitution of high-sulfur fuels after IMO-2020 upgrades. Supply diversity widens as Qatar and the UAE lift output while North American producers maximize shale-derived volumes, yet export bottlenecks keep price swings frequent. Bio-LPG gains momentum under EU decarbonization rules, and pipeline investments in India, the United States, and West Africa seek to trim logistics costs and safety risks. Market participants, therefore, juggle a balanced opportunity set: stable household consumption, expanding petrochemical pull, and regulatory shifts that reward lower-carbon molecules.
Global Liquefied Petroleum Gas (LPG) Market Trends and Insights
LPG-ready cook-stove programmes expand clean fuel access
Indonesia's conversion of 50 million households from kerosene to LPG demonstrates rapid scalability and has become a reference model for other developing nations. India's Pradhan Mantri Ujjwala Yojana added 7.5 million new cylinder connections in 2024, driving a 24% import surge despite ongoing subsidy rationalization. West African governments now partner with the World Bank's Global LPG Partnership to replicate these roll-outs, aiming to lift Cameroon's penetration from 12% to 58% by 2030. Persistent rural electrification gaps leave LPG competitively positioned versus electric cooking, particularly where grid reliability remains low. Therefore, continued subsidy targeting and last-mile distribution innovation are central to sustaining household uptake.
Petrochemical feedstock demand boom reshapes Asian trade flows
China's propane dehydrogenation capacity climbed to 22.6 million t/y in 2024 and underpins steady seaborne imports despite cyclical economic slowdowns. India followed by committing USD 8 billion to a 1.5 million t/y ethane cracker at Vadinar that secures domestic feedstock and curbs foreign dependency. US ethane exports to China are projected to rise another 9-34% in 2025 as lower tariffs improve arbitrage economics. Tightening propylene balances have driven US polymer-grade prices beyond USD 0.40 per pound after LyondellBasell shuttered refinery units. In aggregate, more than USD 16 billion of Asian pipeline and storage infrastructure is set to anchor long-run liquefied petroleum gas market growth by absorbing regional demand volatility.
Price volatility driven by US export constraints
Gulf Coast terminal utilization hovered near 100% in 2024, sending Mont Belvieu cargo premiums to 32.5 c/gal before retreating when surplus propane hit storage. Enterprise's 300,000 b/d Houston expansion will not materialize until late 2026, while the 400,000 b/d ONEOK-MPLX Texas City project arrives only in 2028, leaving an interim capacity crunch. With the United States exporting 70% of its 2.13 million b/d propane output, any arbitrage closure triggers rapid inventory builds and price instability. China's position as the largest buyer magnifies geopolitical risk: a renewed tariff dispute could force Asian importers toward higher-priced Middle Eastern cargos. Volatility encourages heavier use of paper hedging, evidenced by a 43% surge in ethane and propane derivative trading volumes during 2024.
Other drivers and restraints analyzed in the detailed report include:
- Refinery upgrades for IMO-2020 multiply LPG supply points
- Renewable propane scale-up introduces low-carbon competition
- Induction cooking erodes urban LPG demand pockets
For complete list of drivers and restraints, kindly check the Table Of Contents.
Segment Analysis
Natural-gas liquids secured a 60.45% share of the liquefied petroleum gas market in 2025, buoyed by North American shale and Middle Eastern associated-gas projects that keep marginal costs low. Qatar's North Field build-out will elevate national LPG output from 10.7 million t in 2024 to 17.6 million t by 2030, while three ADNOC Gas programs add 2.5 million t over the same horizon, strengthening regional supply security. Refinery-derived LPG has come under pressure as Indian and Chinese refiners pivot toward petrochemicals, trimming run rates for fuels blending streams. Although still modest, the liquefied petroleum gas market size for bio-LPG is anticipated to expand at a 14.58% CAGR when measured from its 2025 baseline as EU mandates and state incentives unlock new production capacity. The segment benefits from drop-in compatibility and up to 90% lifecycle emissions cuts, enabling suppliers to layer premium pricing on corporate net-zero procurement contracts. Nonetheless, feedstock availability and competition with renewable diesel limit near-term scaling, particularly in North America, where conventional LPG oversupply narrows green premiums.
Adoption pathways differ across regions. Europe leans on used cooking oil and waste-based HVO routes, while the United States favors HEFA processes piggybacking on existing renewable diesel plants. Asia's bio-LPG roll-out remains nascent but could accelerate as Japan and South Korea unveil aviation decarbonization strategies that integrate co-product streams. The liquefied petroleum gas market share tilts toward renewable molecules, therefore deepens over the outlook, though absolute volumes remain led by fossil NGLs until at least 2030. This dual-track supply system encourages incumbents to hedge by investing in shale-linked expansions and emerging biorefineries.
The Liquefied Petroleum Gas (LPG) Market Report is Segmented by Source of Production (Refinery-Derived LPG, Natural Gas Liquids, and Bio-LPG/Renewable Propane), Distribution Channel (Cylinder Gas, Pipeline and Virtual Pipeline, and Bulk and Retail Bulk Supply), Application (Residential and Commercial Cooking/Heating, Petrochemical Feedstock, Autofuel/Autogas, and More), and Geography (North America, Europe, Asia-Pacific, and More).
Geography Analysis
Asia-Pacific held 43.60% of global revenue in 2025 and is expected to maintain a 5.38% CAGR to 2031 as petrochemical demand offsets urban induction conversions. China's 22.6 million-t PDH capacity ensures sustained seaborne propane pull, even with domestic economic moderation. India's 24% import surge in 2024 will taper as subsidies tighten, yet cooking gas remains critical for rural inclusion programs. Indonesia's roadmap to cut LPG usage 31% by 2050 introduces headwinds, though Southeast Asian industrial and tourism expansions cushion overall volumes. Japan and South Korea keep steady industrial baseloads, whereas Vietnam and the Philippines are emerging bright spots thanks to population growth and robust construction sectors.
North America leverages a 2.13 million b/d propane production platform, exporting more than 70% of output despite dock congestion. Canada's Keyera acquisition of Plains NGL assets for USD 5.15 billion integrates storage and fractionation, enhancing supply redundancy into Pacific basins. Mexico continues to benefit from cross-border pipeline connections that backstop domestic shortfalls, while specialty distributors expand virtual pipelines into underserved central plateau cities.
Europe grapples with post-Russian supply diversification: Poland's dependence has pushed traders toward US and Middle Eastern cargos at premium freight rates. The United Kingdom's GBP 600 million renewable propane drive signals strategic hedging, and OMV Petrom's Petrobrazi investment cements Southeast Europe's first major SAF-bio-LPG hub. Middle Eastern producers, chiefly Qatar and the UAE, add 9.4 million t of new capacity by 2030, enabling competitive offers into Asia and eroding US share in that corridor. Sub-Saharan Africa remains under-supplied; South Africa's R1 billion Richards Bay storage came online to stabilize regional availability. Latin America's growth is curtailed by cylinder safety incidents, but Colombia and Peru eye pipeline modernization to enhance reliability and lower end-user costs.
- BP plc
- Exxon Mobil Corporation
- Shell plc
- TotalEnergies SE
- Chevron Corporation
- ConocoPhillips
- Abu Dhabi National Oil Company (ADNOC)
- QatarEnergy
- Gazprom PJSC
- Novatek PAO
- China Petroleum & Chemical Corporation (Sinopec)
- China National Petroleum Corporation (CNPC)
- Indian Oil Corporation Ltd
- Reliance Industries Ltd (Reliance Gas)
- SHV Energy B.V.
- UGI Corp / AmeriGas
- Ferrellgas Partners LP
- Petronas
- PTT Public Company Ltd
- KazMunayGas
Additional Benefits:
- The market estimate (ME) sheet in Excel format
- 3 months of analyst support
TABLE OF CONTENTS
1 Introduction
- 1.1 Study Assumptions & Market Definition
- 1.2 Scope of the Study
2 Research Methodology
3 Executive Summary
4 Market Landscape
- 4.1 Market Overview
- 4.2 Market Drivers
- 4.2.1 Shift toward LPG-ready hybrid cook-stove programmes (India, Indonesia)
- 4.2.2 Petrochemical feedstock demand boom in emerging Asia
- 4.2.3 Accelerating refinery upgrades for IMO-2020 compliant fuels
- 4.2.4 Rural household electrification lag sustaining cylinder demand (Africa)
- 4.2.5 Subsidy reforms boosting commercial sector uptake (Middle East)
- 4.2.6 Renewable-propane scale-up in North America & EU decarbonization agendas
- 4.3 Market Restraints
- 4.3.1 Price volatility linked to US shale export arbitrage
- 4.3.2 Accelerating induction cooking penetration in urban China & EU
- 4.3.3 Stricter methane-intensity rules favoring piped natural gas over LPG
- 4.3.4 Cylinder logistics safety incidents undermining public perception (LATAM)
- 4.4 Supply-Chain Analysis
- 4.5 Regulatory Landscape
- 4.6 Technological Outlook
- 4.7 Porter's Five Forces
- 4.7.1 Bargaining Power of Suppliers
- 4.7.2 Bargaining Power of Consumers
- 4.7.3 Threat of New Entrants
- 4.7.4 Threat of Substitute Products & Services
- 4.7.5 Intensity of Competitive Rivalry
5 Market Size & Growth Forecasts
- 5.1 By Source of Production
- 5.1.1 Refinery-derived LPG
- 5.1.2 Natural Gas Liquids (Associated Gas, NGLs)
- 5.1.3 Bio-LPG/Renewable Propane
- 5.2 By Distribution Channel
- 5.2.1 Cylinder (Packaged) Gas
- 5.2.2 Bulk and Retail Bulk Supply
- 5.2.3 Pipeline and Virtual Pipeline
- 5.3 By Application
- 5.3.1 Residential and Commercial Cooking/Heating
- 5.3.2 Industrial and Commercial Processing
- 5.3.3 Autofuel/Autogas
- 5.3.4 Petrochemical Feedstock
- 5.3.5 Agriculture and Others
- 5.4 By Geography
- 5.4.1 North America
- 5.4.1.1 United States
- 5.4.1.2 Canada
- 5.4.1.3 Mexico
- 5.4.2 Europe
- 5.4.2.1 Germany
- 5.4.2.2 United Kingdom
- 5.4.2.3 France
- 5.4.2.4 Italy
- 5.4.2.5 Russia
- 5.4.2.6 Rest of Europe
- 5.4.3 Asia-Pacific
- 5.4.3.1 China
- 5.4.3.2 India
- 5.4.3.3 Japan
- 5.4.3.4 South Korea
- 5.4.3.5 ASEAN Countries
- 5.4.3.6 Rest of Asia-Pacific
- 5.4.4 South America
- 5.4.4.1 Brazil
- 5.4.4.2 Argentina
- 5.4.4.3 Rest of South America
- 5.4.5 Middle East and Africa
- 5.4.5.1 Saudi Arabia
- 5.4.5.2 United Arab Emirates
- 5.4.5.3 South Africa
- 5.4.5.4 Egypt
- 5.4.5.5 Rest of Middle East and Africa
- 5.4.1 North America
6 Competitive Landscape
- 6.1 Market Concentration
- 6.2 Strategic Moves (M&A, Partnerships, PPAs)
- 6.3 Market Share Analysis (Market Rank/Share for key companies)
- 6.4 Company Profiles (includes Global level Overview, Market level overview, Core Segments, Financials as available, Strategic Information, Products & Services, and Recent Developments)
- 6.4.1 BP plc
- 6.4.2 Exxon Mobil Corporation
- 6.4.3 Shell plc
- 6.4.4 TotalEnergies SE
- 6.4.5 Chevron Corporation
- 6.4.6 ConocoPhillips
- 6.4.7 Abu Dhabi National Oil Company (ADNOC)
- 6.4.8 QatarEnergy
- 6.4.9 Gazprom PJSC
- 6.4.10 Novatek PAO
- 6.4.11 China Petroleum & Chemical Corporation (Sinopec)
- 6.4.12 China National Petroleum Corporation (CNPC)
- 6.4.13 Indian Oil Corporation Ltd
- 6.4.14 Reliance Industries Ltd (Reliance Gas)
- 6.4.15 SHV Energy B.V.
- 6.4.16 UGI Corp / AmeriGas
- 6.4.17 Ferrellgas Partners LP
- 6.4.18 Petronas
- 6.4.19 PTT Public Company Ltd
- 6.4.20 KazMunayGas
7 Market Opportunities & Future Outlook
- 7.1 White-space & Unmet-Need Assessment
 汽车燃气市场:依技术、改装类型、通路、气瓶容量、车辆类型和最终用户划分-2026-2032年全球市场预测
 液化石油气(LPG)市场报告:按来源、应用、供应形式和地区划分(2026-2034 年)
 全球液化石油气汽化器市场规模、份额、趋势和成长分析报告(2026-2034年)
 2026年全球液化石油气蒸发器市场报告
 液化石油气蒸发器市场 - 全球产业规模、份额、趋势、机会及预测(按产品类型、产能、最终用途、地区和竞争格局划分,2021-2031年)
 汽车燃气市场规模、份额及成长分析(按类型、燃料类型、车辆类型、应用及地区划分)-2026-2033年产业预测液化石油气市场-全球产业规模、份额、趋势、机会及预测(依来源、供应方式、应用、地区及竞争格局划分,2020-2030年预测)
 液化石油气(LPG)市场规模、份额和趋势分析报告:按来源、应用、运输、地区和细分市场预测(2025-2033 年)
 2025-2029年全球液化石油气(LPG)市场汽车瓦斯市场-全球产业规模、份额、趋势、机会和预测(按类型、应用、地区和竞争细分,2020-2030 年)