


 |
市场调查报告书
商品编码
1910704
感测器:市场占有率分析、产业趋势与统计、成长预测(2026-2031)Sensors - Market Share Analysis, Industry Trends & Statistics, Growth Forecasts (2026 - 2031) |
||||||
※ 本网页内容可能与最新版本有所差异。详细情况请与我们联繫。
预计感测器市场将从 2025 年的 2,443.1 亿美元成长到 2026 年的 2,694.3 亿美元,并预计到 2031 年将达到 4,396.6 亿美元,2026 年至 2031 年的复合年增长率为 10.29%。
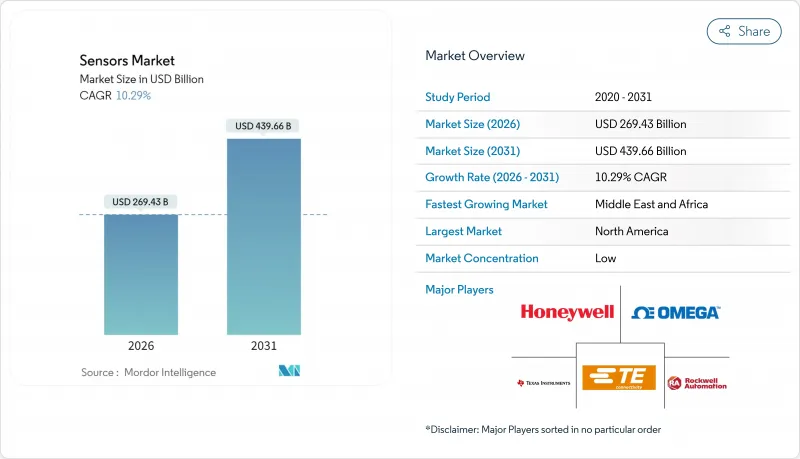
这一成长主要得益于自主行动平台的日益普及、工业自动化技术的快速发展以及互联连线健诊应用场景的不断扩展。人工智慧与感测器硬体的融合使得预测维修系统成为可能,可将工厂计划外停机时间减少高达 50%。目前,温度测量设备在感测器市场主导,市场份额达 23%,而化学感测器预计将以 14.8% 的复合年增长率实现最快成长。市场需求主要受中国智慧製造计画、日本汽车产业的强劲创新以及长期稳定的半导体供应链的推动。同时,在大规模设施数位化和清洁能源部署的推动下,中东和非洲正在崛起为成长最快的地区。儘管市场竞争依然激烈,仍处于分散状态,但近期的合资企业和定向收购正在加速围绕多模态和人工智慧赋能产品系列的整合。
全球感测器市场趋势与洞察
自动驾驶汽车中多感测器融合技术的应用日益广泛
雷射雷达、雷达和摄影机的资料流被整合到一个统一的感知堆迭中,提供冗余机制,以满足欧盟通用安全法规 2019/2144 对高级驾驶辅助系统的要求。特斯拉的全自动驾驶计算机以 144 TOPS 的运算速度处理来自八个摄影机、十二个超音波单元和一个雷达的输入,树立了性能标竿。一级供应商提供预先已调整的感知套件,以降低整合成本、缩减材料清单并加快产品上市速度。
亚洲现有工厂智慧工厂改造的普及
中国的「十四五」规划拨款1.4兆美元用于数位基础建设,其中大部分资金用于升级现有设备,增强其感测器性能,从而实现预测性维护,并将设备使用寿命延长20%至30%。安装在现有生产线上的振动、温度和流量测量装置可以将数据传输到云端进行分析,从而减少停机时间,提高整体设备效率(OEE),而无需对整个工厂进行彻底改造。
汽车级MEMS代工产能供应紧张
AEC-Q100认证週期最长可达两年,亚太地区只有少数晶圆厂能达到如此严格的标准。意法半导体正在扩大其无尘室,但电动车的普及带来了新的电池管理和热监控要求,给公司带来了更大的压力。
细分市场分析
到2025年,温度感测器将占据感测器市场22.74%的份额,并在汽车热感迴路和工业製程控制中继续发挥关键作用。化学感测器将以14.12%的复合年增长率快速成长,主要受排放气体监测和职场安全法规日益严格的推动。流量、振动和压力感测器将凭藉其预测性维护功能进一步拓展感测器市场,而接近感测器则可确保机器防护装置的合规性。
持续的微型化技术使得人工智慧引擎能够整合到温度感测器中,从而实现无需云端延迟的本地异常检测。惯性感测器、磁性感测器、光学感测器和湿度感测器完善了产品线,其应用范围涵盖智慧型手机方向检测到智慧城市空气品质监测网路等。
到2025年,电阻式感测器将占据感测器市场19.18%的份额,这主要得益于其低成本以及在工业和汽车仪錶板中的广泛应用。雷射雷达系统是自主导航的关键组成部分,预计到2031年将以16.74%的复合年增长率增长,这反映了价格下降以及向固体阵列的转变,后者无需机械部件。光学、压电、压电式、压电、磁性和声学等多种感测器模式涵盖了广泛的应用领域,可满足视觉、压力、振动、触觉和声音等方面的需求。
Velodyne 的 4D LiDAR 等先进技术将速度向量与距离和角度相结合,以提高驾驶员辅助功能的物件分类精度;而压电采集器则可为远端管道中无电池感测器节点提供微焦耳级的电力。
市场按测量参数(温度、流量等)、工作模式(光学、压阻式、压电等)、技术(MEMS、光子学等)、整合度(分立感测器、整合/嵌入式感测器)、输出(类比、数位)、终端用户产业(汽车、工业製造等)和地区进行细分。市场预测以以金额为准。
区域分析
到2025年,亚太地区将占全球收入的36.21%,这主要得益于中国1.4兆美元的数位基础建设投入、日本先进的汽车供应链以及韩国在光刻技术的主导。政府激励措施降低了晶圆厂和嵌入式感测器新兴企业的资本门槛,从而形成了区域性的设计和生产技术丛集。供应商受益于靠近大多数消费性电子产品组装线,从而缩短了前置作业时间并降低了物流成本。
在欧洲,严格的安全和环保法规正在推动稳定且高价值的需求。强制性的高阶驾驶辅助系统(ADAS)和产业脱碳目标正在促使消费者购买功能更强大、安全性更高的产品。欧盟《晶片法案》的津贴以及欧洲投资银行的融资(例如恩智浦半导体10亿欧元的贷款)正在推动汽车级晶片产能的提升。
随着波湾合作理事会国家实施智慧电网、海水淡化监测和大规模可再生能源项目,中东和非洲预计将以14.58%的复合年增长率成长。非洲的采矿和运输走廊正越来越多地部署能够承受灰尘、振动和电力不稳定的坚固型感测器。儘管规模较小,但拉丁美洲巴西和墨西哥的智慧农业试点计画正逐步提高产量。
其他福利:
- Excel格式的市场预测(ME)表
- 3个月的分析师支持
目录
第一章 引言
- 研究假设和市场定义
- 调查范围
第二章调查方法
第三章执行摘要
第四章 市场情势
- 市场概览
- 市场驱动因素
- 扩大多感测器融合技术在自动驾驶车辆的应用
- 亚洲现有工厂智慧工厂维修的普及
- 海上能源产业向基于状态的资产管理转型
- 下一代欧盟车辆将被要求配备高级驾驶辅助系统(ADAS)感测套件。
- 用于无电池物联网标籤的超低功耗环境感测技术
- 市场限制
- 汽车级MEMS代工产能供应紧张
- 长寿命振动感测器的校准漂移问题
- 无线通讯协定标准碎片化阻碍了智慧感测器的互通性
- 价值与供应链分析
- 监理与技术展望
- 波特五力分析
- 供应商的议价能力
- 买方的议价能力
- 新进入者的威胁
- 替代品的威胁
- 竞争程度
- 柔性及印刷感测器的发展趋势(现况及预测)
- 宏观经济和疫情影响评估
第五章 市场规模与成长预测
- 透过测量参数
- 温度
- 流动
- 化学
- 振动
- 压力
- 接近性
- 惯性
- 其他参数
- 按操作模式
- 光学
- 压电元件
- 压电
- 电阻
- 影像
- LiDAR
- 其他模式
- 透过技术
- MEMS
- 光子
- CMOS
- 电子机械系统(NEMS)
- 依整合程度
- 分立感测器
- 整合/嵌入式感测器
- 按产量计
- 模拟
- 数位的
- 按最终用户行业划分
- 车
- 工业製造
- 医疗保健
- 航太
- 家用电子电器
- 石油和天然气
- 建造
- 防御
- 按地区
- 北美洲
- 美国
- 加拿大
- 墨西哥
- 欧洲
- 英国
- 德国
- 法国
- 义大利
- 其他欧洲地区
- 亚太地区
- 中国
- 日本
- 印度
- 韩国
- 亚太其他地区
- 中东
- 以色列
- 沙乌地阿拉伯
- 阿拉伯聯合大公国
- 土耳其
- 其他中东地区
- 非洲
- 南非
- 埃及
- 其他非洲地区
- 南美洲
- 巴西
- 阿根廷
- 南美洲其他地区
- 北美洲
第六章 竞争情势
- 市场集中度
- 策略趋势
- 市占率分析
- 公司简介
- Honeywell International Inc.
- Bosch Sensortec GmbH
- Texas Instruments Inc.
- TE Connectivity Ltd
- Rockwell Automation Inc.
- OMEGA Engineering inc.
- STMicroelectronics NV
- Infineon Technologies AG
- NXP Semiconductors NV
- ams OSRAM AG
- Analog Devices Inc.
- Renesas Electronics Corp.
- Microchip Technology Inc.
- ROHM Semiconductor
- Omron Corp.
- ABB Ltd
- Sick AG
- Qualcomm Technologies Inc.
- Velodyne Lidar Inc.
- LeddarTech Inc.
- TDK Corp.
第七章 市场机会与未来展望
The sensors market is expected to grow from USD 244.31 billion in 2025 to USD 269.43 billion in 2026 and is forecast to reach USD 439.66 billion by 2031 at 10.29% CAGR over 2026-2031.
The growth is propelled by wider adoption of autonomous mobility platforms, rapid industrial automation, and expanding use-cases in connected healthcare. Convergence between artificial intelligence and sensor hardware is enabling predictive maintenance systems that cut unplanned factory downtime by up to 50%. Temperature devices currently dominate the sensors market with 23% share, while chemical variants are on track for the fastest expansion at a 14.8% CAGR. Asia-Pacific leads demand on the back of Chinese smart manufacturing programs, strong automotive innovation in Japan, and long-standing semiconductor supply chains. At the same time, Middle East & Africa is emerging as the quickest-growing region, supported by large-scale infrastructure digitalization and clean-energy buildouts. Competitive intensity remains high and fragmented, yet recent joint ventures and targeted acquisitions are accelerating consolidation around multimodal and AI-enabled product portfolios.
Global Sensors Market Trends and Insights
Increasing adoption of multi-sensor fusion in autonomous mobility
LiDAR, radar, and camera streams are now integrated into unified perception stacks, creating redundancy that meets the EU General Safety Regulation 2019/2144 for advanced driver assistance in all new vehicles. Tesla's full self-driving computer already processes inputs from 8 cameras, 12 ultrasonic units, and a radar at 144 TOPS, setting a performance benchmark. Tier-1 suppliers are responding with pre-calibrated perception suites that lower integration cost, compress bill-of-materials, and accelerate time-to-market.
Proliferation of smart-factory retrofits in brown-field Asian plants
China's 14th Five-Year Plan earmarked USD 1.4 trillion for digital infrastructure, much of which targets sensor-rich upgrades of legacy machinery to unlock predictive maintenance and 20-30% lifecycle extensions. Vibration, temperature, and flow devices fitted to existing lines feed cloud analytics that cut downtime and lift overall equipment effectiveness without full plant reconstruction.
Supply tightness of automotive-grade MEMS foundry capacity
AEC-Q100 qualification cycles span up to two years and only a few Asia-Pacific fabs meet the stringent criteria. STMicroelectronics is expanding clean-room footprints, yet EV proliferation adds pressure by introducing fresh battery-management and thermal-monitoring loads.
Other drivers and restraints analyzed in the detailed report include:
- Shift toward condition-based asset monitoring in offshore energy
- Mandatory inclusion of ADAS sensing suites in next-gen EU vehicles
- Calibration drift challenges in long-life vibration sensors
For complete list of drivers and restraints, kindly check the Table Of Contents.
Segment Analysis
Temperature devices held 22.74% sensors market share in 2025 and remain indispensable for automotive thermal loops and industrial process control. Chemical variants are scaling fastest, on course for 14.12% CAGR through 2031 on rising emissions monitoring and workplace-safety mandates. Flow, vibration, and pressure categories together deepen the sensors market with predictive maintenance reach, while proximity units ensure machine-guarding compliance.
Continued miniaturization now allows integrated AI engines inside temperature elements, enabling local anomaly detection without cloud latency. Inertial, magnetic, optical, and humidity devices round out the portfolio, serving everything from smartphone orientation to smart-city air-quality grids.
Electrical-resistance designs accounted for 19.18% of the sensors market in 2025 thanks to low cost and broad design-in across industrial and vehicle dashboards. LiDAR systems, critical for autonomous navigation, are projected to rise at 16.74% CAGR through 2031, reflecting price drops and movement to solid-state arrays that shed mechanical parts. Optical, piezoresistive, piezoelectric, capacitive, magnetic, and acoustic modes complete a diverse field addressing vision, pressure, vibration, touch, and sound requirements.
Advances such as Velodyne's 4D LiDAR integrate velocity vectors with distance and angle, sharpening object classification for driver-assist functions. Meanwhile, piezoelectric harvesters supply micro-joule power budgets for battery-less sensor nodes in remote pipelines.
Sensors Market Segmented by Parameter Measured (Temperature, Flow and More), Mode of Operation (Optical, Piezoresistive, Piezoelectric, and More), Technology (MEMS, Photonic, and More), Integration Level (Discrete Sensors, Integrated/Embedded Sensors), Output (Analog, Digital), End-User Industry (Automotive, Industrial Manufacturing, and More), and Geography. The Market Forecasts are Provided in Terms of Value (USD).
Geography Analysis
Asia-Pacific held 36.21% of global revenue in 2025, anchored by China's USD 1.4 trillion digital-infrastructure push, Japan's advanced automotive supply chains, and South Korea's lithography leadership. Government incentives lower capital hurdles for fabs and embedded-sensor startups alike, translating into a dense regional cluster of design and production know-how. Suppliers enjoy proximity to the bulk of consumer-electronics assembly lines, compressing lead times and logistics costs.
Europe delivers steady high-value demand around stringent safety and environmental regulations. Mandatory ADAS fitment and industrial decarbonization targets push purchasing toward higher-performance, functionally safe products. The EU's Chips Act grants and European Investment Bank loans such as NXP's EUR 1 billion facilities funnel fresh capacity into on-shore automotive-grade production.
Middle East & Africa is projected to expand at 14.58% CAGR as Gulf Cooperation Council states embed smart grids, desalination monitoring, and large-scale renewables. African mining and transport corridors increasingly deploy ruggedized sensors that tolerate dust, vibration, and power instability. Latin America, though smaller, sees smart-agriculture pilots across Brazil and Mexico, adding incremental volume.
- Honeywell International Inc.
- Bosch Sensortec GmbH
- Texas Instruments Inc.
- TE Connectivity Ltd
- Rockwell Automation Inc.
- OMEGA Engineering inc.
- STMicroelectronics N.V.
- Infineon Technologies AG
- NXP Semiconductors N.V.
- ams OSRAM AG
- Analog Devices Inc.
- Renesas Electronics Corp.
- Microchip Technology Inc.
- ROHM Semiconductor
- Omron Corp.
- ABB Ltd
- Sick AG
- Qualcomm Technologies Inc.
- Velodyne Lidar Inc.
- LeddarTech Inc.
- TDK Corp.
Additional Benefits:
- The market estimate (ME) sheet in Excel format
- 3 months of analyst support
TABLE OF CONTENTS
1 INTRODUCTION
- 1.1 Study Assumptions and Market Definition
- 1.2 Scope of the Study
2 RESEARCH METHODOLOGY
3 EXECUTIVE SUMMARY
4 MARKET LANDSCAPE
- 4.1 Market Overview
- 4.2 Market Drivers
- 4.2.1 Increasing adoption of multi-sensor fusion in autonomous mobility
- 4.2.2 Proliferation of smart-factory retrofits in brown-field Asian plants
- 4.2.3 Shift toward condition-based asset monitoring in offshore energy
- 4.2.4 Mandatory inclusion of ADAS sensing suites in next-gen EU vehicles
- 4.2.5 Ultra-low-power environmental sensing for battery-free IoT tags
- 4.3 Market Restraints
- 4.3.1 Supply tightness of automotive-grade MEMS foundry capacity
- 4.3.2 Calibration drift challenges in long-life vibration sensors
- 4.3.3 Fragmented wireless protocol standards hindering smart-sensor interoperability
- 4.4 Value and Supply-Chain Analysis
- 4.5 Regulatory and Technological Outlook
- 4.6 Porter's Five Forces Analysis
- 4.6.1 Bargaining Power of Suppliers
- 4.6.2 Bargaining Power of Buyers
- 4.6.3 Threat of New Entrants
- 4.6.4 Threat of Substitutes
- 4.6.5 Degree of Competition
- 4.7 Flexible and Printed Sensors Dynamics (current status, projections)
- 4.8 Macroeconomic and Pandemic Impact Assessment
5 MARKET SIZE AND GROWTH FORECASTS (VALUE)
- 5.1 By Parameter Measured
- 5.1.1 Temperature
- 5.1.2 Flow
- 5.1.3 Chemical
- 5.1.4 Vibration
- 5.1.5 Pressure
- 5.1.6 Proximity
- 5.1.7 Inertial
- 5.1.8 Other Parameters
- 5.2 By Mode of Operation
- 5.2.1 Optical
- 5.2.2 Piezoresistive
- 5.2.3 Piezoelectric
- 5.2.4 Electrical Resistance
- 5.2.5 Image
- 5.2.6 LiDAR
- 5.2.7 Other Modes
- 5.3 By Technology
- 5.3.1 MEMS
- 5.3.2 Photonic
- 5.3.3 CMOS
- 5.3.4 Nano-electromechanical (NEMS)
- 5.4 By Integration Level
- 5.4.1 Discrete Sensors
- 5.4.2 Integrated / Embedded Sensors
- 5.5 By Output
- 5.5.1 Analog
- 5.5.2 Digital
- 5.6 By End-user Industry
- 5.6.1 Automotive
- 5.6.2 Industrial Manufacturing
- 5.6.3 Medical and Wellness
- 5.6.4 Aerospace
- 5.6.5 Consumer Electronics
- 5.6.6 Oil and Gas
- 5.6.7 Construction
- 5.6.8 Defense
- 5.7 By Geography
- 5.7.1 North America
- 5.7.1.1 United States
- 5.7.1.2 Canada
- 5.7.1.3 Mexico
- 5.7.2 Europe
- 5.7.2.1 United Kingdom
- 5.7.2.2 Germany
- 5.7.2.3 France
- 5.7.2.4 Italy
- 5.7.2.5 Rest of Europe
- 5.7.3 Asia-Pacific
- 5.7.3.1 China
- 5.7.3.2 Japan
- 5.7.3.3 India
- 5.7.3.4 South Korea
- 5.7.3.5 Rest of Asia-Pacific
- 5.7.4 Middle East
- 5.7.4.1 Israel
- 5.7.4.2 Saudi Arabia
- 5.7.4.3 United Arab Emirates
- 5.7.4.4 Turkey
- 5.7.4.5 Rest of Middle East
- 5.7.5 Africa
- 5.7.5.1 South Africa
- 5.7.5.2 Egypt
- 5.7.5.3 Rest of Africa
- 5.7.6 South America
- 5.7.6.1 Brazil
- 5.7.6.2 Argentina
- 5.7.6.3 Rest of South America
- 5.7.1 North America
6 COMPETITIVE LANDSCAPE
- 6.1 Market Concentration
- 6.2 Strategic Moves
- 6.3 Market Share Analysis
- 6.4 Company Profiles (includes Global level Overview, Market level overview, Core Segments, Financials as available, Strategic Information, Market Rank/Share for key companies, Products and Services, and Recent Developments)
- 6.4.1 Honeywell International Inc.
- 6.4.2 Bosch Sensortec GmbH
- 6.4.3 Texas Instruments Inc.
- 6.4.4 TE Connectivity Ltd
- 6.4.5 Rockwell Automation Inc.
- 6.4.6 OMEGA Engineering inc.
- 6.4.7 STMicroelectronics N.V.
- 6.4.8 Infineon Technologies AG
- 6.4.9 NXP Semiconductors N.V.
- 6.4.10 ams OSRAM AG
- 6.4.11 Analog Devices Inc.
- 6.4.12 Renesas Electronics Corp.
- 6.4.13 Microchip Technology Inc.
- 6.4.14 ROHM Semiconductor
- 6.4.15 Omron Corp.
- 6.4.16 ABB Ltd
- 6.4.17 Sick AG
- 6.4.18 Qualcomm Technologies Inc.
- 6.4.19 Velodyne Lidar Inc.
- 6.4.20 LeddarTech Inc.
- 6.4.21 TDK Corp.
7 MARKET OPPORTUNITIES AND FUTURE OUTLOOK
- 7.1 White-space and Unmet-need Assessment
 主动感测器市场规模、份额和成长分析(按技术、嵌入式感测器、功能、应用、最终用户和地区划分)—2026-2033年产业预测
 色彩对比感测器市场规模、份额及成长分析(按技术、产业垂直领域及地区划分)-2026-2033年产业预测
 过渡金属二硫化物 (TMD) 市场:产业趋势及全球预测(至 2035 年)-依产品类型、应用类型、分销管道和地区划分
 主动感测器市场规模、份额和成长分析:按技术、嵌入式感测器、功能、应用、最终用户、地区划分 - 2025-2032 年产业预测
 2025年全球评估电子产品市场报告
 过渡金属硫族市场分析及预测(至2034年):类型、产品、应用、技术、最终用户、材料类型、功能、製程与组件
 TMD摩擦策略分析(2025-2030)
 互动式感测器市场按技术、应用、最终用途、连接类型和外形规格-2025-2032年全球预测感测器市场按技术类型、感测器类型、连接性、功能性、频率范围、最终用途产业和应用划分 - 全球预测 2025-2032感测器测试市场按产品、测试类型、功能、感测器类型、测试环境和最终用户划分-2025-2032年全球预测