


 |
市场调查报告书
商品编码
1910712
多晶硅:市场占有率分析、产业趋势与统计、成长预测(2026-2031)Polysilicon - Market Share Analysis, Industry Trends & Statistics, Growth Forecasts (2026 - 2031) |
||||||
※ 本网页内容可能与最新版本有所差异。详细情况请与我们联繫。
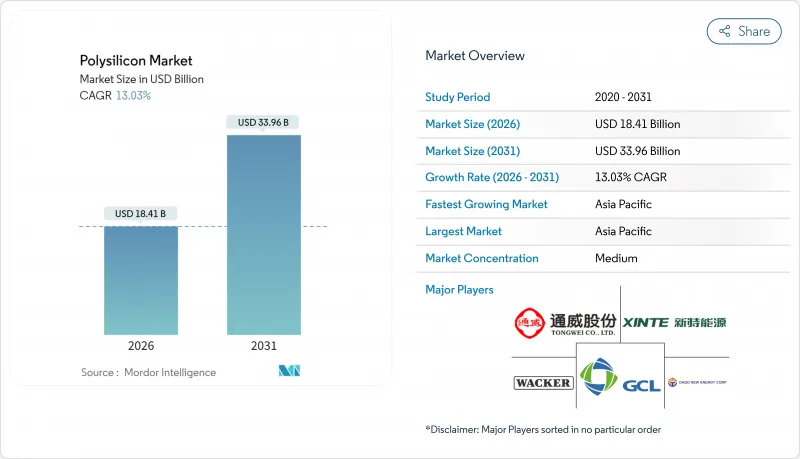
预计到 2025 年,多晶硅市场价值将达到 162.9 亿美元,从 2026 年的 184.1 亿美元成长到 2031 年的 339.6 亿美元,在预测期(2026-2031 年)内,复合年增长率将达到 13.03%。
这一成长轨迹主要得益于太阳能光伏产能的快速扩张、半导体资本投资的成长以及旨在促进区域供应多元化的政策奖励。向N型拓朴绝缘体和异质结电池结构的快速转型正在扩大普通级和高端级硅之间的纯度差距,而闭合迴路硅回收利用正稳步迈向市电平价的目标。同时,欧美强制劳动限制措施重塑了贸易路线,造成了双重定价环境,有利于新疆以外地区可追溯的材料。由于中国产运转率仍低于40%,成本压力依然强劲,儘管长期半导体合约维持了超高纯度硅生产商的利润率,但现货价格却呈下降趋势。
全球多晶硅市场趋势及展望
全球太阳能发电规模大规模扩张
全球光电发电装置容量预计将从2022年的191吉瓦激增132%至2023年的444吉瓦,这将提振多晶硅市场需求,同时也加剧上游供应链的紧张。开发商争相在中国2025年6月上网电价补贴政策调整前锁定组件,导致原物料采购前置作业时间超过通常的18个月。儘管中国的新反应器已开始运作,但由于试运行延迟,高效级多晶硅库存仍然紧张。印度和东南亚的计划开发进一步收紧了供应,儘管目前价格疲软,但仍为未来多年的成长奠定了基础。期货合约交易表明,买家仍然愿意为可追溯的非新疆产多晶硅支付溢价,以确保符合美国和欧洲的监管要求。
人工智慧主导的半导体资本投资超级週期
由于对污染容许度要求更高,3奈米及以下製程的先进逻辑和记忆体晶圆厂每片晶圆消耗的高纯度多晶硅量是传统晶圆厂的三倍。每年超过2000亿美元的晶圆代工厂投资用于支持长期供应合同,从而保护供应商免受太阳能价格波动的影响。美国《晶片法案》(520亿美元)和欧盟《晶片法案》旨在到2030年将区域晶圆产量提高到全球份额的20%,这将为北美和欧洲创造额外的多晶硅需求。符合11N级规格的生产商可以获得比太阳能级产品高出300%至400%的价格溢价,从而确保利润并为其资金筹措。
长期产能过剩
2025年第一季,中国製造商的运转率维持在约33%,现货价格从每吨72,100元人民币暴跌至34,000元人民币,迫使他们以低于现金成本的价格出售产品。这种供应过剩源自于2021年至2023年间产能扩张速度超过晶圆生产线扩张速度,导致多晶硅市场在2026年之前一直处于清算价格驱动的格局。北京的节能审核可能会导致20%至30%的小规模反应器关闭,但具体时间尚不清楚。在实现合理化之前,电力和TCS成本高的生产商将面临负利润,并限制资本投资,从而限制了近期维修。
细分市场分析
到2025年,西门子反应器将维持66.42%的多晶硅市场份额,其生产的11N级产品深受太阳能和半导体行业买家的青睐。然而,大宗商品价格的持续下跌使得电力消耗日益受到关注。西门子生产线每公斤耗电60-70千瓦时,这给高成本地区的利润率带来了压力。由于连续粉末排放,流体化床反应器(FBR)多晶硅市场预计将以14.18%的复合年增长率快速增长,这得益于其能耗降低25%以及每吨资本支出的减少。清华大学的最新研究证实,优化后的FBR塔的沉积速率提高了40%,促使人们将其应用于现有设备的维修。然而,FBR供应商必须先解决粉末污染的风险,才能排放半导体市场。虽然先进冶金级硅目前仍是一个小众市场,但加拿大和挪威的先导工厂表明,寻求控製成本的垂直整合晶圆公司对先进冶金级硅的兴趣日益浓厚。
电力价格套利正在重塑全球投资格局。中东计划正以低于0.03美元/千瓦时的价格利用可再生能源,这使得部署西门子设备生产10N级太阳能材料成为可能。同时,美国墨西哥湾沿岸的输电线路正在采用联合循环燃气发电,并利用第45X条税收抵免政策。环境法规也产生了影响,欧洲相关人员要求揭露生命週期二氧化碳排放量。流体化床反应器(FBR)因其低碳足迹而备受认可。整体而言,在多晶硅市场的区域能源格局中,技术选择正成为平衡资本支出、营运成本、纯度和碳排放标准的策略工具。
区域分析
亚太地区保持主导地位,预计到2025年将占据多晶硅市场65.70%的收入份额,这主要得益于中国从石英矿开采到组件组装的完整供应链。儘管中国名目产能因地方政府的优惠政策而超过40万吨,但长期供应过剩导致工厂运转率低下,利润率下降。印度是重要的战略需求来源。除非国内硅生产能够实现,否则印度要实现2030年500吉瓦可再生能源目标,每年需要进口超过15万吨硅。日本和韩国专注于半导体级硅的生产,并利用其长期累积的纯度技术,但高昂的电力成本阻碍了现有工厂的扩张。
北美正步入復苏期,製造业在《反通膨法案》的推动下重获新生。 REC Silicon位于摩西湖的工厂将运作,预计到2026年将供应1.4万吨FBR粉末。然而,美国的太阳能发电装置容量可能超过每年50吉瓦,这将造成结构性短缺,需要从马来西亚和德国进口来填补。根据《维吾尔强迫劳动预防法》实施的301条款关税和扣押措施,使物流变得复杂,催生了可追溯货物的高端现货市场。加拿大正在对一座年产1万吨半导体级粉末的工厂进行可行性研究,该工厂将利用水力发电提供低碳电力。
欧洲面临着如何在雄心勃勃的「适合55岁人群」目标与飙升的工业用电价格之间取得平衡的挑战,目前工业用电价格平均为0.27欧元/千瓦时(是美国的两倍)。然而,挪威的水力发电盈余正在推动流化床提案(FBR)设施的建设,这些设施旨在实现范围2净零排放,而欧盟组件买家非常重视这项认证要求。
中东国家正寻求能源成本套利。阿曼的10万吨计划旨在利用低于0.03美元/千瓦时的太阳能发电和港口接近性,向亚洲和非洲供应能源。非洲是一个新兴市场,埃及和摩洛哥正在研究利用与国内太阳能目标相关的冶炼厂生产超细颗粒(UMG)的路线。
其他福利:
- Excel格式的市场预测(ME)表
- 3个月的分析师支持
目录
第一章 引言
- 研究假设和市场定义
- 调查范围
第二章调查方法
第三章执行摘要
第四章 市场情势
- 市场概览
- 市场驱动因素
- 全球大规模扩大太阳能发电建设(大型电厂+分散式系统)
- 人工智慧主导的半导体资本支出超级週期(3nm及以下製程节点)
- IRA-/Fit-for-55 措施旨在促进多晶硅回流日本
- 新一代N型TOPCon/IBC电池对超高纯度多晶硅的需求日益增长。
- 闭合迴路硅回收经济效益将在2030年达到与市电平价
- 市场限制
- 2024-2026年期间,长期供应过剩且价格低于现金成本。
- 低规格太阳能发电领域中 UMG-Si 替代的风险
- 西方对来自新疆维吾尔自治区的资料进行强制劳动审核的规定
- 价值链分析
- 波特五力模型
- 供应商的议价能力
- 买方的议价能力
- 新进入者的威胁
- 替代品的威胁
- 竞争程度
- 技术概述
第五章 市场规模与成长预测
- 透过製造工艺
- 西门子(TCS-CVD)
- 流体化床反应器(硅烷-FBR)
- 升级冶金级(UMG)
- 按最终用户行业划分
- 太阳能发电
- 单晶硅太阳能板
- 多结晶硅太阳能电池板
- 电子和半导体
- 太阳能发电
- 按地区
- 亚太地区
- 中国
- 印度
- 日本
- 韩国
- 亚太其他地区
- 北美洲
- 美国
- 加拿大
- 墨西哥
- 欧洲
- 德国
- 英国
- 法国
- 义大利
- 其他欧洲地区
- 南美洲
- 巴西
- 阿根廷
- 南美洲其他地区
- 中东和非洲
- 沙乌地阿拉伯
- 南非
- 其他中东和非洲地区
- 亚太地区
第六章 竞争情势
- 市场集中度
- 策略趋势
- 市占率(%)/排名分析
- 公司简介
- Asia Silicon(Qinghai)Co. Ltd
- DAQO NEW ENERGY CO. LTD
- GCL-TECH
- Hemlock Semiconductor Operations LLC and Hemlock Semiconductor LLC
- Mitsubishi Polycrystalline Silicon America Corporation
- OCI Company Ltd
- Qatar Solar Technologies
- REC Silicon ASA
- Sichuan Yongxiang Co. Ltd(Tongwei)
- Tokuyama Corporation
- Tongwei Co., Ltd
- United Solar Polysilicon(FZC)SPC
- Wacker Chemie AG
- Xinte Energy Co. Ltd
第七章 市场机会与未来展望
The Polysilicon Market was valued at USD 16.29 billion in 2025 and estimated to grow from USD 18.41 billion in 2026 to reach USD 33.96 billion by 2031, at a CAGR of 13.03% during the forecast period (2026-2031).
This growth trajectory stems from surging solar-PV build-outs, rising semiconductor capital expenditure, and policy incentives that promote regional supply diversification. A sharp pivot toward N-type TOPCon and heterojunction cell architectures is widening the purity gap between commodity and premium grades, while closed-loop silicon recycling advances steadily toward grid-parity economics. Meanwhile, Western forced-labor rules are redrawing trade lanes, creating a dual-pricing environment that rewards traceable, non-Xinjiang feedstock. Cost pressures remain intense as Chinese utilization rates hover below 40%, depressing spot prices even as long-term semiconductor contracts preserve margins for ultra-high-purity producers.
Global Polysilicon Market Trends and Insights
Massive Global Solar-PV Build-Out
Global PV installations accelerated from 191 GW in 2022 to 444 GW in 2023, a 132% surge that compressed upstream supply chains and fortified polysilicon market demand. Developers raced to lock in modules ahead of China's June 2025 grid-tariff shift, stretching feedstock lead times beyond typical 18-month capacity additions. Although fresh Chinese reactors are entering service, commissioning lags keep inventories thin in high-efficiency grades. Project pipelines in India and Southeast Asia compound the pull on available volumes, reinforcing a multi-year growth runway despite current price softness. Forward contract activity indicates that buyers remain willing to pay premiums for traceable, non-Xinjiang material to ensure regulatory compliance in the United States and Europe.
AI-Driven Semiconductor CAPEX Super-Cycle
Advanced logic and memory fabs below the 3-nm node consume up to triple the high-purity polysilicon per wafer versus legacy lines because of tighter contamination thresholds. Annual foundry investments topping USD 200 billion underpin long-dated offtake agreements that shield suppliers from solar price volatility. The U.S. CHIPS Act (USD 52 billion) and the EU Chips Act together aim to boost local wafer output to 20% of global share by 2030, pulling incremental polysilicon tonnage into North America and Europe. Producers capable of 11N-grade specifications capture 300-400% price premiums over solar-grade parcels, cushioning margins and funding process upgrades.
Prolonged Capacity Overhang
Chinese producers ran at roughly 33% utilization in Q1 2025, selling below cash costs as spot prices plunged from CNY 72,100 to CNY 34,000 per ton. The glut stems from 2021-23 build-outs that outpaced wafer line expansions, locking the polysilicon market into a clearing-price mentality through 2026. Beijing's energy-efficiency audits may shutter 20-30% of sub-scale reactors, but the timing remains uncertain. Until rationalization materializes, producers with higher electricity or TCS costs face negative margins and constrained capex, limiting near-term technology retrofits.
Other drivers and restraints analyzed in the detailed report include:
- IRA and Fit-for-55 Onshoring Incentives
- Closed-Loop Silicon Recycling Reaches Parity
- UMG Silicon Substitution Threat
For complete list of drivers and restraints, kindly check the Table Of Contents.
Segment Analysis
Siemens reactors retained a 66.42% polysilicon market share in 2025, producing 11N-grade output prized by both solar and semiconductor buyers. Yet, sustained commodity price erosion heightens focus on power consumption; Siemens lines draw 60-70 kWh per kilogram, pressuring margins in high-tariff regions. The polysilicon market size for Fluidized Bed Reactor (FBR) output is projected to surge at 14.18% CAGR, aided by 25% lower electricity use and continuous powder discharge that trims capex per tonne. Recent Tsinghua University studies confirm 40% higher deposition rates in optimized FBR columns, bolstering adoption for brownfield retrofits. Still, FBR vendors must address powder contamination risks to penetrate the semiconductor space. Upgraded metallurgical-grade silicon occupies a niche today, but pilot plants in Canada and Norway signal growing interest among vertically integrated wafer firms seeking cost ceilings.
Power-price arbitrage is shaping global investment patterns: Middle East projects leverage sub-USD 0.03/kWh renewables to justify Siemens builds targeting 10N-grade solar feedstock, while U.S. Gulf Coast lines employ combined-cycle gas to exploit Section 45X tax rebates. Environmental scrutiny also plays a role; European financiers require lifecycle CO2 disclosures, favoring FBR's lower per-kilogram carbon footprint. Overall, technology choice is becoming a strategic lever, balancing capex, opex, purity, and carbon criteria across regional energy landscapes within the polysilicon market.
The Polysilicon Market Report is Segmented by Production Process (Siemens (TCS-CVD), Fluidized Bed Reactor (Silane-FBR), Upgraded Metallurgical-Grade (UMG)), End-User Industry (Solar Photovoltaics, Electronics and Semiconductors), and Geography (Asia-Pacific, North America, Europe, South America, Middle East and Africa). The Market Forecasts are Provided in Terms of Value (USD).
Geography Analysis
Asia-Pacific dominated the polysilicon market with 65.70% revenue share in 2025, riding on China's integrated supply chain that spans quartz mining to module assembly. Provincial incentives helped Chinese nameplate capacity exceed 400 kilotonnes, yet chronic oversupply slashed plant utilization and triggered margin erosion. India adds a strategic demand layer: its 500 GW renewables target by 2030 implies annual silicon imports exceeding 150 kilotonnes unless local ventures materialize. Japan and South Korea focus on semiconductor-grade volumes, leveraging long-standing purity expertise but facing high electricity costs that hinder brownfield expansions.
North America enters a renaissance phase as the Inflation Reduction Act re-anchors manufacturing. REC Silicon's Moses Lake restart will deliver 14 kilotonnes of FBR powder by 2026, but U.S. solar installations could exceed 50 GW annually, leaving a structural deficit covered by imports from Malaysia and Germany. Section 301 tariffs and Uyghur Forced Labor Prevention Act detentions complicate logistics, fostering a premium spot market for traceable cargoes. Canada offers hydropower-driven low-carbon electricity, drawing feasibility studies for semiconductor-grade plants aiming at 10-kilotonne scales.
Europe balances ambitious Fit-for-55 targets against steep industrial power tariffs that average EUR 0.27/kWh, twice U.S. levels. Nevertheless, Norway's hydro surplus underpins proposals for FBR facilities targeting net-zero Scope 2 emissions, a credential valued by EU module buyers.
Middle East actors pursue energy-cost arbitrage: Oman's 100-kilotonne project leverages sub-USD 0.03/kWh solar power and port proximity to serve Asia and Africa. Africa remains an emerging market, with Egypt and Morocco investigating smelter-enabled UMG pathways linked to domestic solar goals.
- Asia Silicon (Qinghai) Co. Ltd
- DAQO NEW ENERGY CO. LTD
- GCL-TECH
- Hemlock Semiconductor Operations LLC and Hemlock Semiconductor LLC
- Mitsubishi Polycrystalline Silicon America Corporation
- OCI Company Ltd
- Qatar Solar Technologies
- REC Silicon ASA
- Sichuan Yongxiang Co. Ltd (Tongwei)
- Tokuyama Corporation
- Tongwei Co., Ltd
- United Solar Polysilicon (FZC) SPC
- Wacker Chemie AG
- Xinte Energy Co. Ltd
Additional Benefits:
- The market estimate (ME) sheet in Excel format
- 3 months of analyst support
TABLE OF CONTENTS
1 Introduction
- 1.1 Study Assumptions and Market Definition
- 1.2 Scope of the Study
2 Research Methodology
3 Executive Summary
4 Market Landscape
- 4.1 Market Overview
- 4.2 Market Drivers
- 4.2.1 Massive global solar-PV build-out (utility-scale + distributed)
- 4.2.2 AI-driven semiconductor CAPEX super-cycle (3-nm and below nodes)
- 4.2.3 IRA-/Fit-for-55-driven polysilicon onshoring incentives
- 4.2.4 Next-gen N-type TOPCon/IBC cell demand for ultra-high-purity poly
- 4.2.5 Closed-loop silicon recycling economics reach grid parity (2030)
- 4.3 Market Restraints
- 4.3.1 Prolonged 2024-26 capacity overhang and sub-cash-cost pricing
- 4.3.2 UMG-Si substitution risk in low-spec PV segments
- 4.3.3 Western forced-labour audit rules on Xinjiang feedstock
- 4.4 Value Chain Analysis
- 4.5 Porter's Five Forces
- 4.5.1 Bargaining Power of Suppliers
- 4.5.2 Bargaining Power of Buyers
- 4.5.3 Threat of New Entrants
- 4.5.4 Threat of Substitutes
- 4.5.5 Degree of Competition
- 4.6 Technological Snapshot
5 Market Size and Growth Forecasts (Value)
- 5.1 By Production Process
- 5.1.1 Siemens (TCS-CVD)
- 5.1.2 Fluidized Bed Reactor (Silane-FBR)
- 5.1.3 Upgraded Metallurgical-Grade (UMG)
- 5.2 By End-user Industry
- 5.2.1 Solar Photovoltaics
- 5.2.1.1 Monocrystalline Solar Panel
- 5.2.1.2 Multicrystalline Solar Panel
- 5.2.2 Electronics and Semiconductors
- 5.2.1 Solar Photovoltaics
- 5.3 By Geography
- 5.3.1 Asia-Pacific
- 5.3.1.1 China
- 5.3.1.2 India
- 5.3.1.3 Japan
- 5.3.1.4 South Korea
- 5.3.1.5 Rest of Asia-Pacific
- 5.3.2 North America
- 5.3.2.1 United States
- 5.3.2.2 Canada
- 5.3.2.3 Mexico
- 5.3.3 Europe
- 5.3.3.1 Germany
- 5.3.3.2 United Kingdom
- 5.3.3.3 France
- 5.3.3.4 Italy
- 5.3.3.5 Rest of Europe
- 5.3.4 South America
- 5.3.4.1 Brazil
- 5.3.4.2 Argentina
- 5.3.4.3 Rest of South America
- 5.3.5 Middle East and Africa
- 5.3.5.1 Saudi Arabia
- 5.3.5.2 South Africa
- 5.3.5.3 Rest of Middle East and Africa
- 5.3.1 Asia-Pacific
6 Competitive Landscape
- 6.1 Market Concentration
- 6.2 Strategic Moves
- 6.3 Market Share (%)**/Ranking Analysis
- 6.4 Company Profiles (includes Global level Overview, Market level overview, Core Segments, Financials as available, Strategic Information, Market Rank/Share, Products and Services, Recent Developments)
- 6.4.1 Asia Silicon (Qinghai) Co. Ltd
- 6.4.2 DAQO NEW ENERGY CO. LTD
- 6.4.3 GCL-TECH
- 6.4.4 Hemlock Semiconductor Operations LLC and Hemlock Semiconductor LLC
- 6.4.5 Mitsubishi Polycrystalline Silicon America Corporation
- 6.4.6 OCI Company Ltd
- 6.4.7 Qatar Solar Technologies
- 6.4.8 REC Silicon ASA
- 6.4.9 Sichuan Yongxiang Co. Ltd (Tongwei)
- 6.4.10 Tokuyama Corporation
- 6.4.11 Tongwei Co., Ltd
- 6.4.12 United Solar Polysilicon (FZC) SPC
- 6.4.13 Wacker Chemie AG
- 6.4.14 Xinte Energy Co. Ltd
7 Market Opportunities and Future Outlook
- 7.1 White-Space and Unmet-Need Assessment
 多晶硅市场:2026-2032年全球市场预测(依产品、等级、製造流程、形态和应用划分)
 多晶硅市场规模、份额、趋势和预测:按製造技术、形态、应用和地区划分,2026-2034年
 2026年全球多晶硅市场报告
 多晶市场-全球产业规模、份额、趋势、机会与预测:按应用、地区和竞争格局划分,2021-2031年
 多晶硅市场规模、份额和趋势分析报告:按应用、地区和细分市场预测(2026-2033 年)
 多晶硅市场规模、份额及成长分析(按应用、製造技术及地区划分)-2026-2033年产业预测
 全球多晶硅市场规模(依生产方法、应用、最终用户、区域范围和预测)