


 |
市场调查报告书
商品编码
1910804
萤石:市场占有率分析、产业趋势与统计、成长预测(2026-2031)Fluorspar - Market Share Analysis, Industry Trends & Statistics, Growth Forecasts (2026 - 2031) |
||||||
※ 本网页内容可能与最新版本有所差异。详细情况请与我们联繫。
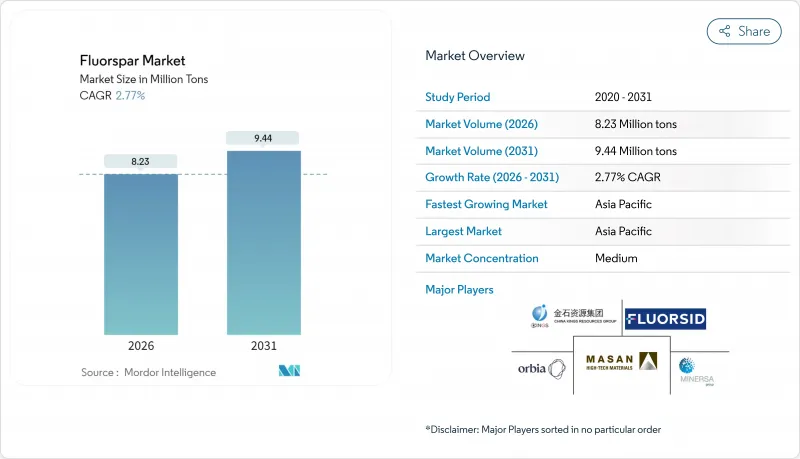
预计萤石市场将从 2025 年的 801 万吨增长到 2026 年的 823 万吨,到 2031 年将达到 944 万吨,2026 年至 2031 年的复合年增长率为 2.77%。
稳定的产量成长反映了该矿物在氢氟酸生产、钢铁和铝冶金以及氟聚合物製造等领域的强劲需求,同时电池、半导体和冷媒供应链也涌现出新的需求。中国仍是最大的供应国,占开采量的60%以上。中国的出口限制促使终端用户寻求多元化的供应来源,储备资源,并签署长期供应协议。
全球萤石市场趋势与洞察
氟化学品需求的快速成长推动了市场扩张。
低全球暖化潜势冷媒的出现推动了氢氟酸消费量的快速增长,科慕公司热感与特种解决方案部门2025年第二季度销售额环比增长25%便印证了这一点。美国《AIM法案》的实施时间表加快了高全球暖化潜势氟碳化合物的替代进程,欧盟相应的氟碳化合物法规也推动了欧洲类似的普及。电池市场的成长直接转化为对氟石的巨大需求,因为每辆电动车在黏合剂、冷却剂和电线涂层中大约需要30公斤酸性氟石当量。燃料电池膜和氢基础设施等氟聚合物应用将成为次要需求推动要素。工艺创新也值得关注。韩国一个研究团队透过先进的电化学方法将氟醚的产率提高了12至16个百分点,这显示每吨成品氟化学品的原料矿石消耗量有望降低。
新兴市场钢铁和铝产量快速成长
预计2024-2025财年印度粗钢产量将达1.51967亿吨,年增5.3%。国内消费量也在成长,推动了冶金萤石采购量增加,用于炉渣製备和脱硫。为响应沙乌地阿拉伯的“2030愿景”,波湾合作理事会(GCC)成员国的冶炼厂正在提高产能,利用低成本能源来提升铝产量,从而增加对氟化铝的需求。推动循环经济同样重要。 ScienceDirect的一项研究成功地从废弃冰晶石中提取出纯度高达85.6%的氟化铝(AlF3),显示在金属回收网络发达的地区,再生材料可以取代15-20%的原生酸性矿石需求。
环境法规增加了采矿业的合规成本。
美国环保署 (EPA) 的《联邦法规》第 40 篇第 436 部分规定,浮选萤石厂必须达到零排放标准,迫使业者投资 1,000 万至 1,500 万美元用于浆体浓缩机、压滤机和电脱水系统。中国的「2024 年安全宣传活动导致多家小规模矿场的许可证被吊销,至少减少了 12 万吨的产能,并加剧了全球供应紧张。蒙古工业中存在的童工问题导致经合组织 (OECD) 的买家被要求对其供应链审核,并在某些情况下支付认证溢价。同时,新近最终确定的 PFAS 饮用水标准(PFOA 和 PFOS 均为 4 ppt)扩大了对位于含水层附近的氟化工厂的监测要求。
细分市场分析
2025年,酸级萤石原料在萤石市场中占61.36%的份额,主要得益于纯度超过97%的CaF2规格,此规格是合成氢氟酸的关键原料。这种高纯度原料支撑了为冷冻、铝提炼和半导体蚀刻剂产业提供原料的化学品製造商的萤石市场规模。磨料级萤石的复合年增长率(CAGR)为4.23%,主要受雷射、光刻和空间感测器系统对光学透镜的需求所驱动。
製程改进提高了品位柔软性。中国湖南省一条新的浮选迴路将低品位矿石中的氟化钙含量从70%提高到95%,实质上将陶瓷级资源转化为酸性萤石原料。同样,墨西哥杜兰戈矿的加压浸出和溶剂萃取过程也提高了回收率。预计到2031年,北美酸性萤石供应量的成长将使中国在全球萤石贸易中的份额从54%下降到47%,从而促进萤石市场的适度多元化。
萤石市场报告按等级(酸性萤石、陶瓷萤石、冶金萤石、光学萤石、宝石萤石)、品种(蓝约翰萤石、氯辉石、钇辉石等)、应用领域(冶金、陶瓷、化学、其他)和地区(亚太、北美、欧洲、南美、中东和非洲)进行细分。市场预测以吨为单位。
区域分析
预计到2025年,亚太地区将占全球萤石市场总量的73.88%,并在2031年之前以2.95%的复合年增长率增长,这主要得益于中国在酸性萤石领域的领先地位以及印度钢铁产能的不断扩大。日本和韩国进口高纯度材料用于其电子和电动车供应链,其中韩国正在推广电化学氟化技术,以确保国内氟化学品的生产。
北美地区正从几乎完全依赖进口向部分自给自足过渡。犹他州的失落绵羊矿预计将于2026年供应6.5万吨萤石,约占美国进口量的10%。墨西哥是该地区的主要供应国,2024年出口量达1,23万吨,相当于美国酸性矿石进口量的74%。加拿大圣劳伦斯矿的重新投产预计将于2025年恢復生产,届时将进一步降低电池级氟化物的供应风险。
西班牙和南非在该地区供应原料,而肯亚目前禁止出口未经国内加工的原料。中东国家已将采矿业视为其经济支柱,沙乌地阿拉伯2024年对其《矿产法》的修订授予25年采矿许可证,鼓励外国投资其前景广阔的萤石矿床。
其他福利:
- Excel格式的市场预测(ME)表
- 3个月的分析师支持
目录
第一章 引言
- 研究假设和市场定义
- 调查范围
第二章调查方法
第三章执行摘要
第四章 市场情势
- 市场概览
- 市场驱动因素
- 对含氟化学品(低全球暖化潜值冷媒和含氟聚合物)的需求迅速成长
- 亚洲、中东和北非的钢铁和铝产量增加
- 锂离子电池超级工厂对电池级氟化铝的需求
- 半导体蚀刻气体需要超高纯度的酸液(报道不足)
- 西方「关键矿产」的(被低估的)回流
- 市场限制
- 采矿业更严格的环境和尾矿法规
- 中国的出口配额波动与运输瓶颈(瞒报)
- 氟硅酸替代HF(通报不足)
- 价值链分析
- 波特五力模型
- 新进入者的威胁
- 买方的议价能力
- 供应商的议价能力
- 替代品的威胁
- 竞争程度
第五章 市场规模与成长预测
- 按年级
- 酸级
- 陶瓷级
- 冶金级
- 光学级
- 抛光级
- 按类型
- 安托佐尼特
- 蓝约翰
- 氯仿
- 这是失败者
- 钇氟石
- 其他类型
- 透过使用
- 冶金
- 陶瓷
- 化学品
- 其他应用(光学、玻璃、水泥、涂料)
- 按地区
- 亚太地区
- 中国
- 印度
- 日本
- 韩国
- 马来西亚
- 泰国
- 印尼
- 越南
- 亚太其他地区
- 北美洲
- 美国
- 加拿大
- 墨西哥
- 欧洲
- 德国
- 英国
- 法国
- 义大利
- 西班牙
- 北欧国家
- 土耳其
- 俄罗斯
- 其他欧洲
- 南美洲
- 巴西
- 阿根廷
- 哥伦比亚
- 南美洲其他地区
- 中东和非洲
- 沙乌地阿拉伯
- 阿拉伯聯合大公国
- 卡达
- 奈及利亚
- 埃及
- 南非
- 其他中东和非洲地区
- 亚太地区
第六章 竞争情势
- 市场集中度
- 策略趋势
- 市占率(%)/排名分析
- 公司简介
- ARES Strategic Mining Inc.
- Chifeng Sky-Horse Fluorspar Mining Co., Ltd.
- China Kings Resources Group Co., Ltd.
- Erdenes Critical Minerals SOE
- Fluorsid
- Kenya Fluorspar Company Ltd.
- Luoyang Fengrui Fluorine Industry Co., Ltd.
- Masan High-Tech Materials Corporation
- MINERSA GROUP
- Orbia
- Sallies Industrial Minerals
- SepFluor
- Sinochem Group Co., Ltd.
- Steyuan Mineral Resources Group Ltd.
- Yingpeng Chemical Co., Ltd.
第七章 市场机会与未来展望
The Fluorspar market is expected to grow from 8.01 Million tons in 2025 to 8.23 Million tons in 2026 and is forecast to reach 9.44 Million tons by 2031 at 2.77% CAGR over 2026-2031.
Stable volume growth reflects the mineral's entrenched use in hydrofluoric-acid production, steel and aluminum metallurgy, and fluoropolymer manufacturing, even as new demand streams emerge from battery, semiconductor, and refrigerant supply chains. China remains the pivotal supplier, responsible for more than 60% of mined output, and its export-control posture is prompting end users to dual-source, stockpile, and enter long-term offtake contracts.
Global Fluorspar Market Trends and Insights
Fluorochemicals Demand Boom Drives Market Expansion
Low-global-warming-potential refrigerants are underpinning a steep rise in hydrofluoric-acid consumption, highlighted by Chemours' 25% sequential revenue jump in its Thermal and Specialized Solutions segment during Q2 2025. The U.S. AIM Act schedule is accelerating replacement of high-GWP HFCs, and parallel EU F-Gas rules are pushing similar adoption curves across Europe. Each electric vehicle uses roughly 30 kg of acid-spar equivalent in binders, coolants, and wire coatings, linking battery growth directly to bulk fluorspar demand. Fluoropolymer applications in fuel-cell membranes and hydrogen infrastructure add a secondary pull. Process innovation is also noteworthy: South Korean researchers lifted hydrofluoroether yield by 12-16 percentage points via an advanced electrochemical route, hinting at future reductions in raw-ore intensity per ton of finished fluorochemical.
Steel and Aluminum Production Surge in Emerging Markets
India's crude-steel output climbed to 151.967 million tons in fiscal 2024-25, up 5.3% year on year, while domestic consumption advanced, driving incremental metallurgical-grade fluorspar procurement for slag-conditioning and desulfurization. Gulf Cooperation Council smelters are scaling capacity under Saudi Vision 2030, leveraging low-cost energy to expand aluminum output and corresponding aluminum-fluoride demand. Circular-economy advances are equally material: a ScienceDirect study achieved 85.6% extraction of high-purity AlF3 from waste cryolite, indicating that secondary feedstock could displace 15-20% of primary acidspar needs in regions with robust metal recycling networks.
Environmental Regulations Increase Mining Compliance Costs
The U.S. Environmental Protection Agency's 40 CFR Part 436 now enforces zero-liquid-discharge standards for flotation-based fluorspar mills, compelling operators to invest USD 10-15 million in paste-thickening, filter-press, and electro-dewatering systems. China's 2024 safety campaign revoked several small-scale licenses, removing at least 120,000 tons of capacity and tightening world supply. Mongolia's sector faces child-labor red flags, obliging OECD buyers to audit supply chains and sometimes pay certification premiums. Meanwhile, newly finalized PFAS drinking-water limits at 4 ppt for PFOA and PFOS broaden monitoring obligations for fluorochemical sites near aquifers.
Other drivers and restraints analyzed in the detailed report include:
- Battery-Grade Aluminum Fluoride Demand Accelerates
- Semiconductor Industry Drives Ultra-Pure Acidspar Demand
- China Export Controls Create Supply Chain Vulnerabilities
For complete list of drivers and restraints, kindly check the Table Of Contents.
Segment Analysis
Acid-grade material retained a 61.36% fluorspar market share in 2025, anchored by more than or equal to 97% CaF2 specifications essential for hydrofluoric-acid synthesis. This high-purity bench underpins the fluorspar market size for chemical producers that serve refrigeration, aluminum-smelting, and semiconductor etchant channels. Lapidary grade is growing at a 4.23% CAGR on the back of optical-lens demand in laser, lithography, and space-borne sensor systems.
Process upgrades are unlocking grade flexibility. New flotation circuits in China's Hunan province raise low-grade ore from 70% to 95% CaF2, effectively converting ceramic-grade resource into acid-spar feed. Pressure-leaching followed by solvent extraction is similarly lifting recovery at Mexico's Durango mines. Through 2031, acid-grade supply additions in North America could trim the Chinese share of global fluorspar trade from 54% to 47%, modestly diversifying the fluorspar market.
The Fluorspar Report is Segmented by Grade (Acid Grade, Ceramic Grade, Metallurgical Grade, Optical Grade, and Lapidary Grade), Variety (Antozonite, Blue John, Chlorophane, Yttrocerite, and More), Application (Metallurgical, Ceramics, Chemicals, and Other Applications), and Geography (Asia-Pacific, North America, Europe, South America, and Middle-East and Africa). The Market Forecasts are Provided in Terms of Volume (Tons).
Geography Analysis
Asia-Pacific anchored 73.88% of the 2025 fluorspar market volume and is projected to expand at a 2.95% CAGR through 2031, fueled by Chinese acidspar dominance and expanding Indian steel capacity. Japan and South Korea import high-purity material for electronics and EV supply chains, with South Korea advancing electrochemical fluorination to secure indigenous fluorochemical production.
North America is transitioning from near-total import reliance toward partial self-sufficiency. Utah's Lost Sheep mine is slated to deliver 65,000 tons of acidspar in 2026, displacing roughly 10% of current U.S. inbound volumes. Mexico remains the region's workhorse, shipping 1.23 million tons in 2024, equal to 74% of U.S. acidspar imports. Canada's St. Lawrence mine revival will further ease supply risk for battery-grade fluoride once production resumes in 2025.
Spain and South Africa furnish regional material, while Kenyan policy now forbids raw export without in-country processing. Middle-Eastern governments are positioning mining as an economic pillar; Saudi Arabia's 2024 minerals law revision grants 25-year exploitation leases, catalyzing foreign investment in prospective fluorite deposits.
- ARES Strategic Mining Inc.
- Chifeng Sky-Horse Fluorspar Mining Co., Ltd.
- China Kings Resources Group Co., Ltd.
- Erdenes Critical Minerals SOE
- Fluorsid
- Kenya Fluorspar Company Ltd.
- Luoyang Fengrui Fluorine Industry Co., Ltd.
- Masan High-Tech Materials Corporation
- MINERSA GROUP
- Orbia
- Sallies Industrial Minerals
- SepFluor
- Sinochem Group Co., Ltd.
- Steyuan Mineral Resources Group Ltd.
- Yingpeng Chemical Co., Ltd.
Additional Benefits:
- The market estimate (ME) sheet in Excel format
- 3 months of analyst support
TABLE OF CONTENTS
1 Introduction
- 1.1 Study Assumptions and Market Definition
- 1.2 Scope of the Study
2 Research Methodology
3 Executive Summary
4 Market Landscape
- 4.1 Market Overview
- 4.2 Market Drivers
- 4.2.1 Fluorochemicals demand boom (low-GWP refrigerants and fluoropolymers)
- 4.2.2 Rising steel and aluminum output in Asia and MENA
- 4.2.3 Battery-grade aluminum-fluoride demand from Li-ion gigafactories
- 4.2.4 Semiconductor-etching gases require ultra-pure acidspar (under-reported)
- 4.2.5 Western "critical-mineral" onshoring incentives (under-reported)
- 4.3 Market Restraints
- 4.3.1 Stricter environmental and tailings rules on mining
- 4.3.2 China export-quota volatility and freight bottlenecks (under-reported)
- 4.3.3 Substitution by fluorosilicic-acid-derived HF (under-reported)
- 4.4 Value Chain Analysis
- 4.5 Porter's Five Forces
- 4.5.1 Threat of New Entrants
- 4.5.2 Bargaining Power of Buyers
- 4.5.3 Bargaining Power of Suppliers
- 4.5.4 Threat of Substitute Products
- 4.5.5 Degree of Competition
5 Market Size and Growth Forecasts (Volume)
- 5.1 By Grade
- 5.1.1 Acid Grade
- 5.1.2 Ceramic Grade
- 5.1.3 Metallurgical Grade
- 5.1.4 Optical Grade
- 5.1.5 Lapidary Grade
- 5.2 By Variety
- 5.2.1 Antozonite
- 5.2.2 Blue John
- 5.2.3 Chlorophane
- 5.2.4 Yttrocerite
- 5.2.5 Yttrofluorite
- 5.2.6 Other Varieties
- 5.3 By Application
- 5.3.1 Metallurgical
- 5.3.2 Ceramics
- 5.3.3 Chemicals
- 5.3.4 Other Applications (Optical, Glass, Cement, and Coatings)
- 5.4 By Geography
- 5.4.1 Asia-Pacific
- 5.4.1.1 China
- 5.4.1.2 India
- 5.4.1.3 Japan
- 5.4.1.4 South Korea
- 5.4.1.5 Malaysia
- 5.4.1.6 Thailand
- 5.4.1.7 Indonesia
- 5.4.1.8 Vietnam
- 5.4.1.9 Rest of Asia-Pacific
- 5.4.2 North America
- 5.4.2.1 United States
- 5.4.2.2 Canada
- 5.4.2.3 Mexico
- 5.4.3 Europe
- 5.4.3.1 Germany
- 5.4.3.2 United Kingdom
- 5.4.3.3 France
- 5.4.3.4 Italy
- 5.4.3.5 Spain
- 5.4.3.6 Nordic Countries
- 5.4.3.7 Turkey
- 5.4.3.8 Russia
- 5.4.3.9 Rest of Europe
- 5.4.4 South America
- 5.4.4.1 Brazil
- 5.4.4.2 Argentina
- 5.4.4.3 Colombia
- 5.4.4.4 Rest of South America
- 5.4.5 Middle-East and Africa
- 5.4.5.1 Saudi Arabia
- 5.4.5.2 United Arab Emirates
- 5.4.5.3 Qatar
- 5.4.5.4 Nigeria
- 5.4.5.5 Egypt
- 5.4.5.6 South Africa
- 5.4.5.7 Rest of Middle-East and Africa
- 5.4.1 Asia-Pacific
6 Competitive Landscape
- 6.1 Market Concentration
- 6.2 Strategic Moves
- 6.3 Market Share (%)/Ranking Analysis
- 6.4 Company Profiles (includes Global level Overview, Market level overview, Core Segments, Financials as available, Strategic Information, Market Rank/Share for key companies, Products and Services, and Recent Developments)
- 6.4.1 ARES Strategic Mining Inc.
- 6.4.2 Chifeng Sky-Horse Fluorspar Mining Co., Ltd.
- 6.4.3 China Kings Resources Group Co., Ltd.
- 6.4.4 Erdenes Critical Minerals SOE
- 6.4.5 Fluorsid
- 6.4.6 Kenya Fluorspar Company Ltd.
- 6.4.7 Luoyang Fengrui Fluorine Industry Co., Ltd.
- 6.4.8 Masan High-Tech Materials Corporation
- 6.4.9 MINERSA GROUP
- 6.4.10 Orbia
- 6.4.11 Sallies Industrial Minerals
- 6.4.12 SepFluor
- 6.4.13 Sinochem Group Co., Ltd.
- 6.4.14 Steyuan Mineral Resources Group Ltd.
- 6.4.15 Yingpeng Chemical Co., Ltd.
7 Market Opportunities and Future Outlook
- 7.1 White-space and Unmet-need Assessment
 全球冶金萤石市场按纯度等级、形态、应用和分销管道分類的预测(2026-2032 年)冶金萤石市场依纯度、产品形态、粒度、开采方法、终端用途产业及分销管道划分-2026年至2032年全球预测酸性氟化物粉末市场按等级、粒度、製造流程、物理形态、应用、终端用户产业和通路划分-2026年至2032年全球预测酸性萤石市场按类型、应用和通路- 全球预测(2026-2032 年)酸性萤石微粉市场依纯度等级、粒径、通路和应用划分-2026-2032年全球预测酸性萤石粉市场依等级、产品形态、应用及通路划分-2026-2032年全球预测
 萤石市场规模、份额和成长分析(按类型、应用、最终用途产业和地区划分)-2026-2033年产业预测
 萤石:全球市场占有率和排名、总销售量和需求预测(2025-2031年)萤石市场按原料类型、通路、产品类型、应用和最终用途产业划分-全球预测,2025-2032年
 萤石市场:依形态、产品、应用和地区划分,2026-2032 年