


 |
市场调查报告书
商品编码
1910810
硝酸:市占率分析、产业趋势与统计、成长预测(2026-2031)Nitric Acid - Market Share Analysis, Industry Trends & Statistics, Growth Forecasts (2026 - 2031) |
||||||
※ 本网页内容可能与最新版本有所差异。详细情况请与我们联繫。
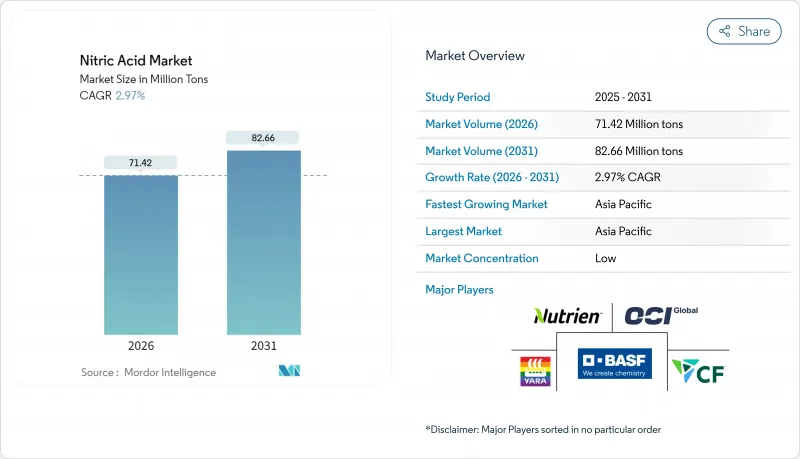
2025 年硝酸市场价值为 6,936 万吨,预计从 2026 年的 7,142 万吨增长到 2031 年的 8,266 万吨,在预测期(2026-2031 年)内复合年增长率为 2.97%。
对低碳氨的持续投资、不断增长的炸药需求以及化肥需求的强劲增长继续支撑着硝酸市场的基础,但不断上涨的环境监管成本和波动的天然气价格正在重塑成本结构。随着最佳可行技术应用环境(BAT-AEL)标准的日益严格,欧洲正迅速向绿色生产方式转型,而北美则正利用蓝氨计划来增强能源安全。那些及早整合碳捕获技术、可再生氢能和先进催化剂的公司,在商品价格波动的情况下,利润率更具韧性。
全球硝酸市场趋势及展望
欧洲对低碳硝酸铵肥料的需求激增
欧洲化肥生产商正转向使用可再生氢,以满足欧盟可再生能源指令III的要求,即到2030年,42%的氢气原料必须来自可再生。领先成功取得绿色原料的企业受供应衝击的影响较小,并且可以与寻求减少范围3排放的食品零售连锁店签订销售协议。领先的生产商正透过推进大规模碳捕获与封存(CCS)计划来应对这项挑战,其中Yarra公司位于Slaithkill的CCS设施预计将于2026年投入运营,届时将显着减少范围1排放。这种转型正在加深硝酸市场与欧盟气候目标之间的联繫,并推动绿色氨走廊地区新的合资企业的成立。
扩大聚酰胺6,6的应用以满足欧盟汽车轻量化目标
欧盟乘用车二氧化碳排放限值(95克/公里)正推动高性能聚合物取代金属。聚酰胺6,6可减轻高达40%的重量,从而在不牺牲结构强度的前提下提升电动车的续航里程。由于己二酸(一种硝酸衍生物)是聚酰胺6,6的关键前体,因此向聚酰胺6,6的转变将增加当地对硝酸的需求。供应链正集中于高纯度硝酸,宇部兴产计画提高电子级硝酸的产量,以满足聚合物製造商的需求。一级汽车供应商正与硝酸生产商协调签订长期树脂采购协议,以确保在更严格的欧7排放标准实施之前,原材料的品质稳定且供应充足。
欧盟收紧N2O排放法规(BAT-AEL)将推高资本投资和营运成本。
欧盟委员会正在修订《最佳可行技术环境标准文件》(LVIC BREF),预计将降低氧化亚氮排放标准。这将迫使老旧设施进行维修或安装新的排放控制设备。安装二次催化剂系统或三次裂解装置每条生产线需要超过800万美元的资本投资,这可能会挤压中型工厂的利润空间。拥有整合碳捕集与封存(CCS)技术和先进燃烧器的营运商,例如BOC有限公司的二氧化碳捕集与液化装置,在竞标长期供应合约时享有成本优势。这种政策环境正在加速工厂关闭和资产更新,导致硝酸市场向拥有雄厚财力进行合规投资的顶级生产商集中。
细分市场分析
到2025年,弱硝酸将占据57.45%的市场份额,这反映了其在肥料和中间体应用领域的广泛用途。此细分市场受益于较低的腐蚀控製成本,并允许生产商以最小的升级改造运作单一单压迴路。随着欧洲强制要求使用依赖弱酸中和的控制释放肥料,弱硝酸市场规模预计将稳定成长。
浓硝酸市占率位居第二,受炸药和电子产品需求成长的推动,其复合年增长率(CAGR)达到3.48%。宇部兴产株式会社在山口县等地扩建高纯度生产线,旨在抢占特种产品市场的溢价。发烟硝酸虽然属于小众市场,但在航太推进领域占有重要的战略地位。
硝酸市场按浓度(稀硝酸(低于 68%)、浓硝酸(68-98%)、烟/红烟(高于 98%))、终端用户行业(化肥、化学品製造、炸药、航太、油墨、颜料和染料、其他终端用户行业)和地区(亚太地区、北美、欧洲、南美、中东和非洲)进行细分。
区域分析
2025年,亚太地区将占据全球硝酸市场57.60%的份额,年复合成长率达3.62%,主要得益于重工业、化肥使用和电子製造业的同步成长。随着环保检验推动老旧设施的催化剂升级,中国持续投资于硝酸中间体。迪帕克化肥公司在印度的达赫杰计划每年将新增45万吨总产能,协助印度提高硝酸自给率并减少净进口量。
在欧洲,由于能源成本高昂和排放法规严格,市场占有率持续下降。更严格的BAT-AEL标准迫使获利能力的生产商进行升级改造或退出市场,导致BASF和雅苒等大型综合企业进行生产整合。北美则受惠于丰富的页岩气和正在发展的蓝氨产业。 OCI位于博蒙特的工厂将建立一条低碳供应路线,并从2025年开始向墨西哥湾沿岸的硝酸和硝酸盐工厂供货。
南美洲持续面临结构性氮肥短缺问题,巴西95%的需求依赖进口。随着大豆生产商寻求出口优质认证,绿色肥料的使用正在增加。然而,汇率波动和基础设施瓶颈限制了硝酸盐生产能力的即时投资。
其他福利:
- Excel格式的市场预测(ME)表
- 3个月的分析师支持
目录
第一章 引言
- 研究假设和市场定义
- 调查范围
第二章调查方法
第三章执行摘要
第四章 市场情势
- 市场概览
- 市场驱动因素
- 欧洲对低碳硝酸铵肥料的需求激增
- 根据欧盟汽车轻量化目标,扩大聚酰胺6,6(己二酸衍生物)的使用。
- 印度硝酸盐製药丛集的政府激励措施,鼓励建造现场弱硝酸装置。
- 爆炸物製造业的需求不断增长
- 市场限制
- 由于欧盟加强了最佳可行技术应用环境 (BAT-AEL),N2O排放法规收紧,这将增加资本支出 (Capex) 和营运支出 (Opex)。
- 天然气价格波动对氨製硝酸利润率带来压力
- 硝酸造成的健康危害
- 价值链分析
- 波特五力模型
- 供应商的议价能力
- 买方的议价能力
- 新进入者的威胁
- 替代品的威胁
- 竞争对手之间的竞争
- 贸易流量分析
- 成本分析
第五章 市场规模和成长预测(价值和数量)
- 按字段
- 稀硝酸(浓度低于68%)
- 浓硝酸(68-98%)
- 发烟/红烟(98%或以上)
- 按最终用户行业划分
- 肥料
- 化学製造
- 霹雳
- 航太
- 墨水、颜料、染料
- 其他终端用户产业(製药和食品加工)
- 按地区
- 亚太地区
- 中国
- 印度
- 日本
- 韩国
- 印尼
- 马来西亚
- 越南
- 泰国
- 亚太其他地区
- 北美洲
- 美国
- 加拿大
- 墨西哥
- 欧洲
- 德国
- 英国
- 法国
- 义大利
- 西班牙
- 俄罗斯
- 土耳其
- 北欧国家
- 其他欧洲地区
- 南美洲
- 巴西
- 阿根廷
- 哥伦比亚
- 南美洲其他地区
- 中东和非洲
- 沙乌地阿拉伯
- 阿拉伯聯合大公国
- 卡达
- 奈及利亚
- 埃及
- 南非
- 其他中东和非洲地区
- 亚太地区
第六章 竞争情势
- 市场集中度
- 策略性倡议(併购、合资、产能扩充、技术许可)
- 市占率分析
- 公司简介
- Asahi Kasei Corporation
- BASF
- Borealis AG
- CF Industries Holdings, Inc.
- DFPCL
- ENAEX
- EuroChem Group
- Gujarat Narmada Valley Fertilizers & Chemicals Limited
- Hanwha Group
- TKG HUCHEMS
- INEOS
- Incitec Pivot Fertilisers Pty Ltd
- LSB Industries
- MAXAMCORP HOLDING, SL
- Mitsubishi Chemical Group Corporation
- Nutrien
- OCI Global
- Orica Limited
- Sasol
- China Petrochemical Corporation
- Sumitomo Chemical Co., Ltd.
- Yara
- UBE Corporation
第七章 市场机会与未来展望
The Nitric Acid Market was valued at 69.36 Million tons in 2025 and estimated to grow from 71.42 Million tons in 2026 to reach 82.66 Million tons by 2031, at a CAGR of 2.97% during the forecast period (2026-2031).
Sustained investments in low-carbon ammonia, widening explosives demand, and strong fertilizer offtake continue to anchor the nitric acid market, yet rising environmental compliance costs and volatile gas prices are reshaping cost curves. Europe is moving quickly toward green production methods as BAT-AEL standards tighten, while North America leverages blue ammonia projects to improve energy security. Early movers integrating carbon capture, renewable hydrogen, and advanced catalysts are gaining margin resilience as commodity price swings intensify.
Global Nitric Acid Market Trends and Insights
Surging Demand for Low-Carbon Ammonium-Nitrate Fertilisers Across Europe
Europe's fertilizer producers are pivoting toward renewable hydrogen to satisfy the Renewable Energy Directive III requirement that 42% of hydrogen input be renewable by 2030. Early adopters with secured green feedstock face fewer supply shocks and can lock in offtake agreements with food-retail chains seeking lower scope-3 emissions. Leading producers have responded by advancing large-scale CCS projects, with Yara's 2026 Sluiskil CCS facility expected to materially lower Scope 1 emissions. The shift deepens the link between the nitric acid market and the European Union's climate targets, encouraging new joint ventures in green ammonia corridors.
Rising Adoption of Polyamide 6,6 for EU Automotive Lightweighting Targets
The EU passenger-car CO2 cap of 95 g/km is intensifying the substitution of metals with high-performance polymers. Polyamide 6,6 delivers up to 40% weight savings, improving EV range without compromising structural integrity. Because adipic acid, a nitric acid derivative, remains the main precursor, every incremental shift to polyamide 6,6 boosts regional nitric acid demand. Supply chains are refocusing on high-purity grades, prompting planned capacity additions by UBE Corporation for electronic-grade nitric acid to serve polymer producers. Automotive Tier-1 suppliers are aligning long-term resin offtake contracts with nitric acid producers to secure consistent quality and feedstock reliability ahead of stricter Euro 7 regulations.
EU BAT-AEL Tightening for N2O Emissions Raising Capex and Opex
The European Commission's ongoing revision of the LVIC BREF sets lower nitrous oxide benchmarks, compelling retrofits or new abatement installations across aging assets. Capital requirements for secondary-catalyst systems or tertiary destruction units can exceed USD 8 million per line, eroding margins on middle-aged plants. Operators with integrated CCS or advanced burners, such as BOC Limited's CO2 Recovery and Liquefaction plant, enjoy a cost advantage when bidding long-term supply contracts. The policy environment accelerates plant closures or asset swaps, consolidating the nitric acid market around top-tier producers with balance-sheet capacity for compliance investments.
Other drivers and restraints analyzed in the detailed report include:
- Government Incentives for On-Site Weak Nitric Acid Plants in Indian Pharma Clusters
- Increasing Demand from Explosives Manufacturing
- Volatile Natural Gas Prices Squeezing Ammonia-to-Nitric-Acid Margins
For complete list of drivers and restraints, kindly check the Table Of Contents.
Segment Analysis
Weak nitric acid commanded 57.45% of the market share in 2025, reflecting its versatility in fertilizer and intermediate applications. The segment benefits from lower corrosion management expenses, enabling producers to operate single mono-pressure loops with minimal upgrading. The nitric acid market size tied to weak grades is expected to advance steadily as Europe mandates controlled nitrate release fertilizers that rely on weak acid neutralization.
Concentrated nitric acid, accounting for the next-largest volume slice, is gaining momentum at a 3.48% CAGR on the back of rising explosives and electronics requirements. Capacity additions in high-purity lines, notably UBE's expansion in Yamaguchi Prefecture, aim to capture specialty segment premiums. Fuming nitric acid remains niche yet strategically significant for aerospace propulsion.
The Nitric Acid Market Segments the Industry by Concentration (Weak Nitric Acid (less Than or Equal To 68%), Concentrated Nitric Acid (68 To 98%), and Fuming/Red Fuming (more Than 98%)), End-User Industry (Fertilizers, Chemical Manufacturing, Explosives, Aerospace, Inks, Pigments, and Dyes, and Other End-User Industries), and Geography (Asia-Pacific, North America, Europe, South America, and Middle-East and Africa).
Geography Analysis
Asia-Pacific commands 57.60% of the nitric acid market in 2025 and is expanding at 3.62% CAGR as heavy industry, fertilizer usage, and electronics manufacturing grow in tandem. China continues to invest in nitric-based intermediates, though environmental inspections are pushing older units toward catalytic upgrades. India's Dahej project by Deepak Fertilisers adds 450 KTPA combined capacity, lifting the country's self-reliance ratio and reducing net imports.
Europe's share continues to shrink under high energy costs and stringent emission controls. The tightening BAT-AEL limits will push marginal producers either to retrofit or exit, consolidating output among integrated giants such as BASF and Yara. North America benefits from abundant shale gas and evolving blue ammonia ventures. OCI's Beaumont facility adds a low-carbon supply corridor that feeds Gulf Coast nitric and nitrate plants from 2025.
South America remains structurally short on nitrogen, with 95% of Brazil's needs met via imports. Green-fertilizer uptake is rising as soybean producers pursue premium export certifications. However, currency volatility and infrastructure bottlenecks restrict immediate capacity investments in nitric acid.
- Asahi Kasei Corporation
- BASF
- Borealis AG
- CF Industries Holdings, Inc.
- DFPCL
- ENAEX
- EuroChem Group
- Gujarat Narmada Valley Fertilizers & Chemicals Limited
- Hanwha Group
- TKG HUCHEMS
- INEOS
- Incitec Pivot Fertilisers Pty Ltd
- LSB Industries
- MAXAMCORP HOLDING, SL
- Mitsubishi Chemical Group Corporation
- Nutrien
- OCI Global
- Orica Limited
- Sasol
- China Petrochemical Corporation
- Sumitomo Chemical Co., Ltd.
- Yara
- UBE Corporation
Additional Benefits:
- The market estimate (ME) sheet in Excel format
- 3 months of analyst support
TABLE OF CONTENTS
1 Introduction
- 1.1 Study Assumptions and Market Definition
- 1.2 Scope of the Study
2 Research Methodology
3 Executive Summary
4 Market Landscape
- 4.1 Market Overview
- 4.2 Market Drivers
- 4.2.1 Surging Demand for Low-Carbon Ammonium-Nitrate Fertilisers Across Europe
- 4.2.2 Rising Adoption of Polyamide 6,6 (Adipic-Acid Derivative) for EU Automotive Lightweighting Targets
- 4.2.3 Government Incentives for On-Site Weak Nitric-Acid Plants in Indian Nitrate-Based Pharma Clusters
- 4.2.4 Increasing Demand from Explosives Manufacturing
- 4.3 Market Restraints
- 4.3.1 EU BAT-AEL Tightening for N?O Emissions Raising Capex and Opex
- 4.3.2 Volatile Natural-Gas Prices Squeezing Ammonia-to-Nitric-Acid Margins
- 4.3.3 Health Hazards Caused by Nitric Acid
- 4.4 Value Chain Analysis
- 4.5 Porter's Five Forces
- 4.5.1 Bargaining Power of Suppliers
- 4.5.2 Bargaining Power of Buyers
- 4.5.3 Threat of New Entrants
- 4.5.4 Threat of Substitutes
- 4.5.5 Intensity of Competitive Rivalry
- 4.6 Trade Flow Analysis
- 4.7 Cost Analysis
5 Market Size and Growth Forecasts (Value and Volume)
- 5.1 By Concentration
- 5.1.1 Weak Nitric Acid (less than or equal to 68%)
- 5.1.2 Concentrated Nitric Acid (68 to 98%)
- 5.1.3 Fuming/Red Fuming (more than 98%)
- 5.2 By End-user Industry
- 5.2.1 Fertilisers
- 5.2.2 Chemical Manufacturing
- 5.2.3 Explosives
- 5.2.4 Aerospace
- 5.2.5 Inks, Pigments and Dyes
- 5.2.6 Other End-user Industries (Pharmaceuticals and Food Processing)
- 5.3 By Geography
- 5.3.1 Asia-Pacific
- 5.3.1.1 China
- 5.3.1.2 India
- 5.3.1.3 Japan
- 5.3.1.4 South Korea
- 5.3.1.5 Indonesia
- 5.3.1.6 Malaysia
- 5.3.1.7 Vietnam
- 5.3.1.8 Thailand
- 5.3.1.9 Rest of Asia-Pacific
- 5.3.2 North America
- 5.3.2.1 United States
- 5.3.2.2 Canada
- 5.3.2.3 Mexico
- 5.3.3 Europe
- 5.3.3.1 Germany
- 5.3.3.2 United Kingdom
- 5.3.3.3 France
- 5.3.3.4 Italy
- 5.3.3.5 Spain
- 5.3.3.6 Russia
- 5.3.3.7 Turkey
- 5.3.3.8 Nordic
- 5.3.3.9 Rest of Europe
- 5.3.4 South America
- 5.3.4.1 Brazil
- 5.3.4.2 Argentina
- 5.3.4.3 Colombia
- 5.3.4.4 Rest of South America
- 5.3.5 Middle-East and Africa
- 5.3.5.1 Saudi Arabia
- 5.3.5.2 United Arab Emirates
- 5.3.5.3 Qatar
- 5.3.5.4 Nigeria
- 5.3.5.5 Egypt
- 5.3.5.6 South Africa
- 5.3.5.7 Rest of Middle-East and Africa
- 5.3.1 Asia-Pacific
6 Competitive Landscape
- 6.1 Market Concentration
- 6.2 Strategic Moves (Mergers and Acquisitions, JVs, Capacity Expansions, Tech Licensing)
- 6.3 Market Share Analysis
- 6.4 Company Profiles (includes Global level Overview, Market level overview, Core Segments, Financials as available, Strategic Information, Market Rank/Share, Products and Services, Recent Developments)
- 6.4.1 Asahi Kasei Corporation
- 6.4.2 BASF
- 6.4.3 Borealis AG
- 6.4.4 CF Industries Holdings, Inc.
- 6.4.5 DFPCL
- 6.4.6 ENAEX
- 6.4.7 EuroChem Group
- 6.4.8 Gujarat Narmada Valley Fertilizers & Chemicals Limited
- 6.4.9 Hanwha Group
- 6.4.10 TKG HUCHEMS
- 6.4.11 INEOS
- 6.4.12 Incitec Pivot Fertilisers Pty Ltd
- 6.4.13 LSB Industries
- 6.4.14 MAXAMCORP HOLDING, SL
- 6.4.15 Mitsubishi Chemical Group Corporation
- 6.4.16 Nutrien
- 6.4.17 OCI Global
- 6.4.18 Orica Limited
- 6.4.19 Sasol
- 6.4.20 China Petrochemical Corporation
- 6.4.21 Sumitomo Chemical Co., Ltd.
- 6.4.22 Yara
- 6.4.23 UBE Corporation
7 Market Opportunities and Future Outlook
- 7.1 White-space and Unmet-Need Assessment
- 7.2 Technological Developments in Nitric Acid Manufacturing and Recent Government Incentives
 2026年全球硝酸市场报告
 亚硝酸盐市场按形态、亚硝酸盐试剂、等级、应用和最终用户划分-全球预测,2026-2032年异丁基亚硝酸盐市场按产品类型、应用、最终用户和分销管道划分,全球预测(2026-2032年)
 亚硝酸钠市场规模、份额及成长分析(按等级类型、应用和地区划分)-2026-2033年产业预测
 硝酸市场规模、份额及成长分析(按应用、终端用户产业及地区划分)-2026-2033年产业预测
 全球硝酸市场:预测至2032年-按等级、浓度、应用、最终用户和地区分類的分析亚硝酸钠市场按应用、终端用户产业、等级、形态和分销管道划分-2025-2032年全球预测硝酸市场(按纯度、形态、包装、应用和分销管道)—2025-2032 年全球预测
 硝酸市场-全球产业规模、份额、趋势、机会及预测,依工厂类型、销售通路、最终用途、地区及竞争情况细分,2020-2030 年预测
 硝酸市场:2025-2030年预测