


 |
市场调查报告书
商品编码
1910811
二氧化硅:市场占有率分析、产业趋势与统计、成长预测(2026-2031)Silica - Market Share Analysis, Industry Trends & Statistics, Growth Forecasts (2026 - 2031) |
||||||
※ 本网页内容可能与最新版本有所差异。详细情况请与我们联繫。
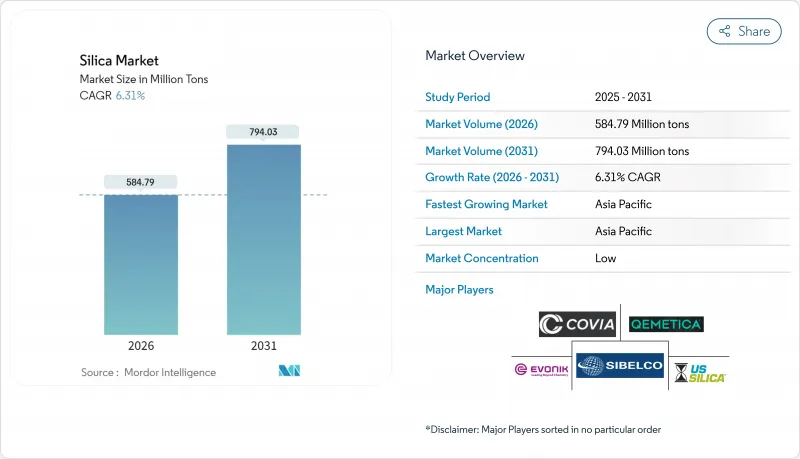
二氧化硅市场预计将从 2025 年的 5.5008 亿吨增长到 2026 年的 5.8479 亿吨,并预计到 2031 年将达到 7.9403 亿吨,2026 年至 2031 年的复合年增长率为 6.31%。
这一强劲成长反映了二氧化硅在建筑材料、节能轮胎、太阳能玻璃和半导体基板等领域的核心地位。亚太地区基础设施投资的增加、全球范围内低滚动阻力轮胎的日益普及以及太阳能光伏发电装置的加速扩张,都在推动市场需求;同时,特种级二氧化硅供应商通过提供高纯度和表面改性产品,获得了更高的溢价。儘管运输成本波动和职业健康法规在一定程度上抑制了市场成长,但对生物基加工技术的投资以及区域选矿能力的提升,为二氧化硅市场的长期稳健发展提供了支撑。
全球二氧化硅市场趋势与洞察
节能环保轮胎对沉淀二氧化硅的需求强劲
低滚动阻力轮胎可提高燃油经济性3%至7%,而欧洲的轮胎效率标籤法规正在推动胎面配方中二氧化硅含量的增加。目前,高檔乘用车轮胎的沉淀二氧化硅含量高达每小时90英尺(phr),是2020年标准含量的两倍。商用车队也采用类似的配方以降低柴油成本,而电动车製造商则进一步推进这一趋势以延长续航里程。
太阳能玻璃製造能力持续扩大
每吉瓦太阳能发电需要1.5万至2万吨超白硅基玻璃,其铁含量低于120ppm。中国占全球太阳能玻璃产能的85%以上,并正将新建的浮法玻璃生产线与其自身的硅选矿厂结合,以确保原料品质。双面面板所需的更薄玻璃对纯度要求更高,从而推动了对先进选矿技术的投资。
来自铝硅酸盐和硅酸钙填充材的竞争威胁
煅烧黏土和偏高岭土产品在混凝土和聚合物复合材料中具有与普通二氧化硅相当的增强效果,价格却低25%。随着供应商投资于颗粒表面处理技术以缩小性能差距,微粉化硅酸铝在对成本敏感的建筑外加剂市场中的份额正在不断增长。
细分市场分析
至2025年,结晶级石英将占二氧化硅市场的99.15%,并在2031年之前以6.22%的复合年增长率成长。石英的热稳定性及其成熟的供应链使其成为混凝土、玻璃和铸造模具的重要材料。鳞石英和方硅石在高温陶瓷领域占据着一定的市场份额,但复杂的相变加工过程限制了其规模化生产。非晶级石英虽然产量较小,但在绿色轮胎化合物、高固态电池浆料和半导体化学机械抛光浆料等领域却能获得高价。专业供应商利用亲水和疏水錶面处理技术,在大量生产之外创造附加价值。
日益严格的环境法规正推动原料生产从开采的结晶质原料转向工程化非晶态原料,后者可降低吸入粉尘的风险。生物基稻壳二氧化硅满足了这项要求,同时也具有全生命週期碳减量优势,并且接近性亚洲轮胎製造地。对真空闪蒸反应器和低碱精炼生产线的投资,支持以小规模、高利润产品线为目标,而非追求小规模商品生产的策略。因此,二氧化硅市场将继续呈现两极化的局面,即高纯度、特定用途等级的二氧化硅与建筑用散装砂之间出现价格差异,预计到2030年,两者之间的价格差异将进一步扩大。
此二氧化硅市场报告按类型(非晶态(气相/热解法、水合二氧化硅)、晶态(石英、鳞石英、方硅石))、终端用户产业(建筑施工、页岩油气、玻璃製造、水处理及其他)和地区(亚太地区、北美地区、欧洲地区、南美洲地区、中东和非洲地区)进行细分。市场预测以公吨为单位。
区域分析
亚太地区将主导二氧化硅市场,预计到2025年将占据41.00%的市场份额,并在2031年之前以8.10%的复合年增长率成长。中国每年消耗超过2亿吨二氧化硅,用于建筑、太阳能玻璃和化工衍生,这得益于其战略储备和综合选矿设施。在印度,不断扩展的高速公路网络和智慧城市规划正在推动国内需求,而政府补贴则促进了稻壳二氧化硅产业的扩张,为当地轮胎工厂和出口市场提供产品。
北美在页岩支撑剂供应中占据中心地位,威斯康辛州、德克萨斯州和亚伯达的矿床均符合严格的抗裂强度标准。区域加工厂正在缩短墨西哥湾沿岸玻璃熔炉的供应链,而加拿大生产商则正在满足液化天然气建设和绿色氢能基础设施的需求。监管因素,特别是美国职业安全与健康管理局(OSHA)对可吸入二氧化硅的限制,正促使矿商转向湿法加工和封闭式加工系统,这虽然增加了资本支出,但降低了保险责任。
在欧洲,高附加价值需求稳定,主要来自德国、法国和英国。汽车和化学用户需要高纯度产品,而欧盟循环经济指令鼓励使用回收材料和生物基材料。东欧供应商,特别是Qemetica扩建后的波兰工厂,正利用接近性西欧原始设备製造商以及不断增长的土耳其和北非建筑市场的优势。对节能窑炉技术和现场太阳能发电的投资符合欧盟脱碳法规,并将为该地区的长期竞争力奠定基础。
其他福利:
- Excel格式的市场预测(ME)表
- 3个月的分析师支持
目录
第一章 引言
- 调查先决条件
- 调查范围
第二章调查方法
第三章执行摘要
第四章 市场情势
- 市场概览
- 市场驱动因素
- 节能型「绿色」轮胎对沉淀二氧化硅的需求强劲
- 太阳能玻璃製造能力持续扩大
- 高纯度二氧化硅在先进半导体製造流程的应用日益广泛
- 亚洲正在向生物基稻壳二氧化硅转型,以减少其碳足迹。
- 气相二氧化硅在高固态电池浆料中的快速应用
- 市场限制
- 来自铝硅酸盐和硅酸钙填料的竞争威胁
- 散装硅砂运输成本有波动。
- 收紧可吸入结晶质二氧化硅暴露限值(美国职业安全与健康管理局、欧盟)
- 价值链分析
- 波特五力模型
- 供应商的议价能力
- 买方的议价能力
- 新进入者的威胁
- 替代品的威胁
- 竞争程度
第五章 市场规模和成长预测(价值和数量)
- 按类型
- 不规律的
- 烟气/热解
- 水合作用
- 晶体
- 石英
- 鳞石英
- 方硅石
- 不规律的
- 按最终用户行业划分
- 建筑/施工
- 页岩油气
- 玻璃製造
- 水处理
- 其他的
- 按地区
- 亚太地区
- 中国
- 印度
- 日本
- 韩国
- 马来西亚
- 泰国
- 印尼
- 越南
- 亚太其他地区
- 北美洲
- 美国
- 加拿大
- 墨西哥
- 欧洲
- 德国
- 英国
- 法国
- 义大利
- 西班牙
- 俄罗斯
- 北欧国家
- 土耳其
- 其他欧洲地区
- 南美洲
- 巴西
- 阿根廷
- 哥伦比亚
- 南美洲其他地区
- 中东和非洲
- 沙乌地阿拉伯
- 南非
- 奈及利亚
- 卡达
- 阿拉伯聯合大公国
- 埃及
- 其他中东和非洲地区
- 亚太地区
第六章 竞争情势
- 市场集中度
- 策略趋势
- 市占率(%)/排名分析
- 公司简介
- AGSCO Corp
- AMS Applied Material Solutions
- Cabot Corporation
- China-Henan Huamei Chemical Co. Ltd
- Covia Holdings LLC
- Denka Company Limited
- Evonik Industries AG
- Heraeus Holding
- Kemitura Group
- Madhu Silica Pvt. Ltd
- Merck KGaA
- Mitsubishi Chemical Group Corporation
- Nouryon
- OCI Company Ltd
- QEMETICA
- Sibelco
- Tokuyama Corporation
- US Silica(Apollo Funds)
- WR Grace and Co.
- Wacker Chemie AG
第七章 市场机会与未来展望
The Silica market is expected to grow from 550.08 Million tons in 2025 to 584.79 Million tons in 2026 and is forecast to reach 794.03 Million tons by 2031 at 6.31% CAGR over 2026-2031.
This robust expansion mirrors the mineral's central role in construction materials, energy-efficient tires, solar glass, and semiconductor substrates. Rising infrastructure spending in Asia-Pacific, the global push for low-rolling-resistance tires, and accelerating photovoltaic build-outs are amplifying demand, while specialty-grade suppliers secure pricing premiums through high-purity and surface-modified offerings. Freight-cost volatility and occupational-health regulations temper growth, yet investment in bio-based processing and regional beneficiation reinforce a resilient long-term outlook for the silica market.
Global Silica Market Trends and Insights
Robust Demand for Precipitated Silica in Energy-Efficient Green Tires
Low-rolling-resistance tires improve fuel economy by 3-7%, and European regulations that mandate tire-efficiency labeling spur higher silica loadings in tread compounds. Premium passenger-car tires now contain up to 90 phr of precipitated silica, double typical 2020 levels. Commercial fleets adopt similar formulations to lower diesel costs, while electric-vehicle makers intensify the trend to extend driving range.
Ongoing Build-Out of Photovoltaic Glass Manufacturing Capacity
Each gigawatt of solar deployment requires 15,000-20,000 tons of ultra-clear silica-based glass with iron content below 120 ppm. China commands over 85% of global PV-glass capacity and is pairing new float-glass lines with captive silica-beneficiation plants to guarantee feedstock quality. Thinner bifacial-panel glass further tightens purity specifications, driving investment in advanced beneficiation.
Competitive Threat from Aluminosilicate and Calcium-Silicate Fillers
Calcined-clay and metakaolin products undercut commodity-grade silica by up to 25% while offering comparable reinforcement in concrete and polymer composites. Suppliers invest in particle-surface treatments that narrow historical performance gaps, with micronized aluminosilicates gaining share in cost-sensitive construction mixes.
Other drivers and restraints analyzed in the detailed report include:
- Rising Adoption of High-Purity Silica in Advanced Semiconductor Nodes
- Shift Toward Bio-Based Rice-Husk Silica in Asia to Cut Carbon Footprint
- Volatility in Freight Cost for Bulk Silica Sand
For complete list of drivers and restraints, kindly check the Table Of Contents.
Segment Analysis
Crystalline grades account for 99.15% of the silica market in 2025 and are expanding at a 6.22% CAGR through 2031. Quartz remains indispensable in concrete, glass, and foundry molds thanks to thermal stability and a well-established supply chain. Tridymite and cristobalite fill smaller high-temperature ceramics niches, but their complex phase-conversion processing limits scale. Amorphous grades, while minor by tonnage, command premium pricing in green-tire compounds, high-solids battery slurries, and semiconductor CMP slurries. Specialty suppliers leverage hydrophilic and hydrophobic surface treatments that capture value beyond bulk tonnage.
Elevated environmental scrutiny encourages migration from mined crystalline inputs toward engineered amorphous forms with lower respirable-dust risk. Bio-based rice-husk silica meets this requirement while offering life-cycle carbon savings and proximity to Asian tire-manufacturing centers. Investment in vacuum flash reactors and low-alkali purification lines underscores the strategy of targeting smaller, higher-margin parcels rather than chasing commodity volume. As a result, the silica market continues bifurcating into high-purity, application-specific grades and bulk construction sand, with pricing divergence expected to widen through 2030.
The Silica Report is Segmented by Type (Amorphous (Fumed/Pyrogenic, and Hydrated), Crystalline (Quartz, Tridymite, and Cristobalite)), End-User Industry (Building and Construction, Shale Oil and Gas, Glass Manufacturing, Water Treatment, and Others), and Geography (Asia-Pacific, North America, Europe, South America, and Middle-East and Africa). The Market Forecasts are Provided in Terms of Volume (Tons).
Geography Analysis
Asia-Pacific dominates the silica market with 41.00% share in 2025 and an 8.10% CAGR to 2031. China consumes over 200 million tons annually across construction, photovoltaic glass, and chemical derivatives, underpinned by strategic reserves and integrated beneficiation hubs. India's highway expansion and smart-city programs lift domestic demand, while government subsidies accelerate rice-husk silica ventures that feed both local tire plants and export outlets.
North America holds a pivotal position in shale proppant supply, with Wisconsin, Texas, and Alberta deposits meeting stringent crush-strength specifications. Regional processing plants shorten supply chains for Gulf Coast glass furnaces, while Canadian producers capture demand from LNG construction and green-hydrogen infrastructure. Regulatory drivers, notably OSHA respirable-silica limits, push miners toward wet-processing and enclosed-handling systems that boost capex but lower insurance liabilities.
Europe presents stable, value-added demand centered on Germany, France, and the United Kingdom. Automotive and chemical users specify high-purity grades, and EU circular-economy directives promote recycled and bio-based inputs. Eastern European suppliers, led by Qemetica's expanded Polish site, benefit from proximity to both Western OEMs and growing Turkish and North African construction markets. Investments in energy-efficient kiln technology and on-site solar arrays align with EU decarbonization rules, anchoring long-term regional competitiveness.
- AGSCO Corp
- AMS Applied Material Solutions
- Cabot Corporation
- China-Henan Huamei Chemical Co. Ltd
- Covia Holdings LLC
- Denka Company Limited
- Evonik Industries AG
- Heraeus Holding
- Kemitura Group
- Madhu Silica Pvt. Ltd
- Merck KGaA
- Mitsubishi Chemical Group Corporation
- Nouryon
- OCI Company Ltd
- QEMETICA
- Sibelco
- Tokuyama Corporation
- U.S. Silica (Apollo Funds)
- W.R. Grace and Co.
- Wacker Chemie AG
Additional Benefits:
- The market estimate (ME) sheet in Excel format
- 3 months of analyst support
TABLE OF CONTENTS
1 Introduction
- 1.1 Study Assumptions
- 1.2 Scope of the Study
2 Research Methodology
3 Executive Summary
4 Market Landscape
- 4.1 Market Overview
- 4.2 Market Drivers
- 4.2.1 Robust demand for precipitated silica in energy-efficient "green" tires
- 4.2.2 Ongoing build-out of photovoltaic glass manufacturing capacity
- 4.2.3 Rising adoption of high-purity silica in advanced semiconductor nodes
- 4.2.4 Shift toward bio-based rice-husk silica in Asia to cut carbon footprint
- 4.2.5 Rapid uptake of fumed silica in high-solids battery slurries
- 4.3 Market Restraints
- 4.3.1 Competitive threat from aluminosilicate and calcium-silicate fillers
- 4.3.2 Volatility in freight cost for bulk silica sand
- 4.3.3 Tightening respirable-crystalline-silica exposure limits (OSHA, EU)
- 4.4 Value Chain Analysis
- 4.5 Porter's Five Forces
- 4.5.1 Bargaining Power of Suppliers
- 4.5.2 Bargaining Power of Buyers
- 4.5.3 Threat of New Entrants
- 4.5.4 Threat of Substitutes
- 4.5.5 Degree of Competition
5 Market Size and Growth Forecasts (Value and Volume)
- 5.1 By Type
- 5.1.1 Amorphous
- 5.1.1.1 Fumed/Pyrogenic
- 5.1.1.2 Hydrated
- 5.1.2 Crystalline
- 5.1.2.1 Quartz
- 5.1.2.2 Tridymite
- 5.1.2.3 Cristobalite
- 5.1.1 Amorphous
- 5.2 By End-user Industry
- 5.2.1 Building and Construction
- 5.2.2 Shale Oil and Gas
- 5.2.3 Glass Manufacturing
- 5.2.4 Water Treatment
- 5.2.5 Others
- 5.3 By Geography
- 5.3.1 Asia-Pacific
- 5.3.1.1 China
- 5.3.1.2 India
- 5.3.1.3 Japan
- 5.3.1.4 South Korea
- 5.3.1.5 Malaysia
- 5.3.1.6 Thailand
- 5.3.1.7 Indonesia
- 5.3.1.8 Vietnam
- 5.3.1.9 Rest of Asia-Pacific
- 5.3.2 North America
- 5.3.2.1 United States
- 5.3.2.2 Canada
- 5.3.2.3 Mexico
- 5.3.3 Europe
- 5.3.3.1 Germany
- 5.3.3.2 United Kingdom
- 5.3.3.3 France
- 5.3.3.4 Italy
- 5.3.3.5 Spain
- 5.3.3.6 Russia
- 5.3.3.7 Nordic Countries
- 5.3.3.8 Turkey
- 5.3.3.9 Rest of Europe
- 5.3.4 South America
- 5.3.4.1 Brazil
- 5.3.4.2 Argentina
- 5.3.4.3 Colombia
- 5.3.4.4 Rest of South America
- 5.3.5 Middle-East and Africa
- 5.3.5.1 Saudi Arabia
- 5.3.5.2 South Africa
- 5.3.5.3 Nigeria
- 5.3.5.4 Qatar
- 5.3.5.5 United Arab Emirates
- 5.3.5.6 Egypt
- 5.3.5.7 Rest of Middle-East and Africa
- 5.3.1 Asia-Pacific
6 Competitive Landscape
- 6.1 Market Concentration
- 6.2 Strategic Moves
- 6.3 Market Share (%)/Ranking Analysis
- 6.4 Company Profiles (includes Global-level Overview, Market-level Overview, Core Segments, Financials, Strategic Information, Market Rank/Share, Products and Services, Recent Developments)
- 6.4.1 AGSCO Corp
- 6.4.2 AMS Applied Material Solutions
- 6.4.3 Cabot Corporation
- 6.4.4 China-Henan Huamei Chemical Co. Ltd
- 6.4.5 Covia Holdings LLC
- 6.4.6 Denka Company Limited
- 6.4.7 Evonik Industries AG
- 6.4.8 Heraeus Holding
- 6.4.9 Kemitura Group
- 6.4.10 Madhu Silica Pvt. Ltd
- 6.4.11 Merck KGaA
- 6.4.12 Mitsubishi Chemical Group Corporation
- 6.4.13 Nouryon
- 6.4.14 OCI Company Ltd
- 6.4.15 QEMETICA
- 6.4.16 Sibelco
- 6.4.17 Tokuyama Corporation
- 6.4.18 U.S. Silica (Apollo Funds)
- 6.4.19 W.R. Grace and Co.
- 6.4.20 Wacker Chemie AG
7 Market Opportunities and Future Outlook
- 7.1 White-space and Unmet-Need Assessment
 二氧化硅粉末市场:2026-2032年全球市场预测(依原料种类、等级、功能、粒径、纯度、通路和应用划分)
 2026年全球二氧化硅矿物补充剂市场报告
 全球二氧化硅粉末市场规模、份额、趋势和成长分析报告(2026-2034年)全球介孔二氧化硅市场规模、份额、趋势和成长分析报告(2026-2034)二氧化硅间隔微球市场(按产品类型、粒径、等级、表面处理、形态、应用和最终用途行业划分),全球预测,2026-2032年球形二氧化硅市场按产品类型、纯度等级、应用和最终用户产业划分-2026-2032年全球预测
 高分散性二氧化硅市场规模、份额及成长分析(依形态、功能、应用、最终用途及地区划分)-2026-2033年产业预测
 高纯度二氧化硅市场规模、份额和成长分析(按纯度、粒径、形貌、类型、应用、终端用户产业和地区划分)-2026-2033年产业预测
 二氧化硅市场规模、份额及成长分析(按类型、终端用户产业及地区划分)-2026-2033年产业预测
 二氧化硅粉末市场规模、份额和成长分析(按类型、应用、最终用途产业和地区划分)—产业预测(2026-2033 年)