


 |
市场调查报告书
商品编码
1910920
保险分析:市场占有率分析、产业趋势与统计、成长预测(2026-2031)Insurance Analytics - Market Share Analysis, Industry Trends & Statistics, Growth Forecasts (2026 - 2031) |
||||||
※ 本网页内容可能与最新版本有所差异。详细情况请与我们联繫。
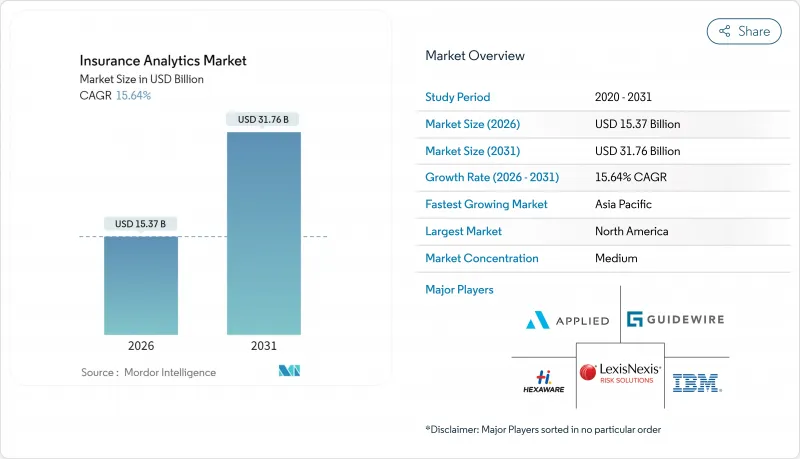
预计保险分析市场将从 2025 年的 132.9 亿美元成长到 2026 年的 153.7 亿美元,到 2031 年将达到 317.6 亿美元,2026 年至 2031 年的复合年增长率为 15.64%。
市场成长的驱动因素包括:监管机构对即时偿付能力报告的要求日益提高、物联网设备资料流的快速成长,以及保险公司简化承保和理赔流程的需求。对气候风险量化需求的增加、嵌入式保险伙伴关係的兴起以及云端工具的广泛应用,正在推动各种规模的公司采用人工智慧技术。现有技术供应商正寻求透过将生成式人工智慧直接嵌入核心系统来巩固市场份额,而新兴的参与企业则在诈欺预防、参数保险和健康型人寿保险承保等細項分析领域拓展业务。儘管持续的资料隐私法规和精算资料科学人才的短缺限制了市场成长,但保险分析市场仍然受益于人工智慧管治框架监管的清晰化,尤其是在北美和欧盟地区。
全球保险分析市场趋势与洞察
先进技术的应用日益普及
2024年,保险公司加速采用人工智慧技术,其中88%的汽车保险公司、70%的住宅保险公司和58%的人寿保险公司都转向了人工智慧驱动的营运。 IBM等供应商正在将产生模型融入核保和理赔工作流程,以实现理赔评估和最优提案的自动化。云端优先平台现在整合了电脑视觉、图论和大规模语言模型功能,可以处理非结构化图像、文字和感测器资料流,并将其转换为即时风险评分。从美国保险监督官协会(NAIC)到欧洲保险和职业退休金管理局(EIOPA)等监管机构都已表示,如果公司能够证明其公平性、透明度和董事会监督,他们将接受人工智慧的使用。因此,企业在人工智慧基础设施方面的支出激增,进一步推动了保险分析市场的发展。
保险公司之间的竞争日益加剧
凭藉人工智慧定价引擎的纯数位化新兴企业不断挤压现有保险公司的利润空间,迫使传统保险公司缩短产品週期并实现保险个人化。创业投资已转向全端式保险科技公司,这些公司利用即时资料撷取提供超短期和点对点保险产品。现有保险公司正透过收购和策略合作来应对,加速现代化进程,同时确保跨通路资料可见度。日益激烈的竞争正促使经营团队将工作重点从通路扩张转向分析差异化,加速模组化风险评分API和云端原生资料架构的需求。
严格的资料隐私和管治法规
欧盟人工智慧法规和GDPR将许多保险分析功能归类为高风险,要求进行可解释性评估、资料集文件编制和实施后监控。美国各州类似的监管规定要求保险公司提交风险管理模型认证,这延长了计划週期并增加了合规预算。跨国保险公司必须协调不同司法管辖区的管控措施,这推高了无法自动进行资料沿袭和偏差检测的分析平台的总体拥有成本。这些合规负担正在减缓分析平台的普及,尤其是在中小企业中,导致预期复合年增长率下降2.1个百分点。
细分市场分析
到2025年,工具类产品将占保险分析市场规模的90.1亿美元(67.79%),反映出保险公司优先考虑对其数据资产保持策略控制权。服务类产品虽然规模较小,但正以14.6%的复合年增长率成长,这主要得益于保险公司寻求人工智慧管治框架和多重云端优化的专家指导。儘管供应商正在整合低程式码模型管理仪表板和预先建置的风险库,但保险公司仍依赖系统整合商将这些功能改造到原有的核心系统中。向基于绩效的定价模式(即与赔付率改善挂钩的咨询费收费系统)的转变,进一步推动了服务类产品的成长。
拥有不同保单管理系统的公司倾向于选择资料策略研讨会、模型检验练习和监管报告自动化等服务,以避免高成本的平台重构;而规模较小的公司则喜欢提供内建指导的打包分析套件。这凸显了保险分析市场互补而非竞争的结构。
至2025年,理赔管理领域将占保险分析市场的34.12%,其核心是直通式处理引擎,可提高负责人的工作效率和顾客满意度。然而,随着保险公司部署异常检测网络,在几秒钟内识别可疑理赔,从而将损失成本降低两位数百分比,欺诈检测解决方案预计将以18.95%的复合年增长率增长。整合的影像取证和行为分析模组将进一步缩短调查週期,并为财务领导者带来令人信服的投资报酬率 (ROI) 数据。
成长动力也将来自以API为先导的诈欺侦测平台,这些平台能够与第三方资料仲介无缝集成,无需大规模内部工程即可增强风险讯号。在预测期内,基于机器学习的诈欺侦测工具将从先导计画走向企业标准,随着监管机构强制要求采取反诈欺措施,这将重塑保险分析市场格局。
保险分析市场报告按组件(工具和服务)、业务应用(理赔管理、风险管理等)、部署模式(本地部署、云端部署)、最终用户(保险公司等)、保险类型(人寿保险和健康保险、产物保险等)、组织规模(大型企业、中小企业等)和地区对行业进行细分。市场预测以以金额为准。
区域分析
预计到2025年,北美将以38.02%的收入份额领先保险分析市场。这主要得益于强劲的云端运算应用、雄厚的资本市场以及美国保险监理协会(NAIC)的人工智慧模型指令。该指令明确了监管方向,并加快了技术投资决策。美国保险公司受惠于成熟的保险科技资金筹措管道和便利的专业数据供应商资源,而加拿大公司则利用跨境技术伙伴关係,在无需相应增加员工人数的情况下扩展其分析能力。
亚太地区预计到2031年将以16.25%的复合年增长率成长,主要得益于中国、印度和东南亚地区数位保险渗透率的加速提升。该地区现有超大规模资料中心业者正与超大规模资料中心合作,快速推出按里程付费的汽车保险和短期旅游保险,这两种保险都依赖即时数据收集。新加坡和韩国政府透过提供监管沙盒和鼓励产品试验,为保险分析市场的发展创造了良好的环境。
儘管受到GDPR和欧盟人工智慧法规的严格合规要求约束,欧洲仍维持均衡成长。德国、法国和英国的保险公司正大力投资可解释人工智慧工具,以满足监管要求并从中提取洞察,用于承保分析。北欧保险公司在分析领域处于领先地位,正在试行气候情境生成工具和嵌入式保险编配层,这些工具和层有望在欧洲范围内广泛应用。
其他福利:
- Excel格式的市场预测(ME)表
- 3个月的分析师支持
目录
第一章 引言
- 研究假设和市场定义
- 调查范围
第二章调查方法
第三章执行摘要
第四章 市场洞察
- 市场概览
- 市场驱动因素
- 先进技术的应用日益普及
- 保险公司之间的竞争日益加剧
- 内部和外部资料流的数量不断增长
- 需要对气候风险进行量化。
- 扩展嵌入式保险生态系统
- 监理机关推动即时偿付能力报告
- 市场限制
- 严格的资料隐私和管治法规
- 网路安全和资料外洩问题日益令人担忧
- 精算资料科学人才短缺
- 供应商锁定和资料可携性限制
- 价值链分析
- 监管环境
- 技术展望
- 波特五力模型
- 供应商的议价能力
- 买方的议价能力
- 新进入者的威胁
- 替代品的威胁
- 竞争对手之间的竞争
- 产业生态系分析
- 主要用例和案例研究
- 宏观经济趋势评估
- 投资分析
第五章 市场区隔
- 按组件
- 工具
- 服务
- 透过业务应用
- 索赔管理
- 风险管理
- 诈欺检测与预防
- 流程优化
- 客户管理与个人化
- 透过部署模式
- 本地部署
- 云
- 最终用户
- 保险公司
- 政府机构
- 第三方管理机构、仲介和顾问公司
- 按保险类型
- 人寿保险和医疗保险
- 产物保险
- 车
- 专业
- 按组织规模
- 大公司
- 中小企业
- 按地区
- 北美洲
- 美国
- 加拿大
- 墨西哥
- 南美洲
- 巴西
- 阿根廷
- 哥伦比亚
- 南美洲其他地区
- 欧洲
- 德国
- 英国
- 法国
- 义大利
- 西班牙
- 俄罗斯
- 荷兰
- 其他欧洲地区
- 亚太地区
- 中国
- 日本
- 韩国
- 印度
- 澳洲
- 新加坡
- 亚太其他地区
- 中东和非洲
- 中东
- 沙乌地阿拉伯
- 阿拉伯聯合大公国
- 其他中东地区
- 非洲
- 南非
- 埃及
- 其他非洲地区
- 中东
- 北美洲
第六章 竞争情势
- 市场集中度
- 策略趋势
- 市占率分析
- 公司简介
- IBM Corporation
- Oracle Corporation
- SAP SE
- SAS Institute Inc.
- Microsoft Corporation
- Guidewire Software Inc.
- LexisNexis Risk Solutions(RELX plc)
- Hexaware Technologies Ltd.
- Applied Systems Inc.
- Sapiens International Corporation NV
- OpenText Corporation
- MicroStrategy Incorporated
- Verisk Analytics, Inc.
- Salesforce, Inc.(Tableau)
- Accenture plc
- Cognizant Technology Solutions Corp.
- BAE Systems plc
- Palantir Technologies Inc.
- Fair Isaac Corporation(FICO)
- DataRobot, Inc.
- Optum, Inc.(UnitedHealth Group)
第七章 市场机会与未来展望
The insurance analytics market is expected to grow from USD 13.29 billion in 2025 to USD 15.37 billion in 2026 and is forecast to reach USD 31.76 billion by 2031 at 15.64% CAGR over 2026-2031.
Market expansion is underpinned by mounting regulatory demands for real-time solvency reporting, rapid data-stream proliferation from IoT devices, and insurers' need to streamline underwriting and claims workflows. Heightened climate-risk quantification requirements, rising embedded-insurance partnerships, and the democratization of cloud tools have widened adoption across organization sizes. Incumbent technology vendors are defending share by embedding generative AI directly into core systems, while insurtech entrants scale niche analytics that target fraud, parametric cover, and wellness-based life underwriting. Persistent data-privacy obligations and a tightening actuarial-data-science talent pool temper growth, yet the insurance analytics market continues to benefit from regulators clarifying AI governance frameworks, especially in North America and the European Union.
Global Insurance Analytics Market Trends and Insights
Increased Adoption of Advanced Technologies
Insurers accelerated AI deployment in 2024, with 88% of auto, 70% of home, and 58% of life carriers moving toward AI-enabled operations. Vendors such as IBM embedded generative models into underwriting and claims workflows, enabling automated damage assessment and next-best-offer recommendations . Cloud-first platforms now package computer-vision, graph, and large-language-model capabilities that handle unstructured image, text, and sensor streams, converting them into real-time risk scores. Regulatory bodies from the NAIC to EIOPA signaled acceptance of AI usage when firms document fairness, transparency, and board oversight. Consequently, enterprise spending on AI-ready infrastructure rose sharply, further fueling the insurance analytics market.
Rise in Competition Among Insurers
Digital-only challengers armed with AI pricing engines continue to pressure incumbent margins, forcing traditional carriers to shorten product cycles and personalize coverage. Venture capital funding shifted toward full-stack insurtechs that leverage real-time data ingestion to launch micro-duration or peer-to-peer products. Incumbents responded through acquisitions and strategic partnerships that fast-track modernization while securing cross-channel data visibility. Competitive intensity has reoriented C-suite priorities from channel expansion to analytical differentiation, accelerating demand for modular risk-scoring APIs and cloud-native data fabrics.
Stringent Data-Privacy and Governance Regulations
The EU AI Act and GDPR classify many insurance analytics functions as high risk, mandating explainability assessments, dataset documentation, and post-deployment monitoring. Similar rulemaking in U.S. states obliges carriers to file model-risk-management attestations, extending project timelines and compliance budgets. Multinational carriers must harmonize controls across jurisdictions, driving up the total cost of ownership for analytics platforms that cannot automate lineage logging or bias detection. These compliance burdens slow deployment, particularly for smaller firms, and subtract 2.1 percentage points from forecast CAGR.
Other drivers and restraints analyzed in the detailed report include:
- Growing Volume of Internal and External Data Streams
- Climate-Risk Quantification Demands
- High Concern Over Cybersecurity and Data Breaches
For complete list of drivers and restraints, kindly check the Table Of Contents.
Segment Analysis
Tools contributed USD 9.01 billion to the insurance analytics market size in 2025, equating to 67.79% share and reflecting carriers' preference for retaining strategic control of data assets. Services, although smaller, are scaling at 14.6% CAGR as insurers seek expert guidance for AI-governance frameworks and multi-cloud optimization. Vendors integrate low-code model-management dashboards and pre-built risk libraries, but carriers still rely on systems integrators to retrofit these capabilities into legacy cores. The push toward outcome-based pricing, where consultancy fees hinge on loss-ratio improvements, further underpins services growth.
Enterprises with heterogeneous policy-administration stacks often choose services to avoid costly platform rewrites, engaging providers for data-strategy workshops, model-validation exercises, and regulatory-filing automation. Meanwhile, SMEs favor packaged analytics suites that offer embedded guidance, illustrating how services and tools complement rather than cannibalize each other in the insurance analytics market.
Claims management held a 34.12% insurance analytics market share in 2025, anchored by straight-through-processing engines that boost adjuster productivity and customer satisfaction metrics. Yet fraud detection solutions are projected to scale at a 18.95% CAGR, as carriers deploy anomaly-detection networks that flag suspicious claims within seconds, helping to cut loss costs by double-digit percentages. Integrated image-forensics and behavioral-analytics modules further compress investigation cycles, driving ROI narratives that appeal to finance chiefs.
Growth momentum also arises from API-first fraud platforms that connect seamlessly with third-party data brokers, enriching risk signals without extensive in-house engineering. Over the forecast period, machine-learning-based fraud utilities will migrate from pilot projects to enterprise standards, reshaping the insurance analytics market as regulatory bodies mandate anti-fraud controls.
Insurance Analytics Market Report Segments the Industry Into by Component (Tools and Services), Business Application (Claims Management, Risk Management, and More), Deployment Mode (On-Premise, Cloud), End-User (Insurance Companies, and More), Insurance Line (Life and Health, Property and Casualty, and More), Organization Size (Large Enterprises, and SMEs), and Geography. The Market Forecasts are Provided in Terms of Value (USD).
Geography Analysis
North America led the insurance analytics market with 38.02% revenue share in 2025, buoyed by robust cloud adoption, deep capital markets, and the NAIC's AI Model Bulletin, which provides regulatory clarity and accelerates tech-investment decisions. U.S. carriers benefit from mature insurtech funding pipelines and ready access to specialized data vendors, while Canadian firms leverage cross-border technology partnerships to extend analytic capabilities without proportional head-count increases.
Asia-Pacific is projected to post a 16.25% CAGR through 2031, driven by accelerating digital-insurance penetration in China, India, and Southeast Asia. Regional incumbents collaborate with hyper-scalers to launch pay-as-you-drive auto cover and micro-duration travel policies, both reliant on real-time data ingestion. Governments in Singapore and South Korea provide regulatory sandboxes that stimulate product experimentation, thereby fostering a fertile environment for insurance analytics market expansion.
Europe maintains balanced growth despite stringent GDPR and EU AI Act compliance requirements. Carriers in Germany, France, and the United Kingdom invest heavily in explainable-AI tooling to satisfy regulators while unlocking underwriting insights. Nordic insurers act as analytics bellwethers, piloting climate-scenario generators and embedded-insurance orchestration layers that could shape wider continental adoption.
- IBM Corporation
- Oracle Corporation
- SAP SE
- SAS Institute Inc.
- Microsoft Corporation
- Guidewire Software Inc.
- LexisNexis Risk Solutions (RELX plc)
- Hexaware Technologies Ltd.
- Applied Systems Inc.
- Sapiens International Corporation N.V.
- OpenText Corporation
- MicroStrategy Incorporated
- Verisk Analytics, Inc.
- Salesforce, Inc. (Tableau)
- Accenture plc
- Cognizant Technology Solutions Corp.
- BAE Systems plc
- Palantir Technologies Inc.
- Fair Isaac Corporation (FICO)
- DataRobot, Inc.
- Optum, Inc. (UnitedHealth Group)
Additional Benefits:
- The market estimate (ME) sheet in Excel format
- 3 months of analyst support
TABLE OF CONTENTS
1 INTRODUCTION
- 1.1 Study Assumptions and Market Definition
- 1.2 Scope of the Study
2 RESEARCH METHODOLOGY
3 EXECUTIVE SUMMARY
4 MARKET INSIGHTS
- 4.1 Market Overview
- 4.2 Market Drivers
- 4.2.1 Increased adoption of advanced technologies
- 4.2.2 Rise in competition among insurers
- 4.2.3 Growing volume of internal and external data streams
- 4.2.4 Climate-risk quantification demands
- 4.2.5 Embedded-insurance ecosystem expansion
- 4.2.6 Regulatory push toward real-time solvency reporting
- 4.3 Market Restraints
- 4.3.1 Stringent data-privacy and governance regulations
- 4.3.2 High concern over cybersecurity and data breaches
- 4.3.3 Actuarial-data-science talent gap
- 4.3.4 Vendor lock-in and data-portability limitations
- 4.4 Value Chain Analysis
- 4.5 Regulatory Landscape
- 4.6 Technological Outlook
- 4.7 Porter's Five Forces
- 4.7.1 Bargaining Power of Suppliers
- 4.7.2 Bargaining Power of Buyers
- 4.7.3 Threat of New Entrants
- 4.7.4 Threat of Substitutes
- 4.7.5 Competitive Rivalry
- 4.8 Industry Ecosystem Analysis
- 4.9 Key Use Cases and Case Studies
- 4.10 Assessment of Macroeconomic Trends
- 4.11 Investment Analysis
5 MARKET SEGMENTATION
- 5.1 By Component
- 5.1.1 Tools
- 5.1.2 Services
- 5.2 By Business Application
- 5.2.1 Claims Management
- 5.2.2 Risk Management
- 5.2.3 Fraud Detection and Prevention
- 5.2.4 Process Optimization
- 5.2.5 Customer Management and Personalization
- 5.3 By Deployment Mode
- 5.3.1 On-Premise
- 5.3.2 Cloud
- 5.4 By End-User
- 5.4.1 Insurance Companies
- 5.4.2 Government Agencies
- 5.4.3 Third-Party Administrators, Brokers and Consultancies
- 5.5 By Insurance Line
- 5.5.1 Life and Health
- 5.5.2 Property and Casualty
- 5.5.3 Auto
- 5.5.4 Specialty Lines
- 5.6 By Organization Size
- 5.6.1 Large Enterprises
- 5.6.2 Small and Medium Enterprises (SMEs)
- 5.7 By Geography
- 5.7.1 North America
- 5.7.1.1 United States
- 5.7.1.2 Canada
- 5.7.1.3 Mexico
- 5.7.2 South America
- 5.7.2.1 Brazil
- 5.7.2.2 Argentina
- 5.7.2.3 Colombia
- 5.7.2.4 Rest of South America
- 5.7.3 Europe
- 5.7.3.1 Germany
- 5.7.3.2 United Kingdom
- 5.7.3.3 France
- 5.7.3.4 Italy
- 5.7.3.5 Spain
- 5.7.3.6 Russia
- 5.7.3.7 Netherlands
- 5.7.3.8 Rest of Europe
- 5.7.4 Asia-Pacific
- 5.7.4.1 China
- 5.7.4.2 Japan
- 5.7.4.3 South Korea
- 5.7.4.4 India
- 5.7.4.5 Australia
- 5.7.4.6 Singapore
- 5.7.4.7 Rest of Asia-Pacific
- 5.7.5 Middle East and Africa
- 5.7.5.1 Middle East
- 5.7.5.1.1 Saudi Arabia
- 5.7.5.1.2 United Arab Emirates
- 5.7.5.1.3 Rest of Middle East
- 5.7.5.2 Africa
- 5.7.5.2.1 South Africa
- 5.7.5.2.2 Egypt
- 5.7.5.2.3 Rest of Africa
- 5.7.5.1 Middle East
- 5.7.1 North America
6 COMPETITIVE LANDSCAPE
- 6.1 Market Concentration
- 6.2 Strategic Moves
- 6.3 Market Share Analysis
- 6.4 Company Profiles (includes Global level Overview, Market level overview, Core Segments, Financials as available, Strategic Information, Market Rank/Share for key companies, Products and Services, and Recent Developments)
- 6.4.1 IBM Corporation
- 6.4.2 Oracle Corporation
- 6.4.3 SAP SE
- 6.4.4 SAS Institute Inc.
- 6.4.5 Microsoft Corporation
- 6.4.6 Guidewire Software Inc.
- 6.4.7 LexisNexis Risk Solutions (RELX plc)
- 6.4.8 Hexaware Technologies Ltd.
- 6.4.9 Applied Systems Inc.
- 6.4.10 Sapiens International Corporation N.V.
- 6.4.11 OpenText Corporation
- 6.4.12 MicroStrategy Incorporated
- 6.4.13 Verisk Analytics, Inc.
- 6.4.14 Salesforce, Inc. (Tableau)
- 6.4.15 Accenture plc
- 6.4.16 Cognizant Technology Solutions Corp.
- 6.4.17 BAE Systems plc
- 6.4.18 Palantir Technologies Inc.
- 6.4.19 Fair Isaac Corporation (FICO)
- 6.4.20 DataRobot, Inc.
- 6.4.21 Optum, Inc. (UnitedHealth Group)
7 MARKET OPPORTUNITIES AND FUTURE OUTLOOK
- 7.1 White-space and Unmet-Need Assessment
 保险分析市场报告:按组件、部署类型、企业规模、应用程式、最终用户和地区划分(2026-2034 年)
 2026年全球保险分析市场报告
 保险分析市场分析及预测(至 2035 年):按类型、产品、服务、技术、组件、应用、部署、最终用户和解决方案划分
 全球保险分析市场:市场规模、占有率、成长率、产业分析、依类型、应用和地区划分的分析及预测(2026-2034年)
 保险分析市场规模、份额和趋势分析报告:按组件、应用、部署、公司规模、最终用途、地区和细分市场预测,2026-2033 年日本保险分析市场报告(按组件、部署模式、企业规模、应用、最终用户和地区划分,2026-2034 年)
 保险分析市场规模、份额和成长分析(按部署模式、组件、应用、最终用户和地区划分)-2026-2033年产业预测
 全球保险分析市场(按保险类型、用例、部署模式、组织规模和最终用户划分)—2025-2032年全球预测
 2025-2029年全球保险分析市场
 全球保险分析市场:依组件、部署模式、应用、最终用户、地区、机会及预测,2018-2032