


 |
市场调查报告书
商品编码
1910924
许可证管理:市场份额分析、行业趋势和统计数据、成长预测(2026-2031 年)License Management - Market Share Analysis, Industry Trends & Statistics, Growth Forecasts (2026 - 2031) |
||||||
※ 本网页内容可能与最新版本有所差异。详细情况请与我们联繫。
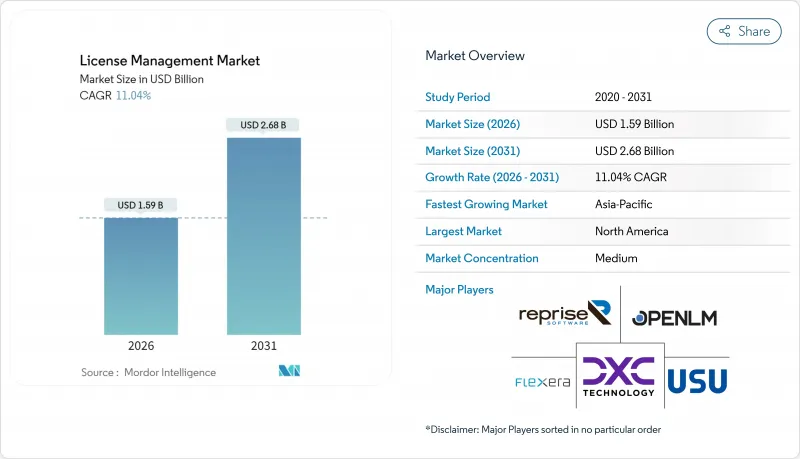
预计许可证管理市场将从 2025 年的 14.3 亿美元增长到 2026 年的 15.9 亿美元,并预计到 2031 年将达到 26.8 亿美元,2026 年至 2031 年的复合年增长率为 11.04%。
数位化加速、SaaS价格上涨以及欧盟《数位商业弹性法案》等新监管要求,正推动混合IT环境下对自动化管治的需求。日益严格的监管审查、更频繁的审核以及对即时成本管理的需求,正促使软体资产管治从支援职能提升至董事会层面的优先事项。供应商正透过平台整合、人工智慧驱动的发现功能以及基于订阅的经营模式来应对这些需求,帮助企业在降低合规风险的同时实现最佳化效益。同时,FinOps的日益普及以及未使用的授权成本不断攀升(据估计,大型企业每年为此付出1.273亿美元的代价),凸显了主动式授权智慧管理能够带来的实质成本节约。这些因素共同推动许可证管理市场在2030年之前持续成长。
全球许可证管理市场趋势与洞察
加速向SaaS和订阅式授权模式转型
从2023年到2025年,SaaS支出将成长31%,达到3,000亿美元,目前已占企业平均成本的25%。订阅续约、基于使用量的定价以及多级授权正促使采购团队实现许可流程自动化,以保持与时俱进。影响27%客户的「缩水式收费」做法,即透过细微的合约调整来掩盖价格上涨,因此,详细的使用情况洞察对于成本预测至关重要。正因如此,能够分析功能等级计费资料的云端原生平台在授权管理市场中日益普及。
供应商审核的频率和成本增加
受美国政府审核局 (GAO) 指出的公共部门收入缺口的影响,出版商正加大审核频率,以期恢復收入。混合云端的扩展增加了复杂性,传统的发现工具难以协调虚拟化、容器化和 SaaS 资产。因此,企业正在将更多合规预算分配给能够将发现功能、授权资料和合约逻辑整合到单一管理平台的解决方案。这种监管力度的加强推动了许可管理市场持续两位数的成长。
不透明的供应商特定授权条款和指标
频繁的指标调整(例如基于使用者、基于核心、基于使用情况等)会降低成本可见度。博通暂停向VMware销售一週的案例表明,供应商系统变更会如何扰乱客户的管治工作流程。企业需要耗费大量法律和技术精力来解读合约条款,从而延缓优化週期。这限制了缺乏专业咨询服务的中小型企业进入授权市场。
细分市场分析
到2025年,软体平台仍将占据许可证管理市场61.74%的份额,因为其核心的发现、标准化和匹配引擎仍然是管治营运的基础。这一主导地位将支撑2025年许可证管理市场规模达到8.8亿美元,反映企业对可配置、策略驱动的大规模自动化的需求。然而,随着企业越来越多地将优化任务外包给拥有稀缺专业知识的合作伙伴,服务领域预计将以14.56%的复合年增长率成长,进一步推动许可证管理市场规模的扩大。
託管服务供应商正在引入人工智慧技术,以预测续约高峰并在供应商审核前检测违规。这种持续监控模式满足了那些长期面临认证软体资产管理人才短缺问题的组织的需求,尤其是在亚太和拉丁美洲地区。因此,预计到2031年,业务收益将与软体收入的差距缩小,从而改变传统上专注于授权授权的供应商的竞争策略。
到2025年,云端采用将占据许可证管理市场57.36%的份额。这主要得益于企业从永久性本地部署工具迁移到符合其整体IT策略的订阅式SaaS平台。云端架构支援即时更新、弹性扩充、API级整合以及多重云端环境下的即时使用情况分析。这将使该细分市场保持14.02%的复合年增长率,从而巩固其在许可证管理市场的核心地位。
在需要本地资料保存或依赖传统基础架构的高度监管产业中,本地部署解决方案仍广泛应用。然而,将云端分析与本地检测结合,既能满足资料主权要求又不牺牲敏捷性的混合模式正日益受到青睐。采用云端优先管治的公司报告称,其管理开销降低了 40%,这增强了持续迁移的经济效益,并推动了许可证管理市场的整体规模成长。
区域分析
预计到2025年,北美许可证管理市场规模将达到5.4亿美元,占据37.68%的市场份额,主要得益于成熟的企业IT支出和健全的审核系统。美国证券交易委员会(SEC)网路风险揭露规则的严格期限要求,也使得实现软体的全面可视性变得更加紧迫。加拿大公共部门现代化计画进一步推动了区域需求,但随着大型企业渗透率接近饱和,市场成长已放缓至个位数。
亚太地区预计到2031年将达到13.29%的复合年增长率,在2025年小规模的基数基础上实现市场领先地位。对生成式人工智慧的投资将成长两倍,达到34亿美元,其中中国的投资额年增160%。这种快速普及导致语言模型、资料管道和分析租户的授权问题日益复杂。本地供应商正透过与授权专家合作,弥合版权追踪和成本管治的差距,从而加速区域发展势头。
由于《数位营运弹性法案》(DORA) 的合规期限临近,欧洲在许可证管理市场占了相当大的份额。金融机构正在重组其资产日誌和审核工作流程,以满足严格的弹性指标。同时,随着云端运算的普及,拉丁美洲和中东及非洲地区正从电子表格管理过渡到商业平台。儘管这些地区仍在发展中,但预计到本世纪末,它们将为全球许可证管理市场规模的增量做出贡献。
其他福利:
- Excel格式的市场预测(ME)表
- 3个月的分析师支持
目录
第一章 引言
- 研究假设和市场定义
- 调查范围
第二章调查方法
第三章执行摘要
第四章 市场情势
- 市场概览
- 市场驱动因素
- 加速向SaaS和订阅式授权模式转型
- 供应商审核的频率和成本增加
- 基于财务营运政策的强制性IT资产优化
- 利用人工智慧发现「影子IT」许可证
- 欧盟《数位营运韧性法案》(DORA) 合规期限
- 工业物联网平台中嵌入式设备授权的商业化
- 市场限制
- 不透明的供应商特定授权条款和指标
- 分散的独立工俱生态系统会增加整合成本。
- 认证SAM人才供不应求
- 开放原始码的日益普及降低了对商业授权的需求。
- 产业价值链分析
- 监管环境
- 技术展望
- 波特五力分析
- 供应商的议价能力
- 买方的议价能力
- 新进入者的威胁
- 替代品的威胁
- 竞争对手之间的竞争
第五章 市场规模与成长预测
- 按组件
- 软体
- 服务
- 透过部署
- 本地部署
- 云
- 透过使用
- 审核服务
- 咨询服务
- 合规管理
- 授权权利和优化
- 营运与分析
- 其他用途
- 按最终用户行业划分
- 银行、金融服务和保险(BFSI)
- 医疗保健和生命科学
- 资讯科技和电信
- 媒体与娱乐
- 其他终端用户产业
- 按地区
- 北美洲
- 美国
- 加拿大
- 墨西哥
- 欧洲
- 英国
- 德国
- 法国
- 义大利
- 其他欧洲地区
- 亚太地区
- 中国
- 日本
- 印度
- 韩国
- 其他亚洲地区
- 中东
- 以色列
- 沙乌地阿拉伯
- 阿拉伯聯合大公国
- 土耳其
- 其他中东地区
- 非洲
- 南非
- 埃及
- 其他非洲地区
- 南美洲
- 巴西
- 阿根廷
- 其他南美洲
- 北美洲
第六章 竞争情势
- 市场集中度
- 策略趋势
- 市占率分析
- 公司简介
- Flexera Software LLC
- USU Software AG
- Snow Software AB
- IBM Corporation
- ServiceNow Inc.
- Oracle Corporation
- Broadcom Inc.(CA Technologies)
- Micro Focus International plc
- DXC Technology Company
- OpenLM Ltd
- SAP SE
- Thales Group(Gemalto)
- Quest Software Inc.
- Reprise Software Inc.
- Ivanti, Inc.
- License Dashboard Ltd
- Certero Ltd
- Zylo Inc.
- LeanIX GmbH
- OpenText Corporation
第七章 市场机会与未来展望
The license management market is expected to grow from USD 1.43 billion in 2025 to USD 1.59 billion in 2026 and is forecast to reach USD 2.68 billion by 2031 at 11.04% CAGR over 2026-2031.
Accelerating digitization, swelling SaaS inflation, and new regulatory mandates such as the EU Digital Operational Resilience Act are amplifying demand for automated governance across hybrid IT estates. Regulatory scrutiny, higher audit frequency, and the need for real-time cost control have shifted software asset governance from a support function to a board-level priority. Vendors are responding through platform consolidation, AI-powered discovery, and subscription-based commercial models that help enterprises curb compliance risk while unlocking optimization gains. At the same time, expanding FinOps adoption and the rising cost of unused licenses, estimated at USD 127.3 million per large enterprise annually, underscore the tangible savings available through proactive license intelligence. Together, these forces solidify a sustained growth runway for the license management market through 2030.
Global License Management Market Trends and Insights
Accelerated Shift to SaaS and Subscription-Based Licensing
SaaS spending climbed 31% between 2023 and 2025 to USD 300 billion and now absorbs 25% of the average company's cost base. Subscription renewals, usage-based pricing, and multi-tier entitlements have pushed procurement teams toward automation so that license positions remain current. Shrinkflation tactics affecting 27% of customers conceal price hikes behind contractual tweaks, making granular usage insights indispensable for cost predictability. As a result, cloud-native platforms capable of parsing billing data down to the feature level are gaining ground across the license management market.
Heightened Frequency and Cost of Vendor Audits
Audit frequency is rising as publishers pursue revenue recovery, a trend reinforced by public sector shortfalls identified by the U.S. Government Accountability Office. The hybrid-cloud sprawl adds complexity because legacy discovery tools cannot easily reconcile virtual, containerized, and SaaS assets. Enterprises, therefore, allocate larger compliance budgets to solutions that merge discovery, entitlement data, and contractual logic within a single control plane. The heightened scrutiny supports sustained double-digit growth across the license management market.
Opaque, Vendor-Specific Licence Terms and Metrics
Frequent metric redesigns, seat-based, core-based, or consumption-based, blur cost visibility. Broadcom's week-long VMware sales suspension illustrated how supplier system changes can derail customer governance workflows. Organizations expend disproportionate legal and technical effort decoding contract language, which slows optimization cycles and puts downward pressure on license management market adoption among smaller firms lacking specialist counsel.
Other drivers and restraints analyzed in the detailed report include:
- Mandatory IT-Asset Optimisation Under FinOps Mandates
- AI-Driven Discovery of Shadow IT Licences
- Fragmented Point-Tool Ecosystem Increases Integration Costs
For complete list of drivers and restraints, kindly check the Table Of Contents.
Segment Analysis
Software platforms retained a 61.74% license management market share in 2025 as core discovery, normalization, and reconciliation engines remain fundamental to governance operations. This dominance underpins a USD 0.88 billion slice of the 2025 license management market size and reflects enterprises' need for configurable, policy-driven automation at scale. Yet the services segment, projected to register a 14.56% CAGR, is rapidly expanding the license management market size as firms outsource optimization to partners holding scarce domain specialists.
Managed service providers embed AI to anticipate renewal spikes and detect non-compliance before vendor inspections occur. This continuous oversight model resonates with organizations facing a chronic shortage of certified Software Asset Management talent, especially across APAC and Latin America. As a result, service revenue is expected to narrow the gap with software by 2031, transforming the competitive calculus for vendors historically focused on licenses rather than consulting.
Cloud deployments represented 57.36% of the license management market share in 2025, propelled by enterprises migrating away from perpetual on-premises tools to subscription SaaS platforms that mirror their broader IT strategies. Cloud architectures deliver instant updates, elastic scaling, and API-grade integration, enabling real-time consumption analytics across multi-cloud estates and supporting a 14.02% CAGR that will keep this segment pivotal in the license management market.
On-premises solutions persist in highly regulated verticals that demand local data residency or maintain legacy infrastructure dependencies. However, hybrid models are gaining traction, combining cloud analytics with on-premises discovery to satisfy sovereignty mandates without sacrificing agility. Enterprises adopting cloud-first governance report 40% lower administrative overhead, reinforcing the economic case for continued migration and expanding the overall license management market size.
The License Management Market Report is Segmented by Component (Software, Services), Deployment (On-Premise, Cloud), Application (Audit Services, Advisory Services, Compliance Management, Licence Entitlement and Optimisation, Operations and Analytics, Other Applications), End-User Industry (BFSI, Healthcare and Life Sciences, and More), and Geography. The Market Forecasts are Provided in Terms of Value (USD).
Geography Analysis
The license management market size in North America totalled USD 0.54 billion in 2025, translating into a dominant 37.68% share backed by mature enterprise IT spending and an active audit culture. Tight timelines imposed by the SEC's cyber-risk disclosure rules add urgency to achieving full software visibility. Canada's public sector modernization programs further swell regional demand, though growth is tapering to single-digit rates as penetration saturates large enterprises.
Asia-Pacific generated a smaller base value in 2025, yet is projected to deliver a market-leading 13.29% CAGR through 2031. Investments in generative AI are tripling to USD 3.4 billion, with China lifting spending by 160% year-over-year. Such rapid adoption inflates license complexity across language models, data pipelines, and analytics tenants. Local vendors are partnering with global license management specialists to address gaps in entitlement tracking and cost governance, thereby accelerating regional momentum.
Europe commands a sizeable slice of the license management market, propelled by the DORA compliance deadline. Financial institutions are rearchitecting asset logs and audit workflows to meet stringent resilience metrics. Meanwhile, Latin America, the Middle East, and Africa are shifting from spreadsheet tracking toward commercial platforms as cloud penetration deepens. Although still nascent, these regions are expected to contribute incremental gains to the global license management market size by the close of the decade.
- Flexera Software LLC
- USU Software AG
- Snow Software AB
- IBM Corporation
- ServiceNow Inc.
- Oracle Corporation
- Broadcom Inc. (CA Technologies)
- Micro Focus International plc
- DXC Technology Company
- OpenLM Ltd
- SAP SE
- Thales Group (Gemalto)
- Quest Software Inc.
- Reprise Software Inc.
- Ivanti, Inc.
- License Dashboard Ltd
- Certero Ltd
- Zylo Inc.
- LeanIX GmbH
- OpenText Corporation
Additional Benefits:
- The market estimate (ME) sheet in Excel format
- 3 months of analyst support
TABLE OF CONTENTS
1 INTRODUCTION
- 1.1 Study Assumptions and Market Definition
- 1.2 Scope of the Study
2 RESEARCH METHODOLOGY
3 EXECUTIVE SUMMARY
4 MARKET LANDSCAPE
- 4.1 Market Overview
- 4.2 Market Drivers
- 4.2.1 Accelerated shift to SaaS and subscription-based licensing
- 4.2.2 Heightened frequency and cost of vendor audits
- 4.2.3 Mandatory IT-asset optimisation under FinOps mandates
- 4.2.4 AI-driven discovery of "shadow IT" licences
- 4.2.5 EU's Digital Operational Resilience Act (DORA) compliance deadline
- 4.2.6 Embedded-device licence monetisation in IIoT platforms
- 4.3 Market Restraints
- 4.3.1 Opaque, vendor-specific licence terms and metrics
- 4.3.2 Fragmented point-tool ecosystem increases integration costs
- 4.3.3 Limited availability of certified SAM talent
- 4.3.4 Rising open-source adoption reduces commercial-licence volume
- 4.4 Industry Value-Chain Analysis
- 4.5 Regulatory Landscape
- 4.6 Technological Outlook
- 4.7 Porter's Five Forces Analysis
- 4.7.1 Bargaining Power of Suppliers
- 4.7.2 Bargaining Power of Buyers
- 4.7.3 Threat of New Entrants
- 4.7.4 Threat of Substitutes
- 4.7.5 Intensity of Competitive Rivalry
5 MARKET SIZE AND GROWTH FORECASTS (VALUE)
- 5.1 By Component
- 5.1.1 Software
- 5.1.2 Services
- 5.2 By Deployment
- 5.2.1 On-premise
- 5.2.2 Cloud
- 5.3 By Application
- 5.3.1 Audit Services
- 5.3.2 Advisory Services
- 5.3.3 Compliance Management
- 5.3.4 Licence Entitlement and Optimisation
- 5.3.5 Operations and Analytics
- 5.3.6 Other Applications
- 5.4 By End-User Industry
- 5.4.1 Banking, Financial Services and Insurance (BFSI)
- 5.4.2 Healthcare and Life Sciences
- 5.4.3 Information Technology and Telecommunications
- 5.4.4 Media and Entertainment
- 5.4.5 Other End-User Industries
- 5.5 By Geography
- 5.5.1 North America
- 5.5.1.1 United States
- 5.5.1.2 Canada
- 5.5.1.3 Mexico
- 5.5.2 Europe
- 5.5.2.1 United Kingdom
- 5.5.2.2 Germany
- 5.5.2.3 France
- 5.5.2.4 Italy
- 5.5.2.5 Rest of Europe
- 5.5.3 Asia-Pacific
- 5.5.3.1 China
- 5.5.3.2 Japan
- 5.5.3.3 India
- 5.5.3.4 South Korea
- 5.5.3.5 Rest of Asia
- 5.5.4 Middle East
- 5.5.4.1 Israel
- 5.5.4.2 Saudi Arabia
- 5.5.4.3 United Arab Emirates
- 5.5.4.4 Turkey
- 5.5.4.5 Rest of Middle East
- 5.5.5 Africa
- 5.5.5.1 South Africa
- 5.5.5.2 Egypt
- 5.5.5.3 Rest of Africa
- 5.5.6 South America
- 5.5.6.1 Brazil
- 5.5.6.2 Argentina
- 5.5.6.3 Rest of South America
- 5.5.1 North America
6 COMPETITIVE LANDSCAPE
- 6.1 Market Concentration
- 6.2 Strategic Moves
- 6.3 Market Share Analysis
- 6.4 Company Profiles (includes Global level Overview, Market level overview, Core Segments, Financials as available, Strategic Information, Market Rank/Share for key companies, Products and Services, and Recent Developments)
- 6.4.1 Flexera Software LLC
- 6.4.2 USU Software AG
- 6.4.3 Snow Software AB
- 6.4.4 IBM Corporation
- 6.4.5 ServiceNow Inc.
- 6.4.6 Oracle Corporation
- 6.4.7 Broadcom Inc. (CA Technologies)
- 6.4.8 Micro Focus International plc
- 6.4.9 DXC Technology Company
- 6.4.10 OpenLM Ltd
- 6.4.11 SAP SE
- 6.4.12 Thales Group (Gemalto)
- 6.4.13 Quest Software Inc.
- 6.4.14 Reprise Software Inc.
- 6.4.15 Ivanti, Inc.
- 6.4.16 License Dashboard Ltd
- 6.4.17 Certero Ltd
- 6.4.18 Zylo Inc.
- 6.4.19 LeanIX GmbH
- 6.4.20 OpenText Corporation
7 MARKET OPPORTUNITIES AND FUTURE OUTLOOK
- 7.1 White-space and Unmet-need Assessment
 2026-2030年全球软体材料清单(SBOM)管理市场
 软体授权管理市场 - 全球产业规模、份额、趋势、机会及预测(按部署方式、应用、最终用户、地区和竞争格局划分,2021-2031年)
 许可证管理市场规模、份额和成长分析(按组件、部署类型、组织规模、应用、最终用户产业和地区划分)-2026-2033年产业预测许可证管理市场-全球产业规模、份额、趋势、机会和预测,按组件、按部署模式、按最终用户行业、按地区和竞争进行细分,2020-2030 年预测
 许可证管理市场:按组件、许可证类型、应用、垂直行业和公司规模 - 2025-2030 年全球预测
 许可证管理市场:按组件、部署、最终用途行业和地区划分