


 |
市场调查报告书
商品编码
1911320
灵活燃料汽车:市场份额分析、行业趋势和统计数据、成长预测(2026-2031 年)Flex-fuel Vehicle - Market Share Analysis, Industry Trends & Statistics, Growth Forecasts (2026 - 2031) |
||||||
※ 本网页内容可能与最新版本有所差异。详细情况请与我们联繫。
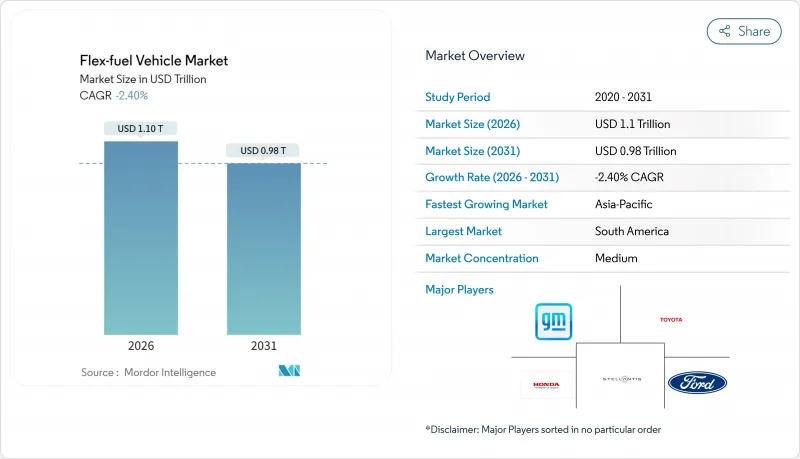
预计到 2026 年,灵活燃料汽车市场规模将达到 11,028.8 亿美元,高于 2025 年的 11,300 亿美元。预计到 2031 年,该市场规模将达到 9,761.2 亿美元,2026 年至 2031 年的复合年增长率为 -2.4%。
这一下滑趋势反映了汽车产业加速向纯电动驱动系统转型,以及日益严格的法规优先考虑零排放解决方案而非生质燃料混合燃料。由于电动平台占据了新车投资的大部分,整车製造商正在重新评估资本配置,而欧盟在2035年逐步淘汰内燃机以及中国新能源汽车配额等政策措施加剧了结构性阻力。南美洲仍然是灵活燃料汽车市场的重镇,这得益于巴西政府的碳信用激励计划RenovaBio。然而,随着混合动力汽车的普及,该地区的车队更新速度也正在放缓。虽然乘用车由于规模优势,销售不会大幅下滑,但商用车车队的销售成长正在加快,因为总拥有成本(TCO)模型越来越倾向于电气化。整体而言,在优先考虑直接电气化的脱碳议程中,市场的战略意义正从成长机会转向对冲转型风险。
全球灵活燃料汽车市场趋势与洞察
开发中国家E-10/E-15的全球发展
印度、印尼和菲律宾不断扩大的乙醇掺混比例正在提振乙醇需求,因为政策制定者正致力于保障能源安全和实现农业收入多元化。印度力争在2026年实现五分之一的乙醇掺混比例,这将使印度从玉米出口国转变为净进口国,最终加剧全球原料供应紧张。日本的2030年E-10和2040年E-20推广蓝图凸显了亚洲在扩大电动车基础设施的同时,维持内燃机汽车选择的协调策略。与家禽和畜牧业的原料竞争推高了投入价格,暴露了燃料政策与粮食安全之间的微妙平衡。作为物流和定价的关键推动者,国家石油公司正在帮助缓解区域分销瓶颈。儘管这些措施共同帮助减少了废气二氧化碳排放,但即便电动车的普及仍在持续,它们也未能阻止灵活燃料汽车市场的下滑趋势。
巴西Renova生物碳信用溢价
RenovaBio 制定了一项基于生命週期的排碳权标准,该标准对乙醇供应链效率的提升进行经济估值。低碳 CBIO 认证价格溢价将在 2025 年初达到每吨 115 美元(二氧化碳当量),为甘蔗和玉米乙醇工厂带来盈利的收入来源。巴西中西部地区的扩张意味着目前已有 25 家玉米乙醇工厂运作,另有 15 家正在建设中,预计 2024/25 年度的总产量将达到 82 亿公升。该政策的技术中立框架有利于一流生产商,并鼓励采用精密农业投入和余热回收系统。巴西石油公司 (Petrobras) 根据《未来燃料法》认可高浓度乙醇混合燃料,显示该州对此发展路径的持续支持。虽然 RenovaBio 缓解了与糖价相关的收入波动,但它无法完全抵消宏观经济转型为电动车带来的影响。
加速欧洲和中国电动车普及目标的实现
欧盟2035年内燃机汽车禁令以及中国不断扩大的新能源汽车配额,正促使汽车製造商的投资转向全面电气化。 2023年,中国品牌占欧盟纯电动车销量的7.9%,预计2027年将达到20%,加剧了市场竞争。欧洲电动车市场预计到2030年将快速成长,并像磁石一样吸引来自生质燃料平台的资本。中国的成本优势使得弹性燃料策略显得不那么经济,进而强化了政策、基础建设和消费者偏好之间的回馈循环。随着公共充电网路的扩展,里程焦虑的缓解进一步削弱了灵活燃料的优势。此限制因素导致弹性燃料汽车市场复合年增长率下降幅度最大。
细分市场分析
2025年,E-25至E-85类别占弹性燃料汽车市场的48.55%,但预计到2031年将以-2.30%的复合年增长率萎缩。中等浓度的混合燃料可与现有加油站的油泵和引擎标定係统相容,避免了昂贵的硬体改造。巴西的E30汽油标准恰好符合此理想状态,其2,000万辆汽车能够无缝适应各种乙醇含量。加州E85零售的快速成长表明,在经济条件允许的情况下,地方课税和价格激励措施可以吸引驾驶员使用更高比例的生质燃料燃料。然而,研究表明,E30在低速预燃控制方面已接近临界点,增加乙醇含量会增加引擎标定的复杂性和冷启动风险。这项实际上限指导原始设备製造商(OEM)的设计选择,在过渡期内,中等浓度的混合燃料仍将作为行业预设选项。
高于 E85 的高浓度燃料混合物能最大限度地提高可再生能源含量,但需要专用燃料网络,并且由于能量密度较低,续航里程会受到限制。低浓度燃料混合物,如 E10 和 E15,在欠发达市场较为适用,但减量排放有限,在严格的排放目标下,其策略价值也较低。即使电气化进程不断推进,目前的燃料混合物等级体係也体现了永续性和基础设施实际情况之间的一种权衡。总体而言,只要在高产地区,乙醇与汽油的价格差异保持吸引力,25% 至 85% 的乙醇混合物仍将在 2031 年前继续主导灵活燃料的普及。
到2025年,乘用车将占总收入的64.52%,其年复合成长率(CAGR)为-2.18%,低于商用车的下降速度。消费者对燃料选择的偏好支撑着基准需求,尤其是在乙醇价格较低的地区。在巴西的紧凑型轿车市场,灵活燃料仍然是主流,而印度的塔塔Panch灵活燃料车型则展现了即使在成本敏感型市场中,创新依然具有潜力。轻型商用车则处于中间市场,需要在有效载荷需求和日益收紧内燃机限制的都市区法规之间负载容量。相比之下,重型卡车和巴士的销量下滑速度最快,因为车队营运商正将资金转向电池电动和氢燃料电池车型,这些车型有望降低长期营运成本。
乘用车市场的韧性源自于其分散的加油网络和个体价格套利行为,而这些特征在集中式车队采购中并不存在。摩托车正在崛起为一个新的细分市场,本田推出了可灵活使用多种燃料的发动机,能够利用东南亚地区的国内乙醇供应。然而,都市区更严格的空气污染法规和拥堵收费的实施预计将加速向电动Scooter和小型电动车的转型。因此,儘管乘用车在灵活燃料汽车市场仍将保持其销售主导地位,但预计未来十年该细分市场的战略重要性将会下降。
区域分析
南美洲在2025年将占据全球42.10%的市场份额,领先全球。这主要得益于巴西完善的乙醇生态系统,包括超过4万个零售加油站和强大的CBIO碳信用市场。巴西的《未来燃料法案》将强制掺混比例提高到35%,推动了强劲的国内需求,而玉米乙醇的扩张有助于分散原料风险。 Stellantis公司56亿欧元的生物混合投资凸显了该地区作为「活实验室」的作用,展现了乙醇和电力之间的协同效应。阿根廷和巴拉圭正在发展成为区域贸易中心,透过进口甘蔗乙醇来补充需求,并稳定供应链经济。
儘管采取了积极的燃料结构政策,亚太地区仍将是萎缩最快的地区,到2031年年复合成长率(CAGR)将为-2.23%。中国大力发展新能源车,并对纯电动卡车提供地方补贴,限制了对灵活燃料汽车的投资。印度的乙醇计画由于玉米进口增加而面临原料采购挑战,降低了成本竞争力。日本的E-10承诺提供了政策确定性,但国内汽车製造商优先研发固态电池,限制了灵活燃料汽车的生产,使其仅限于小众运动车型。东南亚国家正在进行B40生物柴油和乙醇的试点项目,同时电动车的诱因也开始吸引都市区消费者。
在北美,45Z税额扣抵维持了乙醇的大规模生产能力,但随着汽车製造商将新产品研发重心转向电动车平台,乙醇的市场渗透率已趋于平稳。加州的零排放车辆法规正在加速这项转变。欧洲也出现了类似的趋势:儘管德国提倡在2035年及以后对电动燃料实施豁免,但现行的监管方案仍然明显偏向纯电动车(BEV)。
在非洲,与粮食安全和经济多元化相关的燃料多元化策略提供了一个短暂的机会窗口,但基础设施的缺乏和购买力的有限阻碍了其推广。
其他福利:
- Excel格式的市场预测(ME)表
- 3个月的分析师支持
目录
第一章 引言
- 调查先决条件
- 调查范围
第二章调查方法
第三章执行摘要
第四章 市场情势
- 市场概览
- 市场驱动因素
- E-10/E-15开发中国家的全球发展
- 巴西 Renovabio 碳信用溢价
- 美国45Z税额扣抵后,纤维素乙醇价格出现转捩点。
- 原始设备製造商的灵活策略旨在对冲电动车政策的不确定性
- 适用于传统车辆的新一代端口燃油喷射套件
- 乙醇相容型后处理成本通货紧缩
- 市场限制
- 欧洲和中国加速电动车普及目标
- 将原始设备製造商(OEM)的资本支出(Cap-Ex)重新分配到纯电动车(BEV)平台
- 干旱地区乙醇原料供应受限
- 零度以下天气冷启动排放激增
- 价值/供应链分析
- 监管环境
- 技术展望
- 波特五力模型
- 供应商的议价能力
- 消费者议价能力
- 新进入者的威胁
- 替代品的威胁
- 竞争对手之间的竞争
第五章 市场规模及成长预测(价值(美元))
- 依乙醇混合比例
- E-10 至 E-25
- E-25 至 E-85
- E-85 以上
- 按车辆类型
- 搭乘用车
- 轻型商用车
- 大型商用车辆
- 按燃料类型
- 汽油
- 柴油相容双燃料
- 按销售管道
- 原厂正品设备
- 售后改装套件
- 按地区
- 北美洲
- 美国
- 加拿大
- 北美其他地区
- 南美洲
- 巴西
- 阿根廷
- 南美洲其他地区
- 欧洲
- 德国
- 法国
- 英国
- 西班牙
- 其他欧洲地区
- 亚太地区
- 中国
- 印度
- 日本
- 韩国
- 亚太其他地区
- 中东和非洲
- 阿拉伯聯合大公国
- 沙乌地阿拉伯
- 土耳其
- 埃及
- 南非
- 其他中东和非洲地区
- 北美洲
第六章 竞争情势
- 市场集中度
- 策略趋势
- 市占率分析
- 公司简介
- Stellantis NV
- Volkswagen AG
- General Motors Co.
- Ford Motor Co.
- Toyota Motor Corp.
- Honda Motor Co.
- Hyundai Motor Co.
- Kia Corp.
- Nissan Motor Co.
- Renault SA
- Subaru Corp.
- BMW AG
- Volvo Car Corp.
- Tata Motors Ltd.
- Mahindra & Mahindra Ltd.
- SAIC Motor Corp.
- Great Wall Motor Co.
- Geely Automobile Holdings
- JAC Motors
- Changan Automobile
第七章 市场机会与未来展望
Flex-fuel Vehicle market size in 2026 is estimated at USD 1102.88 billion, growing from 2025 value of USD 1130 billion with 2031 projections showing USD 976.12 billion, growing at -2.4% CAGR over 2026-2031.
The downturn mirrors the auto sector's accelerated pivot toward battery-electric drivetrains and tightening regulations that favor zero-tailpipe-emission solutions over biofuel blending. OEMs are reassessing capital allocation as electric platforms capture the bulk of new-model investment, while policy instruments such as the European Union's 2035 combustion-engine phase-out and China's NEV quotas deepen the structural headwinds. South America remains the stronghold for the flex-fuel vehicle market, anchored by Brazil's RenovaBio carbon-credit incentives, yet even this region faces slower fleet renewals as hybrid-electric penetration rises. Passenger cars retain scale advantages that shield the segment from steeper volume loss, but commercial fleets are decelerating faster because total cost-of-ownership models increasingly favor electrification. Overall, the market's strategic relevance is shifting from growth opportunity to transition hedge amid a decarbonization agenda that prioritizes direct electrification.
Global Flex-fuel Vehicle Market Trends and Insights
E-10/E-15 global roll-outs in developing nations
Expanding blend mandates across India, Indonesia, and the Philippines are elevating ethanol demand as policymakers seek energy security and farm-income diversification. India's push toward one-fifth blending by 2026 is turning the country from a corn exporter into a net importer, thereby tightening global feedstock supply. Japan's roadmap for E-10 by 2030 and E-20 by 2040 underscores a coordinated Asian strategy that preserves internal-combustion options while EV infrastructure scales. Feedstock competition with poultry and livestock sectors is lifting input prices, exposing the delicate balance between fuel policy and food security. National oil companies remain critical facilitators of logistics and pricing, helping mitigate regional distribution constraints. Collectively, these programs deliver incremental tail-pipe CO2 cuts but struggle to reverse the flex-fuel vehicle market contraction amid simultaneous EV incentives.
Brazilian RenovaBio carbon-credit premiums
RenovaBio sets life-cycle-based carbon-credit benchmarks that monetize every incremental efficiency gain along the ethanol supply chain. Premiums for low-carbon CBIO certificates reached USD 115 per tonne-CO2e in early 2025, adding profitable revenue streams to sugarcane and corn ethanol plants. Expansion in Brazil's Center-West has already spawned 25 operating corn-ethanol mills with another 15 under construction, lifting total output to 8.2 billion liters for the 2024/25 harvest. The policy's technology-neutral framework favors best-in-class producers, incentivizing precision-agriculture inputs and waste-heat recovery systems. Petrobras' endorsement of higher ethanol blends under the "Fuel of the Future" law signals sustained state-backed support for the pathway. While RenovaBio softens revenue volatility tied to sugar prices, it cannot fully offset the macro shift toward electric alternatives.
Accelerated EV adoption targets in Europe & China
The European Union's 2035 combustion ban and China's escalating NEV quotas are redirecting automaker investment toward full electrification. Chinese brands already occupied 7.9% of EU battery-electric sales in 2023 and may capture 20% by 2027, amplifying competitive pressure. The European EV market is forecast to grow exponentially by 2030, a financial magnet that drains capital from biofuel platforms. China's cost advantage makes flex-fuel strategies appear economically inferior, reinforcing a feedback loop of policy, infrastructure, and consumer preference. As public charging networks expand, range anxiety wanes, further eroding flex-fuel defensibility. The restraint subtracts the largest single share from the flex-fuel vehicle market CAGR.
Other drivers and restraints analyzed in the detailed report include:
- Cellulosic-ethanol price inflection after U.S. 45Z credit
- OEM flex-strategy to hedge EV policy uncertainty
- OEM cap-ex re-allocation toward BEV platforms
For complete list of drivers and restraints, kindly check the Table Of Contents.
Segment Analysis
The E-25 to E-85 category held 48.55% of flex-fuel vehicle market size in 2025 and is forecast to slip at a -2.30% CAGR to 2031. Moderate blends thrive on existing filling-station pumps and engine calibrations that avoid costly hardware changes. Brazil's evaluation of E30 gasoline aligns with this sweet spot, leveraging a 20-million-vehicle fleet that seamlessly adapts to varying ethanol content. California's rapid E85 retail sales underscore how regional taxation and price incentives can nudge drivers toward higher biofuel mixes when economics allow. Yet research indicates E30 sits at the inflection point for low-speed pre-ignition control, where further ethanol raises engine-mapping complexity and cold-start risk. This practical ceiling guides OEM design choices and keeps mid-range blends the industry's default during the transition period.
High blends above E85, while showcasing maximum renewable content, demand dedicated fuel networks and carry energy-density penalties that erode driving range. Entry-level blends such as E10 or E15 aid markets that are still developing supply chains, but they deliver limited carbon reduction, reducing their strategic appeal under stringent emissions goals. The current hierarchy signals a pragmatic compromise between sustainability and infrastructural reality, even as electrification gains traction. Overall, ethanol blends between 25% and 85% will continue to dominate flex-fuel adoption through 2031, provided price differentials against gasoline remain attractive in high-production regions.
Passenger cars generated 64.52% of 2025 revenue and will taper at a slower -2.18% CAGR than commercial segments. Consumer preference for fuel choice, especially where ethanol trades at a discount, sustains baseline demand. Brazil's compact-car segment still counts flex-fuels as the default configuration, while India's Tata Punch Flex Fuel showcases innovation potential even in cost-sensitive markets. Light-commercial vans occupy an intermediate position, balancing payload needs with urban-zone regulations that are starting to penalize combustion engines. In contrast, heavy-duty trucks and buses are declining fastest as fleet operators shift capital toward battery-electric and hydrogen models that promise long-term operating savings.
The resilience of the passenger car cohort stems from decentralized refueling and individual price arbitrage behavior, both absent in centralized fleet procurement. Motorcycles offer an emerging niche, with Honda introducing flex-compatible engines that can utilize domestic ethanol streams in Southeast Asia. Still, rising urban clean-air rules and congestion charges are likely to accelerate the migration toward electric scooters and compact EVs. Consequently, passenger cars will preserve volume leadership in the flex-fuel vehicle market, yet the segment's strategic importance is expected to diminish over the next decade.
The Flex-Fuel Vehicle Market is Segmented by Ethanol Blend Type (E-10 To E-25, E-25 To E-85, E-85 and Above), Vehicle Type (Passenger Cars, Light Commercial Vehicles, and Heavy Commercial Vehicles), Fuel Type (Gasoline and Diesel-Compatible Dual-Fuel), Sales Channel (OEM-Fitted and Aftermarket Conversion Kits), and Geography. The Market Forecasts are Provided in Terms of Value (USD).
Geography Analysis
South America led with 42.10% share in 2025, powered by Brazil's integrated ethanol ecosystem, which includes more than 40,000 retail pumps and a robust CBIO carbon-credit market. The country's "Fuel of the Future" law raising mandatory blends to 35% keeps domestic demand buoyant, while corn-ethanol expansion diversifies feedstock risk. Stellantis' EUR 5.6 billion Bio-Hybrid investment underscores the region's role as a living laboratory for ethanol-electric synergy. Argentina and Paraguay supplement demand by importing sugarcane ethanol, anchoring a regional trade hub that stabilizes supply-chain economics.
Asia-Pacific, despite active blending policies, is the fastest-declining bloc at -2.23% CAGR through 2031. China's national focus on NEV roll-outs, coupled with provincial subsidies for battery-electric trucks, constrains flex-fuel investments. India's ethanol program faces feedstock headwinds as corn imports grow, dampening cost competitiveness. Japan's E-10 pledge provides policy certainty, but domestic automakers are channeling R&D into solid-state batteries, limiting flex-fuel output beyond niche sports models. Southeast Asian nations are exploring B40 biodiesel and ethanol pilots, yet EV incentives are starting to capture the urban consumer segment.
North America retains large ethanol production capacity supported by the 45Z credit, yet market penetration is flat because OEMs aim new product pipelines at electric platforms. California's zero-emission vehicle mandate accelerates this swing. Europe shows similar patterns: notwithstanding Germany's push for e-fuels carve-outs post-2035, the regulatory package overwhelmingly steers buyers toward BEVs.
In the Middle East and Africa, fuel diversification strategies tied to food-security and economic diversification provide modest openings, but infrastructure gaps and limited purchasing power restrain widespread uptake.
- Stellantis NV
- Volkswagen AG
- General Motors Co.
- Ford Motor Co.
- Toyota Motor Corp.
- Honda Motor Co.
- Hyundai Motor Co.
- Kia Corp.
- Nissan Motor Co.
- Renault SA
- Subaru Corp.
- BMW AG
- Volvo Car Corp.
- Tata Motors Ltd.
- Mahindra & Mahindra Ltd.
- SAIC Motor Corp.
- Great Wall Motor Co.
- Geely Automobile Holdings
- JAC Motors
- Changan Automobile
Additional Benefits:
- The market estimate (ME) sheet in Excel format
- 3 months of analyst support
TABLE OF CONTENTS
1 Introduction
- 1.1 Study Assumptions
- 1.2 Scope of the Study
2 Research Methodology
3 Executive Summary
4 Market Landscape
- 4.1 Market Overview
- 4.2 Market Drivers
- 4.2.1 E-10/E-15 Global Roll-Outs In Developing Nations
- 4.2.2 Brazilian Renovabio Carbon-Credit Premiums
- 4.2.3 Cellulosic-Ethanol Price Inflection After U.S. 45Z Credit
- 4.2.4 OEM Flex-Strategy To Hedge EV Policy Uncertainty
- 4.2.5 Next-Gen Port-Fuel-Injection Kits For Legacy Fleets
- 4.2.6 Ethanol-Compatible After-Treatment Cost Deflation
- 4.3 Market Restraints
- 4.3.1 Accelerated EV Adoption Targets In Europe & China
- 4.3.2 OEM Cap-Ex Re-Allocation Toward BEV Platforms
- 4.3.3 Limited Ethanol Feed-Stock In Drought-Prone Geographies
- 4.3.4 Cold-Start Emission Spikes In Sub-Zero Climates
- 4.4 Value / Supply-Chain Analysis
- 4.5 Regulatory Landscape
- 4.6 Technological Outlook
- 4.7 Porter's Five Forces
- 4.7.1 Bargaining Power of Suppliers
- 4.7.2 Bargaining Power of Consumers
- 4.7.3 Threat of New Entrants
- 4.7.4 Threat of Substitutes
- 4.7.5 Intensity of Competitive Rivalry
5 Market Size & Growth Forecasts (Value (USD))
- 5.1 By Ethanol Blend Type
- 5.1.1 E-10 to E-25
- 5.1.2 E-25 to E-85
- 5.1.3 E-85 and Above
- 5.2 By Vehicle Type
- 5.2.1 Passenger Cars
- 5.2.2 Light Commercial Vehicles
- 5.2.3 Heavy Commercial Vehicles
- 5.3 By Fuel Type
- 5.3.1 Gasoline
- 5.3.2 Diesel-compatible Dual-Fuel
- 5.4 By Sales Channel
- 5.4.1 OEM-fitted
- 5.4.2 Aftermarket Conversion Kits
- 5.5 By Geography
- 5.5.1 North America
- 5.5.1.1 United States
- 5.5.1.2 Canada
- 5.5.1.3 Rest of North America
- 5.5.2 South America
- 5.5.2.1 Brazil
- 5.5.2.2 Argentina
- 5.5.2.3 Rest of South America
- 5.5.3 Europe
- 5.5.3.1 Germany
- 5.5.3.2 France
- 5.5.3.3 United Kingdom
- 5.5.3.4 Spain
- 5.5.3.5 Rest of Europe
- 5.5.4 Asia-Pacific
- 5.5.4.1 China
- 5.5.4.2 India
- 5.5.4.3 Japan
- 5.5.4.4 South Korea
- 5.5.4.5 Rest of Asia-Pacific
- 5.5.5 Middle East and Africa
- 5.5.5.1 United Arab Emirates
- 5.5.5.2 Saudi Arabia
- 5.5.5.3 Turkey
- 5.5.5.4 Egypt
- 5.5.5.5 South Africa
- 5.5.5.6 Rest of Middle East and Africa
- 5.5.1 North America
6 Competitive Landscape
- 6.1 Market Concentration
- 6.2 Strategic Moves
- 6.3 Market Share Analysis
- 6.4 Company Profiles (includes Global Level Overview, Market Level Overview, Core Segments, Financials as Available, Strategic Information, Market Rank/Share for Key Companies, Products and Services, SWOT Analysis, and Recent Developments)
- 6.4.1 Stellantis NV
- 6.4.2 Volkswagen AG
- 6.4.3 General Motors Co.
- 6.4.4 Ford Motor Co.
- 6.4.5 Toyota Motor Corp.
- 6.4.6 Honda Motor Co.
- 6.4.7 Hyundai Motor Co.
- 6.4.8 Kia Corp.
- 6.4.9 Nissan Motor Co.
- 6.4.10 Renault SA
- 6.4.11 Subaru Corp.
- 6.4.12 BMW AG
- 6.4.13 Volvo Car Corp.
- 6.4.14 Tata Motors Ltd.
- 6.4.15 Mahindra & Mahindra Ltd.
- 6.4.16 SAIC Motor Corp.
- 6.4.17 Great Wall Motor Co.
- 6.4.18 Geely Automobile Holdings
- 6.4.19 JAC Motors
- 6.4.20 Changan Automobile
7 Market Opportunities & Future Outlook
- 7.1 White-space & Unmet-need Assessment


