


 |
市场调查报告书
商品编码
1911490
MOSFET功率电晶体:市场占有率分析、产业趋势与统计、成长预测(2026-2031年)MOSFET Power Transistors - Market Share Analysis, Industry Trends & Statistics, Growth Forecasts (2026 - 2031) |
||||||
※ 本网页内容可能与最新版本有所差异。详细情况请与我们联繫。
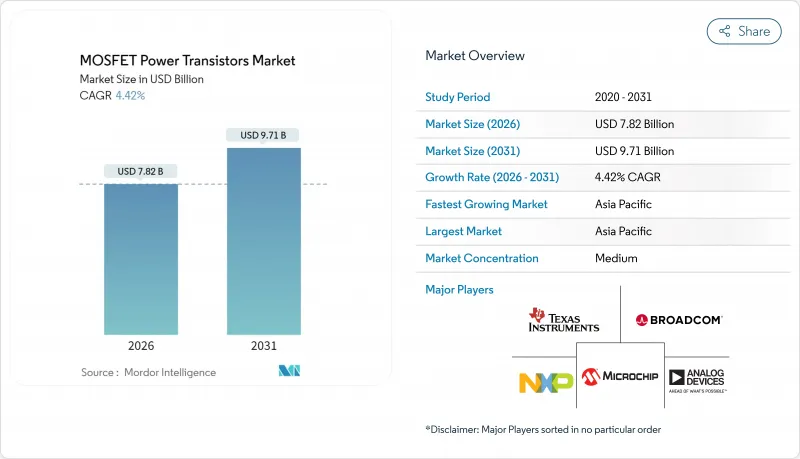
预计 MOSFET 功率电晶体市场在 2026 年的价值将达到 78.2 亿美元,从 2025 年的 74.9 亿美元成长到 2031 年的 97.1 亿美元。
预计2026年至2031年年复合成长率(CAGR)为4.42%。
这一稳步扩张反映了交通电气化、可再生能源设施扩张以及以人工智慧为中心的资料中心升级所驱动的需求成长。然而,供应瓶颈和製造限制制约了短期内的成长动能。需求集中在电动车、太阳能和风能逆变器以及人工智慧伺服器等高成长终端用户领域,在这些领域,宽能带隙材料、高压架构和先进封装技术带来了显着的效率提升。竞争强度仍然适中。主要供应商正利用垂直整合的製造模式、汽车级品质系统和平台组合来巩固市场份额,而灵活的新参与企业则利用其利基生产能力和宽能带隙材料方面的专业知识。政府的「国内製造」激励措施,特别是美国的《晶片和整合产品法案》(CHIPS Act)以及亚洲和欧洲的类似项目,正在引导采购决策从单纯的成本优化转向供应韧性。
全球 MOSFET 功率电晶体市场趋势与洞察
电动车快速生产推动了牵引MOSFET的采用
随着电动车产量的扩大,对大电流牵引逆变器的需求日益增长,导致汽车半导体成本从内燃机车型的约400美元/辆上涨至600-800美元/辆。碳化硅MOSFET可实现800V驱动系统,并将充电时间从400V系统的45分钟缩短至15分钟,缩短了80%,因此材料成本增加三到四倍也是合理的。英飞凌于2024年12月发布的OptiMOS 7系列元件,可将开关损耗降低30%,并满足下一代逆变器的热设计要求。符合AEC-Q101标准的汽车级认证虽然会延长设计週期,但会巩固现有供应商的市场地位,这些供应商拥有可靠的过往记录。
政府半导体优惠政策重塑区域製造地
总额达530亿美元的《晶片与科学法案》将津贴美国国内半导体製造业,使采购决策从追求最低成本转向增强韧性。台积电位于亚利桑那州的工厂将获得66亿美元的津贴,并于2028年开始生产功率半导体;英特尔位于俄亥俄州的工厂则将专注于生产车规级MOSFET节点。韩国、日本和欧盟的类似计画将促进区域丛集的发展,并缩短区域汽车製造商和可再生能源整合商的前置作业时间,但大规模产能的实现要等到2027年以后。
宽能带隙材料的成本溢价阻碍了其广泛应用。
碳化硅 (SiC) 和氮化镓 (GaN)晶粒的价格是硅晶片的 3-10 倍,150 毫米 SiC 晶圆的售价为 1500-2000 美元,而硅晶片的售价仅为 50 美元。产量比率徘徊在 60-80% 左右,而特殊的高压封装会使每个装置的成本增加 2-5 美元。虽然采用 200 毫米晶圆可以改善成本曲线,但由于材料特性和资本密集度等因素,在整个预测期内,其绝对价格仍将远高于传统硅晶片。
细分市场分析
到2025年,N通道元件将占总收入的72.55%,凸显了其低导通电阻和高电子迁移率的优势,这些优势在高频转换器中至关重要。这一份额与MOSFET功率电晶体在牵引逆变器、太阳能MPPT和伺服器VRM市场的主导地位相符。互补/双通道元件虽然规模较小,但预计在预测期内将以5.48%的最高复合年增长率成长,因为释放同步整流的优势,将转换器损耗降低2-3个百分点。
设计人员正在将互补型MOSFET 组合成半桥结构,用于 DC-DC 转换器,以优化死区期间的导通并降低直通风险。这种结构在 AI 伺服器和电信整流器中得到了越来越广泛的应用,因为其带来的功耗节省可以直接转化为更低的冷却负载。虽然 P 通道元件在高阶应用领域仍占有一席之地,但其较高的导通电阻使得大部分成长空间被双通道元件所取代,后者在性能和成本效益之间取得了更好的平衡。
到2025年,硅晶片将占总收入的68.75%,这主要得益于成熟的200毫米晶圆厂、充足的供应以及每晶粒0.05-0.15美元的经济效益。这使得硅晶片在600V以下的封装领域占据了稳固的地位,儘管人们对碳化硅(SiC)的兴趣日益浓厚,但硅晶片在MOSFET功率电晶体市场的份额依然强劲。碳化硅5.65%的复合年增长率反映了800V电动车驱动系统、1500V太阳能电池串以及需要结温高于200°C的工业驱动装置的需求。
由于具有高导热性和三倍的击穿电压,SiC MOSFET 在高压范围内实现了低开关损耗和导通损耗。 GaN 占据了 650V 和 1-2MHz 的最佳开关频率范围,快速充电交流适配器和雷射雷达脉衝产生器的需求不断增长,但由于晶圆小型化和基板供应的限制,大规模生产在 2031 年之前仍将面临挑战。其他化合物半导体将继续应用于特殊领域,其对收入的贡献将十分有限。
区域分析
亚太地区将继续保持领先地位,预计到2025年将占全球营收的45.20%,复合年增长率(CAGR)预计为7.25%。中国大陆、台湾和韩国拥有成熟的晶圆代工节点以及下游电子组装丛集,能够维持区域需求週期。日本正利用政府补贴振兴其半导体产业基础,投资超过130亿美元用于功率元件和先进封装生产线。印度的生产连结奖励计画(PLI)计划正在推动国内电动车和太阳能市场的发展,儘管小规模。
北美正受惠于资料中心的建设和电动车的加速普及。英特尔、Wolfspeed 和安森美半导体正在卡罗来纳州和亚利桑那州新增 200 毫米碳化硅 (SiC) 生产线,这将降低对进口的依赖,并有望扩大北美 MOSFET 功率晶体管市场。 《晶片采购和生产法案》(CHIPS Act) 正在推动采购向国内节点转移,尤其是在关键国防零件和汽车认证生产线方面。
欧洲约占市场份额的17.80%,主要由德国汽车巨头和义大利的专业类比晶片製造厂推动。日益严格的环保法规推动了对高效1200V碳化硅元件的需求,这些元件用于可再生能源逆变器和快速充电器。同时,沙乌地阿拉伯和阿联酋推动了中东地区对大型太阳能发电厂和工业驱动设备的需求,但产能仍依赖进口。拉丁美洲的成长与巴西的区域电动车奖励和智利的可再生能源竞标有关,但与亚太和北美相比,其产量仍然小规模。
其他福利:
- Excel格式的市场预测(ME)表
- 3个月的分析师支持
目录
第一章 引言
- 研究假设和市场定义
- 调查范围
第二章调查方法
第三章执行摘要
第四章 市场情势
- 市场概览
- 市场驱动因素
- 电动车产量激增带动了对用于牵引和车载充电器的MOSFET的需求。
- 扩大逆变器在太阳能和风能发电等可再生能源领域的应用
- 智慧型手机和穿戴式装置的出货量正在迅速成长,而这些装置都需要低功耗 MOSFET。
- 政府为吸引国内晶圆厂而提供的奖励措施正在催生利基代工产能合约。
- AI伺服器电源向高压SiC/GaN阶段过渡
- 200mm SiC晶圆成本大幅下降推动了1200V设计方案的普及。
- 市场限制
- 宽能带隙MOSFET的晶粒和封装成本高成本
- 晶圆产能短缺及前置作业时间长
- 缺乏闸极驱动器介面标准会延缓设计週期。
- 对氟基气体蚀刻征收的环境税推高了生产成本。
- 产业供应链分析
- 监管环境
- 技术展望
- 波特五力分析
- 供应商的议价能力
- 买方的议价能力
- 新进入者的威胁
- 替代品的威胁
- 竞争程度
- 宏观经济影响评估
第五章 市场规模与成长预测
- 按频道类型
- N通道
- P频道
- 互补/对偶
- 材料
- 硅
- 碳化硅(SiC)
- 氮化镓(GaN)
- 其他材料(GaAs等)
- 按包装类型
- 分立元件(TO-247/TO-220)
- 表面黏着技术(DPAK、QFN)
- 电源模组
- 晶圆级CSP
- 其他包装类型
- 按最终用户行业划分
- 汽车和运输设备
- 家用电子电器
- 工业和製造业
- 卫生保健
- 航太与国防
- 其他终端用户产业
- 按地区
- 北美洲
- 美国
- 加拿大
- 墨西哥
- 南美洲
- 巴西
- 阿根廷
- 哥伦比亚
- 南美洲其他地区
- 欧洲
- 英国
- 德国
- 法国
- 义大利
- 西班牙
- 其他欧洲地区
- 亚太地区
- 中国
- 日本
- 韩国
- 印度
- 亚太其他地区
- 中东和非洲
- 中东
- 沙乌地阿拉伯
- 阿拉伯聯合大公国
- 其他中东地区
- 非洲
- 南非
- 埃及
- 其他非洲地区
- 中东
- 北美洲
第六章 竞争情势
- 市场集中度
- 策略趋势
- 市占率分析
- 公司简介
- Infineon Technologies AG
- STMicroelectronics NV
- ON Semiconductor Corporation
- Texas Instruments Incorporated
- Toshiba Corporation
- Renesas Electronics Corporation
- Mitsubishi Electric Corporation
- Vishay Intertechnology Inc.
- NXP Semiconductors NV
- Analog Devices, Inc.
- Broadcom Inc.
- Microchip Technology Incorporated
- ROHM Co., Ltd.
- Wolfspeed, Inc.
- Alpha and Omega Semiconductor Ltd.
- Littelfuse, Inc.
- Diodes Incorporated
- Nexperia BV
- Fuji Electric Co., Ltd.
- Power Integrations, Inc.
第七章 市场机会与未来展望
MOSFET power transistors market size in 2026 is estimated at USD 7.82 billion, growing from 2025 value of USD 7.49 billion with 2031 projections showing USD 9.71 billion, growing at 4.42% CAGR over 2026-2031.
This measured expansion reflects escalating electrification in transportation, renewable-energy build-outs, and AI-centric data-center upgrades, even as supply bottlenecks and manufacturing constraints temper near-term momentum. Demand concentrates in high-growth end-user arenas-electric vehicles, solar and wind inverters, and AI servers-where wide-bandgap materials, high-voltage architectures, and advanced packaging provide measurable efficiency gains. Competitive intensity remains moderate; top suppliers leverage vertically integrated fabrication, automotive-grade quality systems, and platform portfolios to defend share while nimble entrants exploit niche capacity and wide-bandgap specialization. Government "fab-on-shore" incentives, most prominently the U.S. CHIPS Act and comparable Asian and European programs, reshape sourcing considerations toward supply resilience, nudging procurement decisions away from pure cost-optimization.
Global MOSFET Power Transistors Market Trends and Insights
EV Production Surge Accelerates Traction MOSFET Adoption
Electric-vehicle output scaling propels high-current traction inverter requirements, lifting automotive semiconductor content toward USD 600-800 per car from roughly USD 400 in combustion models. Silicon-carbide MOSFETs enable 800 V drivetrains that trim 80%-charge times to 15 minutes versus 45 minutes on 400 V systems, justifying 3-4 X material premiums. Infineon's OptiMOS 7 family, introduced in December 2024, cuts switching losses by 30% to meet next-generation inverter thermal envelopes. Automotive-grade qualification under AEC-Q101 standards extends design cycles but entrenches incumbent suppliers with proven reliability records.
Government Semiconductor Incentives Reshape Manufacturing Geography
The USD 53 billion CHIPS and Science Act subsidizes domestic U.S. fabrication, shifting sourcing decisions toward resiliency over lowest cost. TSMC's Arizona site, backed by USD 6.6 billion in grants, will commence power semiconductor output in 2028, while Intel's Ohio fabs target automotive-grade MOSFET nodes. Parallel programs in South Korea, Japan, and the European Union foster localized clusters that shorten lead-times for regional automakers and renewable-energy integrators, though meaningful capacity only arrives post-2027.
Wide-Bandgap Cost Premiums Limit Mass-Market Penetration
SiC and GaN dies command 3-10 X silicon prices, with 150 mm SiC wafers selling for USD 1,500-2,000 versus USD 50 slices of silicon. Yields linger around 60-80%, and specialized high-voltage packages add USD 2-5 per device. Cost curves improve with 200 mm adoption, yet material properties and capital intensity keep absolute pricing well above legacy silicon through the forecast window.
Other drivers and restraints analyzed in the detailed report include:
- AI Server Power Architecture Migration Drives SiC Adoption
- Renewable-Energy Inverter Scaling Expands Grid-Tied Applications
- Supply Chain Bottlenecks Extend Lead-Times
For complete list of drivers and restraints, kindly check the Table Of Contents.
Segment Analysis
N-channel devices represented 72.55% of 2025 revenue, underscoring their lower on-resistance and higher electron mobility advantages that remain decisive in high-frequency converters. This share equates to a dominant MOSFET power transistors market position across traction inverters, solar MPPTs, and server VRMs. Complementary/dual devices, while smaller, unlock synchronous rectification benefits that shave 2-3 percentage-point converter losses, propelling a forecast-leading 5.48% CAGR.
Designers pair complementary MOSFETs in half-bridge topologies for DC-DC converters, optimizing conduction during dead-time and trimming shoot-through risk. Adoption scales with AI server and telecom rectifiers, where every watt saved converts to lower cooling loads. Although P-channel devices retain niche high-side roles, their higher on-resistance cedes most growth to dual-channel implementations that balance performance and cost efficiency.
Silicon accounts for 68.75% of 2025 revenue on the back of mature 200 mm fabs, ample supply, and USD 0.05-0.15 per die economics that lock silicon into sub-600 V sockets. Here, the MOSFET power transistors market share for silicon remains sticky despite SiC enthusiasm. Silicon-carbide's 5.65% CAGR reflects 800 V EV drivetrains, 1,500 V solar strings, and industrial drives demanding >200 °C junction capability.
Higher thermal conductivity and three-fold critical electric field tolerance grant SiC MOSFETs lower switching and conduction losses at elevated voltages. GaN occupies the 650 V, 1-2 MHz switching sweet spot, coveted by quick-charge AC adapters and LIDAR pulser stages, yet wafer scaling and substrate availability restrain mass volumes through 2031. Other compound semiconductors remain specialty plays with minimal revenue contribution.
The MOSFET Power Transistors Market Report is Segmented by Channel Type (N-Channel, P-Channel, and Complementary/Dual), Material Technology (Silicon, Silicon-Carbide, Gallium-Nitride, and More), Package Type (Discrete, Surface-Mount, Power Modules, and More), End-User Industry (Automotive, Consumer Electronics, Industrial and Manufacturing, and More), and Geography. The Market Forecasts are Provided in Terms of Value (USD).
Geography Analysis
Asia-Pacific led with 45.20% of 2025 revenue and a 7.25% forecast CAGR. China, Taiwan, and South Korea combine mature foundry nodes with downstream electronics assembly clusters, sustaining localized demand loops. Japan rejuvenates its semiconductor footprint with government subsidies topping USD 13 billion for power device and advanced-packaging lines. India's production-linked incentive (PLI) schemes tap into domestic EV and solar markets, albeit from a small base.
North America benefits from data-center buildouts and accelerating EV adoption. The MOSFET power transistors market size for North America is poised to expand as Intel, Wolfspeed, and onsemi add 200 mm SiC capacity in the Carolinas and Arizona, reducing import reliance. The CHIPS Act tilts sourcing toward domestic nodes, especially for defense-critical and automotive qualification streams.
Europe commands close to 17.80% share, anchored by Germany's automotive giants and Italy's analog specialist fabs. Stricter eco-regulations spur demand for high-efficiency 1,200 V SiC devices in renewable-energy inverters and fast-chargers. Meanwhile, Saudi Arabia and the United Arab Emirates steer Middle East demand toward utility-scale solar farms and industrial drives, yet capacity remains import-oriented. Latin American growth tracks regional EV incentives in Brazil and renewable-energy tenders in Chile, though volume remains modest relative to APAC or NA.
- Infineon Technologies AG
- STMicroelectronics N.V.
- ON Semiconductor Corporation
- Texas Instruments Incorporated
- Toshiba Corporation
- Renesas Electronics Corporation
- Mitsubishi Electric Corporation
- Vishay Intertechnology Inc.
- NXP Semiconductors N.V.
- Analog Devices, Inc.
- Broadcom Inc.
- Microchip Technology Incorporated
- ROHM Co., Ltd.
- Wolfspeed, Inc.
- Alpha and Omega Semiconductor Ltd.
- Littelfuse, Inc.
- Diodes Incorporated
- Nexperia B.V.
- Fuji Electric Co., Ltd.
- Power Integrations, Inc.
Additional Benefits:
- The market estimate (ME) sheet in Excel format
- 3 months of analyst support
TABLE OF CONTENTS
1 INTRODUCTION
- 1.1 Study Assumptions and Market Definition
- 1.2 Scope of the Study
2 RESEARCH METHODOLOGY
3 EXECUTIVE SUMMARY
4 MARKET LANDSCAPE
- 4.1 Market Overview
- 4.2 Market Drivers
- 4.2.1 EV-production boom elevating demand for traction and onboard-charger MOSFETs
- 4.2.2 Renewable-energy inverter build-outs in solar and wind
- 4.2.3 Explosive smartphone and wearable shipments needing low-power MOSFETs
- 4.2.4 Government "fab-on-shore" incentives spawning niche foundry capacity deals
- 4.2.5 AI-server power-supply migration to high-voltage SiC/GaN stages
- 4.2.6 Cost collapse from 200 mm SiC wafers unlocking 1200 V design wins
- 4.3 Market Restraints
- 4.3.1 Wide-bandgap MOSFETs' high die and packaging costs
- 4.3.2 Wafer-capacity shortages and long lead-times
- 4.3.3 Lack of gate-driver interface standard slows design cycles
- 4.3.4 Eco-taxes on fluorinated-gas etching raise production costs
- 4.4 Industry Supply Chain Analysis
- 4.5 Regulatory Landscape
- 4.6 Technological Outlook
- 4.7 Porter's Five Forces Analysis
- 4.7.1 Bargaining Power of Suppliers
- 4.7.2 Bargaining Power of Buyers
- 4.7.3 Threat of New Entrants
- 4.7.4 Threat of Substitutes
- 4.7.5 Degree of Competition
- 4.8 Assessment of Macroeconomic Impact
5 MARKET SIZE AND GROWTH FORECASTS (VALUE)
- 5.1 By Channel Type
- 5.1.1 N-channel
- 5.1.2 P-channel
- 5.1.3 Complementary / Dual
- 5.2 By Material
- 5.2.1 Silicon
- 5.2.2 Silicon-Carbide (SiC)
- 5.2.3 Gallium-Nitride (GaN)
- 5.2.4 Other Materials (GaAs, etc.)
- 5.3 By Package Type
- 5.3.1 Discrete (TO-247/TO-220)
- 5.3.2 Surface-Mount (DPAK, QFN)
- 5.3.3 Power Modules
- 5.3.4 Wafer-Level CSP
- 5.3.5 Other Package Types
- 5.4 By End-user Industry
- 5.4.1 Automotive and Transportation
- 5.4.2 Consumer Electronics
- 5.4.3 Industrial and Manufacturing
- 5.4.4 Healthcare
- 5.4.5 Aerospace and Defense
- 5.4.6 Other End-user Industries
- 5.5 By Geography
- 5.5.1 North America
- 5.5.1.1 United States
- 5.5.1.2 Canada
- 5.5.1.3 Mexico
- 5.5.2 South America
- 5.5.2.1 Brazil
- 5.5.2.2 Argentina
- 5.5.2.3 Colombia
- 5.5.2.4 Rest of South America
- 5.5.3 Europe
- 5.5.3.1 United Kingdom
- 5.5.3.2 Germany
- 5.5.3.3 France
- 5.5.3.4 Italy
- 5.5.3.5 Spain
- 5.5.3.6 Rest of Europe
- 5.5.4 Asia-Pacific
- 5.5.4.1 China
- 5.5.4.2 Japan
- 5.5.4.3 South Korea
- 5.5.4.4 India
- 5.5.4.5 Rest of Asia-Pacific
- 5.5.5 Middle East and Africa
- 5.5.5.1 Middle East
- 5.5.5.1.1 Saudi Arabia
- 5.5.5.1.2 United Arab Emirates
- 5.5.5.1.3 Rest of Middle East
- 5.5.5.2 Africa
- 5.5.5.2.1 South Africa
- 5.5.5.2.2 Egypt
- 5.5.5.2.3 Rest of Africa
- 5.5.5.1 Middle East
- 5.5.1 North America
6 COMPETITIVE LANDSCAPE
- 6.1 Market Concentration
- 6.2 Strategic Moves
- 6.3 Market Share Analysis
- 6.4 Company Profiles (includes Global level Overview, Market level overview, Core Segments, Financials as available, Strategic Information, Market Rank/Share for key companies, Products and Services, and Recent Developments)
- 6.4.1 Infineon Technologies AG
- 6.4.2 STMicroelectronics N.V.
- 6.4.3 ON Semiconductor Corporation
- 6.4.4 Texas Instruments Incorporated
- 6.4.5 Toshiba Corporation
- 6.4.6 Renesas Electronics Corporation
- 6.4.7 Mitsubishi Electric Corporation
- 6.4.8 Vishay Intertechnology Inc.
- 6.4.9 NXP Semiconductors N.V.
- 6.4.10 Analog Devices, Inc.
- 6.4.11 Broadcom Inc.
- 6.4.12 Microchip Technology Incorporated
- 6.4.13 ROHM Co., Ltd.
- 6.4.14 Wolfspeed, Inc.
- 6.4.15 Alpha and Omega Semiconductor Ltd.
- 6.4.16 Littelfuse, Inc.
- 6.4.17 Diodes Incorporated
- 6.4.18 Nexperia B.V.
- 6.4.19 Fuji Electric Co., Ltd.
- 6.4.20 Power Integrations, Inc.
7 MARKET OPPORTUNITIES AND FUTURE OUTLOOK
- 7.1 White-space and Unmet-Need Assessment
 2026年全球功率MOSFET(金属氧化物半导体场场效电晶体)市场报告2026年全球功率电晶体市场报告
 功率电晶体市场 - 全球产业规模、份额、趋势、机会及预测(按类型、应用、最终用途、地区和竞争格局划分),2021-2031年
 射频功率LDMOS电晶体市场按功率输出、频段、应用、分销通路和最终用户划分-2026-2032年全球预测小讯号功率 MOSFET 市场按通道类型、电压范围、额定电流、封装类型、最终用途产业和分销管道划分,全球预测,2026-2032 年功率 MOSFET 市场 - 全球产业规模、份额、趋势、机会和预测,按类型、功率等级、通道类型、应用、地区和竞争格局划分,2021-2031 年
 日本功率电晶体市场报告(按产品、类型、最终用途产业和地区划分,2026-2034年)
 达林顿电晶体市场规模、份额及成长分析(按类型、应用和地区划分)-2026-2033年产业预测
 双极型功率电晶体市场-2025-2030年预测2025 年至 2033 年功率电晶体市场报告(按产品、类型、最终用途、应用和地区)