


 |
市场调查报告书
商品编码
1911491
废弃物管理设备:市场占有率分析、产业趋势与统计资料、成长预测(2026-2031 年)Waste Management Equipment - Market Share Analysis, Industry Trends & Statistics, Growth Forecasts (2026 - 2031) |
||||||
※ 本网页内容可能与最新版本有所差异。详细情况请与我们联繫。
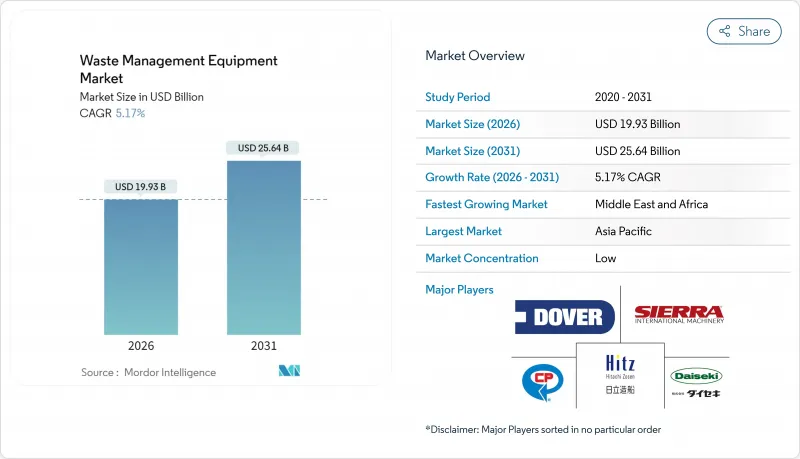
2025年,废弃物管理设备市场价值为189.5亿美元,预计从2026年的199.3亿美元成长到2031年的256.4亿美元,在预测期(2026-2031年)内,复合年增长率为5.17%。
都市废弃物(MSW)量的不断增长、更严格的掩埋转移政策以及对回收基础设施日益增长的投资,都在推动对设备的需求。亚洲和非洲的快速都市化持续对收集和处理能力造成压力,但电子自动化升级仍然是降低成本和满足监管要求的最快路径。商品价格波动和网路安全风险制约着盈利,而设备即服务(EaaS)和绿色采购指令则为全球废弃物管理设备市场的供应商开闢了新的收入来源。
全球废弃物管理设备市场趋势与洞察
快速的都市化和城市废弃物的快速增加
随着大都会圈人口的成长,废弃物产生量的成长速度超过了人口成长速度,迫使市政当局升级垃圾收集车辆、转运站和资源回收设施。世界银行预测,到2050年,全球城市废弃物产生量将增加70%,将加剧撒哈拉以南非洲和南亚地区的基础设施缺口。实施一体化的收集、分类和处理系统可以将未妥善处理的废弃物的社会成本从每吨375美元降低到50-100美元。日本北九州市等城市的例子表明,结合公民参与和即时监测可以使经济成长与废弃物产生脱钩。因此,越来越多的都市区正在为智慧垃圾桶、光学分类机和电动垃圾车分配预算,从而推动全球废弃物管理设备市场的稳定成长。
严格的掩埋规避规定
加州SB 1383法案的目标是到2025年实现75%的有机废弃物回收率,而美国环保署(EPA)则要求容量超过250万吨的掩埋安装气体回收系统。这促使鼓风机、火炬塔和监测设备进行升级改造。像沙加缅度这样的城市,透过安装高容量堆肥设备,有机废弃物分流率已经提高了14%。圣地牙哥和金县的建筑和拆除条例设定了65%的回收率目标,促使建筑商转向使用专用破碎机和分类机。这些法规建立了可预测的升级週期,并鼓励设备购买者优先选择具有成熟分流性能的平台,尤其是自动化分类线。自动化分类线如今已成为全球废弃物管理设备产业的核心合规策略。
先进设备的前期投资成本高
全自动分类线的成本比人工系统高出200%至300%,对小规模的城市来说是一个障碍。车队电气化也会带来类似的成本影响:加州一个地方管理区估计,为一支96辆车的车队进行电气化改造,卡车需要570万美元,充电桩需要77万美元。虽然补贴、税额扣抵和公共产业回扣减轻了负担,但许多买家仍然推迟现代化。目前,EaaS(能源即服务)合约可以抵消部分资本投资成本,但并不能消除预算限制,在资金筹措标准成熟之前,这将减缓全球废弃物管理设备市场短期内的渗透速度。
细分市场分析
到2025年,回收和分类机械将占全球废弃物管理设备市场的68.21%,这标誌着废弃物处理方式正从废弃物处置转向资源回收。光学分类机、弹道分离器和人工智慧视觉机器人正在取代人工分类线,有助于实现废弃物转移目标并减少污染罚款。欧盟和美国部分州的法规强制规定了最低再生材料含量,推动了对高纯度处理设备的需求。供应商强调模组化设计,突显了无需投入大规模土木工程成本即可添加容器、塑胶和纤维生产线的能力。此外,企业净零排放承诺也推动了对消费后再生材料需求的成长,进而促进了这一领域的发展。
废弃物焚化发电设备的销售目前仍处于滞后水平,但预计到2031年,其复合年增长率将达到7.05%,成为成长最快的领域,这主要得益于废弃物焚化发电和碳捕获技术的进步。巴布科克-威尔科克斯公司为亚伯达首个捕碳封存(CCS)工厂设计的前端设备,展现了焚化炉未来也能发挥排放的愿景。掩埋气系统、生物干燥机和厌氧消化器等设备,构成了一套多元化的处理工具,它们与回收相辅相成,而非相互竞争。随着有机废弃物分类的日益普及,食品废弃物包机和堆肥桶等设备正在拓展产品线,并在全球废弃物管理设备市场中创造更多交叉销售机会。
到2025年,非危险废弃物将占全球废弃物管理设备市场规模的90.08%,这反映了城市废弃物(MSW)和商业废弃物的大量产生。标准化的垃圾车、后装式垃圾车和转运站实现了规模经济,共用进行批量订购和共享零件库存。然而,美国环保署(EPA)即将实施的电子清单追踪规则将加速危险废弃物处理设备的成长率,使其复合年增长率达到6.41%,从而推动对密封式滚装货柜、真空货柜和能够收集监管数据的条码阅读器的需求。
专业化使危险废弃物设备製造商能够整合洩漏检测感测器和远端监控功能,并满足更严格的安全标准,从而获得更高的利润率。例如,哥本哈根原子公司 (Copenhagen Atomics) 与 DeepGeo 的合作,凸显了尖端放射性物质处理解决方案的领先地位;与此同时,非危险废物处理系统也正在通过人工智能维修,用于混合塑料流和湿有机物处理,从而提高处理量和材料质量。在双管齐下的成长策略驱动下,全面的产品系列仍是供应商在全球废弃物管理设备市场保持竞争力的核心。
区域分析
到2025年,亚太地区将占据全球废弃物管理设备市场44.12%的份额,这主要得益于中国和印度庞大的城市人口(总合15亿)。各国五年规划都将扩大固态废弃物处理能力列为优先事项,从而推动了对光学分类机和废弃物衍生燃料(RDF)生产线的订单。韩国的人工智慧机器人出口展现了其在区域自动化领域的领先地位,而日本的公民参与模式则体现了彻底分类的益处。供应链的接近性也对供应商有利,预计到2050年,中国将占全球废钢供应量的约45%,这将为该地区的循环经济计划提供支援。
北美地区仍然是一个强劲的替换市场,这主要得益于排放法规和有机废物禁令。加州的《有机废弃物转移法案》和加拿大首个配备碳捕获与封存(CCS)技术的垃圾焚化发电发电厂正在推动对消化器、输送机和气体净化设备的需求。联邦政府对纯电动垃圾车的补贴正在加速车队更新换代,以符合企业的碳减排目标。欧洲的情况也类似。生产者延伸责任制(EPR)提高了再生材料的纯度标准,要求对设备进行人工智慧视觉改造并配备高速弹道分离器。
到2031年,中东和非洲将以6.48%的复合年增长率成为成长最快的地区,波湾合作理事会(GCC)成员国正在废弃物基础设施进行现代化改造,以实现其「2030愿景」的目标。新建的垃圾处理厂通常采用现代化设计,直接采用自动化生产线,而非逐步升级。沙乌地阿拉伯和阿联酋的公私合营特许经营模式稳定了收入来源,并降低了跨国公司的投资风险。撒哈拉以南非洲的城市正在采用模组化传输和移动式打包机来克服资金限制,这为全球废弃物管理设备市场的供应商拓展了机会。
其他福利:
- Excel格式的市场预测(ME)表
- 3个月的分析师支持
目录
第一章 引言
- 研究假设和市场定义
- 调查范围
第二章调查方法
第三章执行摘要
第四章 市场情势
- 市场概览
- 市场驱动因素
- 快速的都市化和城市垃圾的快速增加
- 关于掩埋改道的严格规定
- 在循环经济中回收投资
- 配备人工智慧的自主分类机器人
- 智慧卡车绿色政府采购义务
- 基于设备服务的融资模式
- 市场限制
- 先进设备的高初始资本投资成本
- 二级产品价格波动
- 智慧废弃物平台的网路安全风险
- 熟练维修技师短缺
- 价值/供应链分析
- 监管环境
- 技术展望
- 产业吸引力-波特五力分析
- 新进入者的威胁
- 供应商的议价能力
- 买方的议价能力
- 替代品的威胁
- 竞争对手之间的竞争
第五章 市场规模及成长预测(价值,单位:十亿美元)
- 依产品类型
- 废弃物处理设施
- 废弃物回收及分类设备
- 依废物类型
- 危险品
- 无害材料
- 透过使用
- 住宅和工业废弃物
- 工业废弃物(危险废弃物和非危险废弃物)
- 建筑和拆除废弃物
- 医疗废弃物
- 其他(农业废弃物、采矿和采掘废弃物等)
- 透过技术
- 手动的
- 半自动
- 全自动(相容于智慧物联网/人工智慧等)
- 按地区
- 北美洲
- 美国
- 加拿大
- 墨西哥
- 南美洲
- 巴西
- 阿根廷
- 秘鲁
- 南美洲其他地区
- 欧洲
- 英国
- 德国
- 法国
- 义大利
- 西班牙
- 比荷卢经济联盟(比利时、荷兰、卢森堡)
- 北欧国家(丹麦、芬兰、冰岛、挪威、瑞典)
- 其他欧洲地区
- 亚太地区
- 中国
- 印度
- 日本
- 澳洲
- 韩国
- 东协(印尼、泰国、菲律宾、马来西亚、越南)
- 亚太其他地区
- 中东和非洲
- 沙乌地阿拉伯
- 阿拉伯聯合大公国
- 卡达
- 科威特
- 土耳其
- 埃及
- 南非
- 奈及利亚
- 其他中东和非洲地区
- 北美洲
第六章 竞争情势
- 市场集中度
- 策略趋势
- 市占率分析
- 公司简介
- Wastequip LLC
- Dover Corp.(Environmental Solutions Group)
- TOMRA Systems ASA
- CP Manufacturing Inc.
- Bollegraaf Recycling Solutions
- Recycling Equipment Manufacturing Inc.
- Sierra International Machinery LLC
- Daiseki Co. Ltd.
- Hitachi Zosen Corp.
- Morita Holding Corp.
- Veolia Environnement SA
- SUEZ SA
- Waste Management Inc.
- Republic Services Inc.
- Stericycle Inc.
- Babcock & Wilcox Enterprises
- Alfa Laval AB
- ANDRITZ AG
- Terex Corporation
- EcoGreen Equipment
- TANA Oy
第七章 市场机会与未来展望
The Waste Management Equipment market was valued at USD 18.95 billion in 2025 and estimated to grow from USD 19.93 billion in 2026 to reach USD 25.64 billion by 2031, at a CAGR of 5.17% during the forecast period (2026-2031).
Growing municipal solid-waste (MSW) volumes, stricter landfill-diversion policies, and rising investment in recycling infrastructure are accelerating equipment demand. Rapid urbanization in Asia and Africa keeps collection and processing capacity under pressure, while electronics-enabled automation upgrades remain the quickest path to cost reduction and compliance. Commodity price volatility and cybersecurity risks temper profitability, but equipment-as-a-service and green-procurement mandates open fresh revenue streams for vendors across the Global Waste Management Equipment market.
Global Waste Management Equipment Market Trends and Insights
Rapid Urbanization & MSW Surge
Expanding metropolitan populations generate waste volumes that grow faster than headcounts, pushing municipalities to upgrade fleets, transfer stations, and material-recovery facilities. The World Bank projects global MSW generation to rise 70% by 2050, widening infrastructure gaps in Sub-Saharan Africa and South Asia. Integrated systems cut the USD 375 per-ton societal cost of unmanaged waste to USD 50-100 per ton when collection, sorting, and processing are combined. Japanese examples such as Kitakyushu show that citizen engagement paired with real-time monitoring can decouple economic growth from waste output. As a result, urban areas allocate bigger budgets to smart bins, optical sorters, and electric refuse trucks, keeping the Global Waste Management Equipment market on a steady capacity-addition path.
Stringent Landfill-Diversion Regulations
California's SB 1383 targets a 75% organic-waste recycling rate by 2025, while the U.S. EPA mandates gas-collection systems for landfills larger than 2.5 million Mg, prompting upgrades in blowers, flare stacks, and monitoring gear. Municipalities such as Sacramento have already lifted organic diversion by 14% after installing high-volume composters. Construction and demolition ordinances in San Diego and King County set 65% recovery thresholds, steering builders toward specialized crushers and screeners. These rules establish predictable replacement cycles, forcing equipment buyers to favor platforms that prove diversion metrics, especially automated sorting lines, now central to compliance strategies across the Global Waste Management Equipment industry.
High Upfront CAPEX of Advanced Equipment
Fully automated sorting lines can cost 200-300% more than manual systems, presenting prohibitive hurdles for smaller cities. Fleet electrification offers similar sticker shock: one California regional district calculated USD 5.7 million for trucks and USD 0.77 million for chargers to electrify 96 vehicles. Grants, tax credits, and utility rebates soften the blow, yet many buyers still delay modernization. EaaS contracts now offset CAPEX, but they do not erase budget limits, slowing near-term Global Waste Management Equipment market penetration until financing norms mature.
Other drivers and restraints analyzed in the detailed report include:
- Circular-Economy Recycling Investments
- AI-Powered Autonomous Sorting Robots
- Volatile Secondary-Commodity Prices
For complete list of drivers and restraints, kindly check the Table Of Contents.
Segment Analysis
Recycling and sorting machinery captured 68.21% Global Waste Management Equipment market share in 2025, signifying a structural pivot from disposal toward resource recovery. Optical sorters, ballistic separators, and AI-vision robots increasingly replace manual lines to meet diversion targets and lower contamination penalties. Regulations in the EU and select U.S. states impose minimum recycled-content mandates, creating a pull-through effect for high-purity processing gear. Vendors highlight modularity, allowing facilities to add containers, plastics, or fiber lines without large civil works costs. The segment also benefits from corporate net-zero pledges that raise demand for post-consumer recyclate.
Waste disposal equipment trails in volume but is expected to post the fastest 7.05% CAGR to 2031, driven by waste-to-energy and carbon-capture upgrades. Babcock & Wilcox's front-end design for Alberta's first CCS-equipped plant illustrates a future where incinerators double as emissions-mitigation assets. Landfill-gas systems, bio-dryers, and anaerobic digesters complete a diversified disposal toolkit, complementing recycling rather than competing with it. As organic diversion tightens, food-waste depackagers and composting drums expand their product breadth, amplifying cross-sell opportunities throughout the Global Waste Management Equipment market.
Non-hazardous flows constituted 90.08% of the Global Waste Management Equipment market size in 2025, reflecting ubiquitous MSW and commercial waste volumes. Standardized carts, rear-loaders, and transfer stations achieve economies of scale, allowing bulk orders and shared parts inventories. However, the EPA's forthcoming e-Manifest electronic tracking rule boosts hazardous-waste equipment growth to a 6.41% CAGR, spurring demand for sealed roll-offs, negative-pressure containers, and bar-code readers capable of compliant data capture.
Specialization yields a higher margin for hazardous-waste equipment makers, who integrate leak-detection sensors and remote monitoring to meet stricter safety codes. Partnerships such as Copenhagen Atomics and DeepGeo spotlight cutting-edge radioactive-material handling solutions. Meanwhile, non-hazardous systems welcome AI-retrofits for mixed-plastic streams and wet organics, improving throughput and material quality. Dual-track growth ensures comprehensive product portfolios remain central to vendor competitiveness across the Global Waste Management Equipment market.
The Waste Management Equipment Market Report is Segmented by Source (Residential, Commercial, Industrial, and More), by Service Type (Collection, Transportation, Sorting & Segregation, and More), by Waste Type (Municipal Solid, Industrial Hazardous Waste, E-Waste, and More), and by Geography (North America, South America, Europe, Asia-Pacific and Middle East and Africa). The Market Forecasts are Provided in Terms of Value (USD).
Geography Analysis
Asia-Pacific held 44.12% of the Global Waste Management Equipment market in 2025, anchored by China's and India's urban populations that eclipse 1.5 billion residents combined. National five-year plans prioritize solid-waste capacity, prompting orders for optical sorters and refuse-derived-fuel lines. South Korea's AI-robot exports illustrate regional leadership in automation, while Japan's citizen-engagement model shows the gains possible from meticulous source separation. Supply-chain proximity also benefits equipment vendors, as China is forecast to provide almost 45% of the world's scrap steel by 2050, supporting regional circular-economy projects.
North America remains a steady replacement market where emission caps and organics bans stimulate upgrades. California's organic-diversion law and Canada's first CCS-enabled waste-to-energy plant foster demand for digesters, conveyors, and gas-cleanup skids. Federal grants financing battery-electric refuse fleets accelerate fleet turnover, aligning with corporate carbon pledges. Europe follows similar patterns: extended-producer-responsibility schemes push recyclate purity thresholds, requiring AI-vision retrofits and high-speed ballistic separators.
The Middle East & Africa posts the fastest 6.48% CAGR to 2031 as Gulf Cooperation Council states modernize waste infrastructure to meet Vision 2030 agendas. New plants often leapfrog to the latest designs, opting straight for automated lines rather than incremental upgrades. Public-private concession models in Saudi Arabia and the UAE stabilize revenue streams, lowering investment risk for multinationals. Sub-Saharan cities adopt modular transfer stations and mobile balers to overcome capital constraints, broadening vendor opportunities across the Global Waste Management Equipment market.
- Wastequip LLC
- Dover Corp. (Environmental Solutions Group)
- TOMRA Systems ASA
- CP Manufacturing Inc.
- Bollegraaf Recycling Solutions
- Recycling Equipment Manufacturing Inc.
- Sierra International Machinery LLC
- Daiseki Co. Ltd.
- Hitachi Zosen Corp.
- Morita Holding Corp.
- Veolia Environnement SA
- SUEZ SA
- Waste Management Inc.
- Republic Services Inc.
- Stericycle Inc.
- Babcock & Wilcox Enterprises
- Alfa Laval AB
- ANDRITZ AG
- Terex Corporation
- EcoGreen Equipment
- TANA Oy
Additional Benefits:
- The market estimate (ME) sheet in Excel format
- 3 months of analyst support
TABLE OF CONTENTS
1 Introduction
- 1.1 Study Assumptions & Market Definition
- 1.2 Scope of the Study
2 Research Methodology
3 Executive Summary
4 Market Landscape
- 4.1 Market Overview
- 4.2 Market Drivers
- 4.2.1 Rapid urbanisation & MSW surge
- 4.2.2 Stringent landfill-diversion regulations
- 4.2.3 Circular-economy recycling investments
- 4.2.4 AI-powered autonomous sorting robots
- 4.2.5 Green public-procurement mandates for smart trucks
- 4.2.6 Equipment-as-a-Service financing models
- 4.3 Market Restraints
- 4.3.1 High upfront CAPEX of advanced equipment
- 4.3.2 Volatile secondary-commodity prices
- 4.3.3 Cyber-security risks in smart waste platforms
- 4.3.4 Shortage of skilled service technicians
- 4.4 Value / Supply-Chain Analysis
- 4.5 Regulatory Landscape
- 4.6 Technological Outlook
- 4.7 Industry Attractiveness - Porter's Five Force Analysis
- 4.7.1 Threat of New Entrants
- 4.7.2 Bargaining Power of Suppliers
- 4.7.3 Bargaining Power of Buyers
- 4.7.4 Threat of Substitutes
- 4.7.5 Intensity of Competitive Rivalry
5 Market Size & Growth Forecasts (Values, In USD Billion)
- 5.1 By Product Type
- 5.1.1 Waste Disposal Equipment
- 5.1.2 Waste Recycling & Sorting Equipment
- 5.2 By Waste Type
- 5.2.1 Hazardous
- 5.2.2 Non-Hazardous
- 5.3 By Application
- 5.3.1 Residential & Commercial Waste
- 5.3.2 Industrial Waste (Hazardous & Non-Hazardous)
- 5.3.3 Construction & Demolition Waste
- 5.3.4 Healthcare Waste
- 5.3.5 Others(Agriculture Waste, Mining & Extraction Waste, etc.)
- 5.4 By Technology
- 5.4.1 Manual
- 5.4.2 Semi-Automated
- 5.4.3 Fully Automated(Smart IoT / AI-Enabled, etc.)
- 5.5 By Geography
- 5.5.1 North America
- 5.5.1.1 United States
- 5.5.1.2 Canada
- 5.5.1.3 Mexico
- 5.5.2 South America
- 5.5.2.1 Brazil
- 5.5.2.2 Argentina
- 5.5.2.3 Peru
- 5.5.2.4 Rest of South America
- 5.5.3 Europe
- 5.5.3.1 United Kingdom
- 5.5.3.2 Germany
- 5.5.3.3 France
- 5.5.3.4 Italy
- 5.5.3.5 Spain
- 5.5.3.6 BENELUX (Belgium, Netherlands, and Luxembourg)
- 5.5.3.7 NORDICS (Denmark, Finland, Iceland, Norway, and Sweden)
- 5.5.3.8 Rest of Europe
- 5.5.4 Asia-Pacific
- 5.5.4.1 China
- 5.5.4.2 India
- 5.5.4.3 Japan
- 5.5.4.4 Australia
- 5.5.4.5 South Korea
- 5.5.4.6 ASEAN (Indonesia, Thailand, Philippines, Malaysia, Vietnam)
- 5.5.4.7 Rest of Asia-Pacific
- 5.5.5 Middle East and Africa
- 5.5.5.1 Saudi Arabia
- 5.5.5.2 United Arab Emirates
- 5.5.5.3 Qatar
- 5.5.5.4 Kuwait
- 5.5.5.5 Turkey
- 5.5.5.6 Egypt
- 5.5.5.7 South Africa
- 5.5.5.8 Nigeria
- 5.5.5.9 Rest of Middle East and Africa
- 5.5.1 North America
6 Competitive Landscape
- 6.1 Market Concentration
- 6.2 Strategic Moves
- 6.3 Market Share Analysis
- 6.4 Company Profiles (includes Global level Overview, Market level overview, Core Segments, Financials as available, Strategic Information, Products & Services, and Recent Developments)
- 6.4.1 Wastequip LLC
- 6.4.2 Dover Corp. (Environmental Solutions Group)
- 6.4.3 TOMRA Systems ASA
- 6.4.4 CP Manufacturing Inc.
- 6.4.5 Bollegraaf Recycling Solutions
- 6.4.6 Recycling Equipment Manufacturing Inc.
- 6.4.7 Sierra International Machinery LLC
- 6.4.8 Daiseki Co. Ltd.
- 6.4.9 Hitachi Zosen Corp.
- 6.4.10 Morita Holding Corp.
- 6.4.11 Veolia Environnement SA
- 6.4.12 SUEZ SA
- 6.4.13 Waste Management Inc.
- 6.4.14 Republic Services Inc.
- 6.4.15 Stericycle Inc.
- 6.4.16 Babcock & Wilcox Enterprises
- 6.4.17 Alfa Laval AB
- 6.4.18 ANDRITZ AG
- 6.4.19 Terex Corporation
- 6.4.20 EcoGreen Equipment
- 6.4.21 TANA Oy
7 Market Opportunities & Future Outlook
- 7.1 White-space & Unmet-Need Assessment
 废弃物管理设备市场规模、份额和成长分析:废弃物设备类型和地区划分 - 2026-2033 年产业预测
 废弃物管理设备市场规模、占有率、成长及全球产业分析:依类型、应用和地区划分的洞察与预测(2026-2034)
 厨房废弃物设备市场按产品类型、技术、安装类型、容量、最终用户和分销管道划分-2026年至2032年全球预测废弃物处理冷水机市场按产品类型、冷却技术、电源、最终用户和分销管道划分-2026-2032年全球预测废弃物管理设备市场(按设备、废弃物类型、技术和最终用户划分)—2025-2032 年全球预测
 全球废弃物燃料技术市场
 废弃物管理设备市场-全球产业规模、份额、趋势、机会及预测(按设备类型、废弃物类型、应用、地区及竞争情况划分,2020-2030 年预测)
 废弃物管理设备市场:2024-2031年全球产业分析、规模、占有率、成长、趋势、预测