


 |
市场调查报告书
商品编码
1911709
氮肥:市占率分析、产业趋势与统计、成长预测(2026-2031)Nitrogenous Fertilizers - Market Share Analysis, Industry Trends & Statistics, Growth Forecasts (2026 - 2031) |
||||||
※ 本网页内容可能与最新版本有所差异。详细情况请与我们联繫。
预计到 2026 年,氮肥市场规模将达到 1,845.8 亿美元,高于 2025 年的 1,744 亿美元。
预计到 2031 年将达到 2,451.3 亿美元,2026 年至 2031 年的复合年增长率为 5.84%。
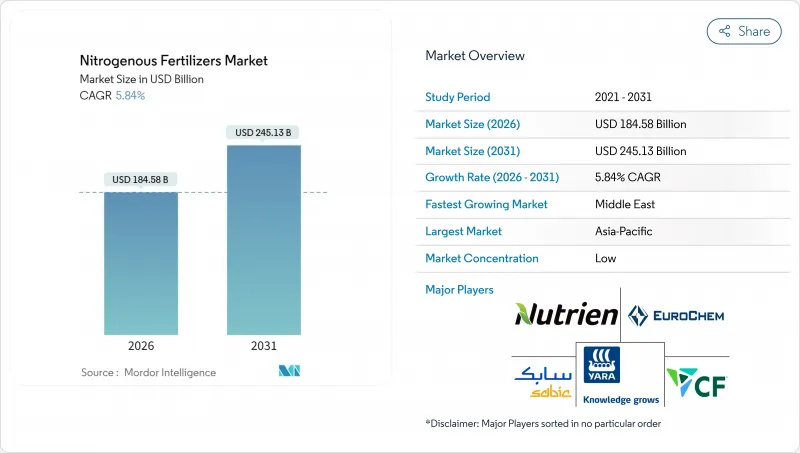
这一增长归功于全球粮食需求的不断增长、农业技术的进步以及养分管理方面的创新。政府透过补贴和政策措施提供的支持仍然是关键因素。例如,欧盟委员会已暂停对尿素和氨征收关税至2024年底,以确保在供应链中断的情况下,化肥的供应、价格可负担性和永续性。从区域来看,亚太地区凭藉其广泛的农业活动、强大的政府支持以及精密农业技术的日益普及,正在引领市场成长。竞争格局的特点是全球企业和区域企业并存,全球企业专注于扩大产能、实现原料多元化并采用低碳技术。同时,区域製造商和专业供应商正透过在地化的分销网络、客製化的产品以及与农业技术平台的合作来扩大市场份额。氮肥市场正在向技术主导和在地化发展转型,为整个价值链的创新和策略成长提供了巨大的机会。
全球氮肥市场趋势及洞察
对主粮作物的需求不断增长
随着世界人口成长,粮食需求激增,农业系统面临越来越大的压力,必须在有限的土地上实现更高的产量。预计到2050年,全球人口将达到97亿,届时粮食产量需要增加约70%才能满足日益增长的营养需求。这种需求的激增正在重塑农业实践,并促使人们更多地使用氮肥来提高作物产量,并在气候变迁的背景下稳定产量。收入的成长,尤其是在发展中地区,正在推动饮食习惯转向富含蛋白质的谷物。这导緻小麦和水稻等作物的种植强度增加,而这些作物需要施用更多的氮肥。日益加剧的气候变迁进一步凸显了稳定产量的必要性,并促进了化学肥料的策略性使用,以稳定产量。在许多地区,人们正在采用一年内轮作玉米、大豆和水稻的多季种植系统,这增加了每公顷的化肥用量。这一趋势反映出人们的关注点在于最大限度地提高现有农地的生产力,而不是扩大耕地面积。
政府对农业投入品的持续支持
世界各国政府都意识到,价格合理的植物营养素对于农村稳定和粮食安全至关重要。许多国家正在扩大支持项目,例如直接投入补贴、运费回馈和低利率贷款,以确保农民能够获得化肥。印度在其2024-2025财年预算中将化肥补贴增加到1.75兆卢比(约210亿美元),确保农民即使在财政紧张的情况下也能继续获得化肥。巴西的「萨夫拉2024-2025计画」包括一项4,000亿雷亚尔(约750亿美元)的化肥采购信贷机制。这些倡议显示私营部门对化肥的需求强劲,并鼓励对生产能力、分销基础设施和技术创新进行投资。一些国家的政府正在推动国内氨生产,以减少对进口的依赖并加强供应链。这项政策转变旨在建立超越价格管制的化肥供应长期韧性。
加强环境法规
旨在减少养分流失和温室气体排放的环境政策正在改变世界各地的化肥使用模式。各国正收紧对施肥时间、用量和产品成分的监管,以保护生态系统和水资源。硝酸盐限量和永续性标准在美国等地区日益普及,迫使农民采用精密农业技术和高效肥料。这些变化正在推动产品开发和施用技术的创新,使化肥使用与环境目标保持一致。随着监管日益严格,氮肥市场将越来越多地采用既能减少环境影响又能维持农艺性能的先进产品。这一转变标誌着该行业在寻求平衡生产力和环境保护方面迈出了关键的一步。
细分市场分析
到2025年,尿素将占据氮肥市场43.12%的份额,预计到2031年将以6.78%的复合年增长率增长,这主要得益于种植者对其46%氮含量和灵活施用方式的认可。尿素的成本优势以及在土壤改良和灌溉肥效方面的适应性,巩固了其在大规模粮食生产系统中的地位。种植者正在升级其设备,采用节能催化剂和排放气体控制设备,以在保持成本竞争力的同时增强供应保障。持续的投资,例如CF Industries在唐纳森维尔的扩建项目,正在提高区域自给自足能力和出口能力,从而巩固尿素在氮肥市场的主导地位。
在灌溉园艺和高价值经济作物中,特种肥料越来越受欢迎,因为精准施肥能够提高利润。硝酸铵在拥有完善法规和储存基础设施的地区仍然十分重要,而无水氨则被用于北美田间作物的直接喷施系统中。随着环保法规的日益严格,对低挥发性和包膜肥料的需求预计将会增加,既能丰富肥料种类,又能维持尿素的核心作用。
预计到2025年,传统肥料将占据氮肥市场92.12%的份额,预测期内复合年增长率(CAGR)为5.86%。这与整体需求趋势相符,因为全球面积的增加和价格敏感度普遍有利于散装颗粒状产品。大规模集中式工厂受惠于规模经济,进而降低单位成本,确保在发展中市场的竞争力。广泛的分销网络和农民的熟悉度也进一步增强了传统肥料在大面积农田上的优势。
特种肥料市场规模小规模,主导控释和缓释技术的进步,这些技术能够提高养分利用效率并最大限度地减少环境损失。用于肥料灌溉和水耕系统的液态肥料在缺水地区具有更大的施用柔软性。水溶性肥料专为温室栽培而设计,满足温室栽培对精准养分管理的需求。儘管特种肥料价格较高,但预计其应用将推动氮肥市场的成长,尤其是在保护地栽培和集约化水果和蔬菜生产领域,因为在这些领域,其收益远大于初始成本。
本氮肥市场报告依产品类型(硝酸铵、无水氨及其他)、形态(常规型、特殊型)、施用方法(灌溉施肥、叶面喷布、土壤施用)、作物类型(田间作物、园艺作物及其他)和地区(亚太地区、欧洲、中东和非洲、北美、南美)进行分析。市场预测以价值(美元)和销售量(公吨)为单位。
区域分析
预计到2025年,亚太地区将占全球氮肥市场规模的35.42%,反映了该地区广大的农业用地、较高的种植密度以及有利的补贴政策。中国对粮食安全的重视以及印度小规模农户的现代化发展,确保了该地区氮肥需求的强劲成长。多种作物轮作制度和高产量杂交品种的日益普及,也使得持续的氮肥投入成为必要。许多区域国家的国内生产能力也降低了对进口的依赖。随着棕榈油、水稻和蔬菜种植的密集发展以满足不断扩大的都市区的需求,新兴东南亚国家的氮肥市场正逐步成长。
预计中东地区将成为成长最快的地区,到2031年复合年增长率将达到6.94%,这得益于其丰富的天然气原料和接近性连接亚非的航运路线的地理优势。阿布达比国家石油公司(ADNOC)、沙乌地基础工业公司(SABIC)和Fertiglobe等企业对蓝氨和绿氨工厂的大规模投资旨在同时满足国内农业计划和出口市场的需求。政府政策正在推动农业多样化,以降低对进口的依赖,并鼓励国内氮肥消费。将碳捕获解决方案整合到新工厂中,使该地区成为低排放供应商,从而增强了其竞争优势。
北美和欧洲市场依然成熟,但仍在不断发展。北美生产商受益于页岩气经济,这增强了他们的出口竞争力,而精密农业的普及也持续推动产量成长。在欧洲,严格的环境政策限制了产量,但也刺激了对高效产品和符合「从农场到餐桌」理念的数位化咨询服务的需求。南美洲市场持续成长,这得益于巴西不断扩张的农业生产和阿根廷产量的恢復,而非洲市场则拥有长期发展潜力,基础设施的改善、信贷管道的畅通以及推广服务的普及推动了化肥的广泛应用。
其他福利:
- Excel格式的市场预测(ME)表
- 3个月的分析师支持
目录
第一章 引言
- 研究假设和市场定义
- 调查范围
- 调查方法
第二章 报告
第三章执行摘要和主要发现
第四章:主要产业趋势
- 主要农作物种植面积
- 田间作物
- 园艺作物
- 平均施肥量
- 宏量营养素
- 田间作物
- 园艺作物
- 宏量营养素
- 具有灌溉设施的农田
- 法律规范
- 价值炼和通路分析
- 市场驱动因素
- 对主粮作物的需求不断增长
- 政府对农业投入品的持续支持
- 氨源多样化
- 优化尿素生产能力
- 加速绿色氨先导计画
- 推出氮利用数位化咨询平台
- 市场限制
- 天然气价格波动
- 加强环境法规
- 化肥贸易中的物流瓶颈
- 生物固氮技术的新兴替代方案
第五章 市场规模和成长预测(价值和数量)
- 产品
- 硝酸铵
- 无水氨
- 尿素
- 其他的
- 形式
- 传统的
- 特别的
- CRF
- 液体肥料
- SRF
- 水溶性
- 施肥方法
- 施肥和灌溉
- 叶面喷布
- 土壤
- 作物类型
- 田间作物
- 园艺作物
- 草坪和观赏植物
- 地区
- 亚太地区
- 澳洲
- 孟加拉
- 中国
- 印度
- 印尼
- 日本
- 巴基斯坦
- 菲律宾
- 泰国
- 越南
- 亚太其他地区
- 欧洲
- 法国
- 德国
- 义大利
- 荷兰
- 俄罗斯
- 西班牙
- 乌克兰
- 英国
- 其他欧洲地区
- 中东
- 土耳其
- 沙乌地阿拉伯
- 其他中东地区
- 非洲
- 南非
- 奈及利亚
- 其他非洲地区
- 北美洲
- 加拿大
- 墨西哥
- 美国
- 北美其他地区
- 南美洲
- 阿根廷
- 巴西
- 南美洲其他地区
- 亚太地区
第六章 竞争情势
- 关键策略倡议
- 市占率分析
- 公司简介
- 公司简介
- Nutrien Ltd.
- Yara International ASA
- CF Industries Holdings, Inc.
- SABIC Agri-Nutrients Company(Saudi Basic Industries Corporation)
- Koch Fertilizer, LLC(Koch Industries, Inc.)
- EuroChem Group AG
- OCI NV
- Coromandel International Limited(Murugappa Group)
- Indian Farmers Fertiliser Co-operative Limited
- Grupa Azoty SA
- Petronas Chemicals Group Berhad(Petroliam Nasional Berhad)
- Abu Qir Fertilizers and Chemical Industries Company
- PT Pupuk Indonesia(Persero)
第七章:CEO们需要思考的关键策略问题
Nitrogenous fertilizers market size in 2026 is estimated at USD 184.58 billion, growing from 2025 value of USD 174.4 billion with 2031 projections showing USD 245.13 billion, growing at 5.84% CAGR over 2026-2031.
This growth is attributed to rising global food demand, advancements in farming practices, and innovations in nutrient management. Government support through subsidies and policy measures remains a critical factor. For instance, the European Commission has suspended tariffs on urea and ammonia until the end of 2024 to ensure the availability, affordability, and sustainability of fertilizers amid supply chain disruptions. Regionally, Asia-Pacific dominates the market due to its extensive agricultural activity, robust government support, and increasing adoption of precision farming technologies. The competitive landscape comprises both global and regional players, while global companies are focusing on capacity expansion, feedstock diversification, and the adoption of low-carbon technologies. Meanwhile, regional producers and specialty suppliers are gaining market share through localized distribution, customized product offerings, and collaborations with agricultural technology platforms. The nitrogenous fertilizers market is evolving into a technology-driven and regionally adaptive industry, offering significant opportunities for innovation and strategic growth across the value chain.
Global Nitrogenous Fertilizers Market Trends and Insights
Rising Demand for Staple Crops
Global population growth is intensifying the demand for food, placing mounting pressure on agricultural systems to deliver higher yields from limited land. As the world's population is projected to reach 9.7 billion by 2050, food production must increase by approximately 70% to meet the growing nutritional needs of this population. This surge in demand is reshaping farming practices, encouraging greater use of nitrogenous fertilizers to boost crop output and stabilize yields amid climate variability. Rising incomes, particularly in developing regions, are shifting dietary preferences toward protein-rich grains, prompting the intensified cultivation of crops like wheat and rice, which require higher nitrogen fertilizer application rates. Climate variability further underscores the need for consistent yields, encouraging the strategic use of fertilizers to stabilize output. In many regions, multiple-cropping systems, which involve rotating maize, soybeans, and rice within a single year, are increasing fertilizer use per hectare. This trend reflects a focus on maximizing productivity on existing farmland rather than expanding acreage.
Sustained Government Support for Agricultural Inputs
Governments worldwide recognize the importance of affordable plant nutrients for rural stability and food security. Many have expanded support programs, including direct input grants, freight rebates, and low-interest loans, to ensure reliable access to fertilizers for farmers. India has increased its fertilizer subsidy budget to INR 1.75 trillion (approximately USD 21 billion) for the fiscal year 2024-25, ensuring continued access for farmers despite fiscal constraints. Brazil's Plano Safra 2024-25 earmarked BRL 400 billion (USD 75 billion) in credit to support fertilizer procurement. These initiatives signal strong demand to the private sector, encouraging investment in production capacity, distribution infrastructure, and innovation. Some governments are promoting domestic ammonia production to reduce their dependency on imports and strengthen their supply chains. This policy shift aims to build long-term resilience in them to fertilizer availability beyond price controls.
Tightening Environmental Regulations
Environmental policies aimed at reducing nutrient runoff and greenhouse gas emissions are reshaping global fertilizer usage. Governments are implementing stricter regulations on application timing, dosage, and product formulations to protect ecosystems and water sources. In regions like the United States, nitrate caps and sustainability benchmarks are becoming increasingly common, prompting farmers to adopt precision methods and more efficient fertilizers. These changes are driving innovation in product development and application technologies, aligning fertilizer use with environmental goals. As regulations tighten, the nitrogenous fertilizers market will increasingly reflect the adoption of advanced products that deliver agronomic performance with reduced environmental impact. This transition represents a significant shift for the industry, striking a balance between productivity and environmental stewardship.
Other drivers and restraints analyzed in the detailed report include:
- Diversification of Ammonia Supply Sources
- Optimization of Urea Production Capacity
- Emergence of Biological Nitrogen-Fixation Alternatives
For complete list of drivers and restraints, kindly check the Table Of Contents.
Segment Analysis
Urea accounted for 43.12% of the nitrogenous fertilizers market share in 2025, with the segment projected to post a 6.78% CAGR to 2031 as growers value its 46% nitrogen concentration and flexible application. Urea's cost advantage and compatibility with both soil incorporation and fertigation underpin its position across large-scale grain systems. Producers are upgrading plants with energy-saving catalysts and emission control units, reinforcing supply security at competitive costs. Continuous investment, such as CF Industries' Donaldsonville expansion, enhances regional self-sufficiency and export capability, sustaining urea's leadership in the nitrogen fertilizer market.
Specialty grades are gaining traction in irrigated horticulture and high-value cash crops, where precise nutrient delivery translates into revenue gains. Ammonium nitrate remains relevant in geographies with established regulations and storage infrastructure, while anhydrous ammonia serves direct injection systems in North American row crops. As environmental scrutiny rises, demand for low-volatility or coated products is set to escalate, adding diversity without displacing urea's central role.
Conventional fertilizers retained a 92.12% share of the nitrogenous fertilizers market size in 2025, expanding at a 5.86% CAGR during the forecast period, broadly in line with overall demand, as global acreage growth and price sensitivity favor bulk granular products. Large centralized plants benefit from economies of scale, which keep unit costs low and ensure competitiveness in developing markets. Widespread dealer networks and farmer familiarity also reinforce the dominance of conventional forms in broad-acre cropping sectors.
Specialty fertilizers represent a smaller segment, led by controlled-release and slow-release technologies that enhance nutrient-use efficiency and minimize environmental losses. Liquid solutions used in fertigation and hydroponic systems broaden application flexibility in water-constrained regions. Water-soluble grades cater to greenhouse operations seeking precise nutrient regimes. Though premium-priced, specialty forms achieve strong adoption where returns justify higher upfront costs, particularly in protected cropping and intensive fruit and vegetable production, promising incremental gains for the nitrogen fertilizer market.
The Nitrogen Fertilizers Market Report is Segmented by Product (Ammonium Nitrate, Anhydrous Ammonia, and Others), Form (Conventional, Specialty), Application Mode (Fertigation, Foliar, and Soil), Crop Type (Field Crops, Horticultural Crops, and Others), and Geography (Asia-Pacific, Europe, Middle East, Africa, North America, and South America). The Market Forecasts are Provided in Terms of Value (USD) and Volume (Metric Tons).
Geography Analysis
The Asia-Pacific region captured 35.42% of the revenue in 2025 of the nitrogenous fertilizers market size, reflecting its vast agricultural land, high cropping intensity, and supportive subsidy frameworks. China's emphasis on food security and India's modernization of smallholder farming guarantee robust baseline demand. Rising adoption of multiple-cropping systems and higher-yielding hybrids requires sustained nitrogen input, and domestic production capacity limits import exposure for many regional players. Emerging Southeast Asian economies are experiencing incremental growth as they intensify palm, rice, and vegetable cultivation to meet the needs of expanding urban centers.
The Middle East delivers the fastest growth at 6.94% CAGR through 2031, leveraging abundant gas feedstock and proximity to shipping lanes that connect Asia and Africa. Large-scale investments in blue and green ammonia plants by ADNOC, SABIC, and Fertiglobe aim to supply both domestic agricultural projects and export markets. Government policies favor agricultural diversification to reduce import dependence, boosting internal consumption of nitrogen fertilizers. Integration of carbon capture solutions in new plants positions the region as a low-emission supplier, strengthening its competitive edge.
North America and Europe maintain mature yet evolving markets. North American producers benefit from shale gas economics that support export competitiveness, while adoption of precision agriculture sustains incremental volume growth. Europe's stringent environmental policy constrains tonnage but spurs demand for enhanced-efficiency products and digital advisory services that align with Farm to Fork objectives. South America grows on the back of Brazilian frontier expansion and Argentine yield recovery, whereas Africa represents long-run potential as infrastructure, credit access, and extension services improve fertilizer penetration.
- Nutrien Ltd.
- Yara International ASA
- CF Industries Holdings, Inc.
- SABIC Agri-Nutrients Company (Saudi Basic Industries Corporation)
- Koch Fertilizer, LLC (Koch Industries, Inc.)
- EuroChem Group AG
- OCI N.V.
- Coromandel International Limited (Murugappa Group)
- Indian Farmers Fertiliser Co-operative Limited
- Grupa Azoty S.A.
- Petronas Chemicals Group Berhad (Petroliam Nasional Berhad)
- Abu Qir Fertilizers and Chemical Industries Company
- PT Pupuk Indonesia (Persero)
Additional Benefits:
- The market estimate (ME) sheet in Excel format
- 3 months of analyst support
TABLE OF CONTENTS
1 INTRODUCTION
- 1.1 Study Assumptions and Market Definition
- 1.2 Scope of the Study
- 1.3 Research Methodology
2 REPORT OFFERS
3 EXECUTIVE SUMMARY AND KEY FINDINGS
4 KEY INDUSTRY TRENDS
- 4.1 Acreage of Major Crop Types
- 4.1.1 Field Crops
- 4.1.2 Horticultural Crops
- 4.2 Average Nutrient Application Rates
- 4.2.1 Primary Nutrients
- 4.2.1.1 Field Crops
- 4.2.1.2 Horticultural Crops
- 4.2.1 Primary Nutrients
- 4.3 Agricultural Land Equipped For Irrigation
- 4.4 Regulatory Framework
- 4.5 Value Chain & Distribution Channel Analysis
- 4.6 Market Drivers
- 4.6.1 Rising Demand for Staple Crops
- 4.6.2 Sustained Government Support for Agricultural Inputs
- 4.6.3 Diversification of Ammonia Supply Sources
- 4.6.4 Optimization of Urea Production Capacity
- 4.6.5 Acceleration of Green Ammonia Pilot Projects
- 4.6.6 Adoption of Digital Advisory Platforms for Nitrogen Use
- 4.7 Market Restraints
- 4.7.1 Volatility in Natural Gas Prices
- 4.7.2 Tightening Environmental Regulations
- 4.7.3 Logistical Bottlenecks in Fertilizer Trade
- 4.7.4 Emergence of Biological Nitrogen-Fixation Alternatives
5 MARKET SIZE AND GROWTH FORECASTS (VALUE AND VOLUME)
- 5.1 Product
- 5.1.1 Ammonium Nitrate
- 5.1.2 Anhydrous Ammonia
- 5.1.3 Urea
- 5.1.4 Others
- 5.2 Form
- 5.2.1 Conventional
- 5.2.2 Speciality
- 5.2.2.1 CRF
- 5.2.2.2 Liquid Fertilizer
- 5.2.2.3 SRF
- 5.2.2.4 Water Soluble
- 5.3 Application Mode
- 5.3.1 Fertigation
- 5.3.2 Foliar
- 5.3.3 Soil
- 5.4 Crop Type
- 5.4.1 Field Crops
- 5.4.2 Horticultural Crops
- 5.4.3 Turf & Ornamental
- 5.5 Region
- 5.5.1 Asia-Pacific
- 5.5.1.1 Australia
- 5.5.1.2 Bangladesh
- 5.5.1.3 China
- 5.5.1.4 India
- 5.5.1.5 Indonesia
- 5.5.1.6 Japan
- 5.5.1.7 Pakistan
- 5.5.1.8 Philippines
- 5.5.1.9 Thailand
- 5.5.1.10 Vietnam
- 5.5.1.11 Rest of Asia-Pacific
- 5.5.2 Europe
- 5.5.2.1 France
- 5.5.2.2 Germany
- 5.5.2.3 Italy
- 5.5.2.4 Netherlands
- 5.5.2.5 Russia
- 5.5.2.6 Spain
- 5.5.2.7 Ukraine
- 5.5.2.8 United Kingdom
- 5.5.2.9 Rest of Europe
- 5.5.3 Middle East
- 5.5.3.1 Turkey
- 5.5.3.2 Saudi Arabia
- 5.5.3.3 Rest of Middle East
- 5.5.4 Africa
- 5.5.4.1 South Africa
- 5.5.4.2 Nigeria
- 5.5.4.3 Rest of Africa
- 5.5.5 North America
- 5.5.5.1 Canada
- 5.5.5.2 Mexico
- 5.5.5.3 United States
- 5.5.5.4 Rest of North America
- 5.5.6 South America
- 5.5.6.1 Argentina
- 5.5.6.2 Brazil
- 5.5.6.3 Rest of South America
- 5.5.1 Asia-Pacific
6 COMPETITIVE LANDSCAPE
- 6.1 Key Strategic Moves
- 6.2 Market Share Analysis
- 6.3 Company Landscape
- 6.4 Company Profiles (Includes Global Level Overview, Market Level Overview, Core Segments, Financials as Available, Strategic Information, Market Rank/Share for Key Companies, Products and Services, and Recent Developments)
- 6.4.1 Nutrien Ltd.
- 6.4.2 Yara International ASA
- 6.4.3 CF Industries Holdings, Inc.
- 6.4.4 SABIC Agri-Nutrients Company (Saudi Basic Industries Corporation)
- 6.4.5 Koch Fertilizer, LLC (Koch Industries, Inc.)
- 6.4.6 EuroChem Group AG
- 6.4.7 OCI N.V.
- 6.4.8 Coromandel International Limited (Murugappa Group)
- 6.4.9 Indian Farmers Fertiliser Co-operative Limited
- 6.4.10 Grupa Azoty S.A.
- 6.4.11 Petronas Chemicals Group Berhad (Petroliam Nasional Berhad)
- 6.4.12 Abu Qir Fertilizers and Chemical Industries Company
- 6.4.13 PT Pupuk Indonesia (Persero)
7 KEY STRATEGIC QUESTIONS FOR FERTILIZER CEOS
 氮肥市场:按类型、形态、作物和分销管道划分-2026-2032年全球预测
 氮肥市场规模、份额、趋势和预测:按类型、作物类型、形态、应用方法和地区划分,2026-2034年
 氮肥市场分析及预测(至2035年):类型、产品、应用、技术、最终用户、形态、製程、功能、设备、解决方案
 全球氮肥市场规模、份额、趋势和成长分析报告(2026-2034年)
 全球氮肥市场报告(2026 年)氮肥市场-2026-2031年预测日本氮肥市场报告:按类型、作物、形态、施用方法和地区划分(2026-2034年)
 氮肥市场规模、份额及成长分析(按类型、作物类型、形态和地区划分)-产业预测(2026-2033 年)
 氮肥市场 - 全球产业规模、份额、趋势、机会和预测,按产品、应用、地区和竞争细分,2020-2030 年
 氮肥市场评估:按产品类型、形式、作物类型、应用模式和地区划分的机会和预测(2018-2032 年)