


 |
市场调查报告书
商品编码
1911710
钾肥:市占率分析、产业趋势与统计、成长预测(2026-2031)Potash Fertilizer - Market Share Analysis, Industry Trends & Statistics, Growth Forecasts (2026 - 2031) |
||||||
※ 本网页内容可能与最新版本有所差异。详细情况请与我们联繫。
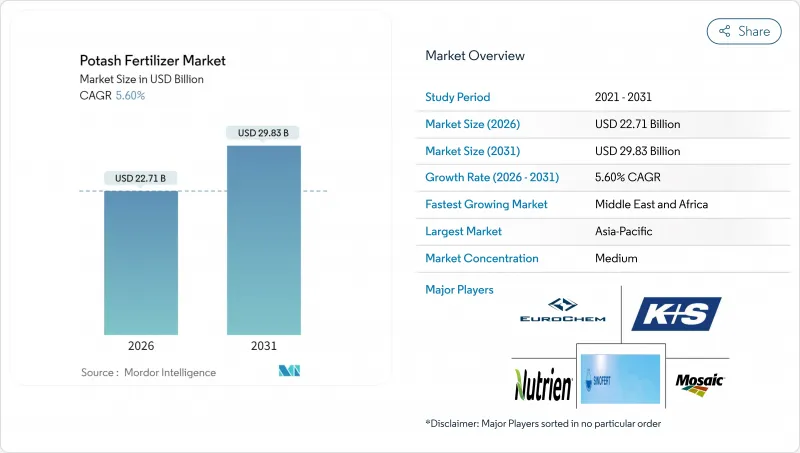
预计到 2026 年,钾肥市场规模将达到 227.1 亿美元,高于 2025 年的 215.1 亿美元,预计到 2031 年将达到 298.3 亿美元,2026 年至 2031 年的复合年增长率为 5.6%。
强劲的长期需求主要受以下因素驱动:集约化耕作地区土壤养分加速流失、精准施肥技术的快速普及,以及中国政策主导的饲料配方调整促进了国内粮食增产。在生产方面,海湾地区特种作物种植面积的成长、盐穴仓储设施对绿氢能的新兴工业需求,以及企业为实现净零排放目标所做的努力,也推高了成本,其中低氯化钾硫酸盐被推荐用于敏感土壤。巴西的物流瓶颈和能源价格波动也造成了成本压力,而主要供应商正透过扩大产能、整合分销网络和提供数位化农业服务来应对,从而将农业化学品更深入地融入决策流程。这些因素共同表明,钾肥市场将在2030年之前持续成长。
全球钾肥市场趋势与洞察
集约化农业区土壤养分消耗日益加剧
数十年来高产量的玉米-大豆轮作和双季种植制度消耗了土壤中的钾蕴藏量,其速度超过了自然风化作用的补充速度,导致许多表层土壤功能性缺钾。在美国中西部,目前大部分(60%)耕地的钾含量低于农艺基准值,儘管化肥投入创纪录,但自2021年以来,这一比例仍在逐季上升。类似的土壤劣化也发生在中国的长江粮仓地区,那里集约化的稻麦轮作缩短了休耕期,阻碍了有机质的恢復。巴西塞拉多地区新开垦的土地最初看起来肥沃,但五个作物季节后,土壤中的天然矿物质就会氧化流失,需要大量施用钾肥。这些相互交织的模式形成了一种结构性的消费基础,使钾肥市场免受面积週期性波动的影响。农学家警告说,如果不解决这种营养缺乏问题,全球粮食产量可能会在 10 年内下降 6-8%,这进一步凸显了持续施用钾肥的迫切性。
加速精准施肥技术的推广
可变施肥量撒播机、频谱无人机和田间钾肥探针使农民能够识别出传统均匀施肥方式难以发现的微量缺钾区域。约翰迪尔公司的数据显示,面积超过2000英亩的农场在改用分区施肥后,钾肥总用量增加了15%,有效纠正了潜在的低钾区域。数位化平台还能记录施肥时间,确保在作物吸收高峰期前数小时而非数天施用钾肥,进而提高谷物重量和农场利润。设备製造商正在将感测器和软体整合到融资方案中,降低了初期采用门槛,并加速了玉米带和加拿大草原地区的推广应用。欧洲通用农业政策(CAP)透过报销数位测绘费用,进一步推动了精准农业的发展,预计到2025年,德国和法国40%的大型农场将采用精密农业。随着这些工具在中型农场的普及,钾肥市场将持续成长,抵销效率提升带来的部分效益。
地缘政治制裁限制了白俄罗斯钾肥出口
欧盟的限制措施于2024年3月生效,导致白俄罗斯约1,200万吨钾肥产能停产(相当于全球贸易量的五分之一)。由于贸易商争相寻找替代货源,现货价格在短短几週内飙升了30%。由于供应链重组,运往东南亚的海运时间延长了两个月。印度和中国的进口商转向俄罗斯和加拿大的矿商,但铁路和港口的拥塞限制了替代供应。银行对与白俄罗斯相关的信用证交易持谨慎态度,增加了融资溢价,这些溢价最终转嫁到农业投入成本上。虽然部分受制裁的钾肥供应可能透过第三国流通,但不确定性导致使用者对远期合约仍保持谨慎。这些限制措施预计至少会持续到2026年,这将限制钾肥市场的潜在上涨空间。
细分市场分析
到2025年,氯化钾将占钾肥市场86.05%的份额,这反映了其在大规模粮食生产系统中作为低成本营养基础的重要作用。氯化钾之所以广受欢迎,是因为它与常见的喷雾器和铁路运输网络兼容,从而能够快速地在农业区之间进行大规模运输。对于利润微薄的玉米、大豆和小麦种植者而言,钾肥的单价仍是一个决定性因素。因此,即使价格呈现上涨趋势,氯化钾仍是采购计画的基石。
由于可控制环境农业和对氯化物敏感作物的普及,硫酸钾的年复合成长率高达5.85%。温室番茄、鲜食葡萄和马铃薯种植者重视硫酸钾的低氯化物特性,有助于提升产品品质并获得出口溢价。欧洲在硫酸钾的应用方面处于领先地位,德国和荷兰已在温室中广泛使用。北美果蔬种植者也正在效仿。
本钾肥市场报告按产品类型(氯化钾、硫酸钾及其他)、施用方法(灌溉施肥、叶面喷布、土壤施用)、作物类型(田间作物、园艺作物、草坪及观赏植物)和地区(北美、南美、欧洲、亚太、中东和非洲)进行细分。市场预测以价值和销售两种形式呈现。
区域分析
亚太地区将占据全球钾肥市场最大的区域份额,到2025年将占全球市场份额的41.90%。预计到2031年,该地区将以5.5%的复合年增长率增长,这主要得益于其多样化的农业系统,涵盖了从高密度粮食种植区到不断扩大的多年生作物种植区。儘管价格上涨,但支持精密农业投入和均衡养分添加的政策奖励正在推动钾肥施用量的增加。对可控环境农业的投资创造了对低氯化物等级肥料的全年稳定需求,这与大面积生产的氯化钾形成互补。资源丰富经济体的矿业服务公司也开始涉足肥料分销业务,有助于提高偏远产区的供应稳定性。
预计北美和中东及非洲地区将经历最快的成长,2026年至2031年的复合年增长率将达到6.82%。在北美,变数施肥技术的广泛应用正在揭示隐藏的钾肥缺乏问题,提高单位面积的施肥效率,同时增加养分总利用率。同时,灌溉设施的扩建和粮食安全计画正在使中东和非洲干旱及半干旱地区以前的边缘土地得到利用。用于沙漠温室的特殊硫酸盐肥料的供应与用于新种植的大量氯化钾肥料相辅相成,有助于平衡该地区的产品结构。
欧洲和南美洲的经验表明,当养分管理和出口竞争力相匹配时,成熟的耕地仍然可以推动需求成长。东欧生产商正致力于土壤修復并实施区域取样,而西欧市场则青睐符合有机认证要求的高品质硫酸盐混合肥料。儘管面临物流瓶颈和汇率波动,南美洲钾肥市场预计仍将以显着的复合年增长率成长。铁路和港口基础设施的持续改善,以及数位化农艺工具的日益普及,有望缓解供应紧张局面,并维持该地区的成长势头。
其他福利:
- Excel格式的市场预测(ME)表
- 3个月的分析师支持
目录
第一章 引言
- 研究假设和市场定义
- 调查范围
- 调查方法
第二章 报告
第三章执行摘要和主要发现
第四章:主要产业趋势
- 主要农作物种植面积
- 田间作物
- 园艺作物
- 平均施肥量
- 宏量营养素
- 田间作物
- 园艺作物
- 宏量营养素
- 具有灌溉设施的农田
- 法规结构
- 价值炼和通路分析
- 市场驱动因素
- 集约化耕作区土壤养分消耗加剧
- 加速大型生产商采用精准施肥技术
- 中国饲料法规转换:转向以谷物为主的畜禽饲料配方
- 海湾地区高价值园艺特色作物的扩张(被低估了)
- 用于盐穴季节性储存以储存绿色氢气的钾肥需求被低估
- 企业净零排放目标推动低氯化物土壤中硫酸钾的需求(被低估了)
- 市场限制
- 地缘政治制裁限制了白俄罗斯钾肥出口
- 天然气价格波动推高了下游化肥成本。
- 扩大再生农业的采用,减少合成投入物的使用
- 巴西内陆港口基础设施瓶颈被低估了
第五章 市场规模和成长预测(价值和数量)
- 类型
- MoP
- SoP
- 其他的
- 应用模式
- 施肥和灌溉
- 叶面喷布
- 土壤
- 作物类型
- 田间作物
- 园艺作物
- 草坪和观赏植物
- 地区
- 亚太地区
- 澳洲
- 孟加拉
- 中国
- 印度
- 印尼
- 日本
- 巴基斯坦
- 菲律宾
- 泰国
- 越南
- 亚太其他地区
- 欧洲
- 法国
- 德国
- 义大利
- 荷兰
- 俄罗斯
- 西班牙
- 乌克兰
- 英国
- 其他欧洲地区
- 中东和非洲
- 沙乌地阿拉伯
- 土耳其
- 南非
- 奈及利亚
- 其他中东和非洲地区
- 北美洲
- 加拿大
- 墨西哥
- 美国
- 北美其他地区
- 南美洲
- 阿根廷
- 巴西
- 南美洲其他地区
- 亚太地区
第六章 竞争情势
- 关键策略倡议
- 市占率分析
- 公司概况
- 公司简介
- Nutrien Ltd.
- The Mosaic Company
- Uralkali PJSC
- K+S Aktiengesellschaft
- Israel Chemicals Ltd.
- EuroChem Group AG
- JSC Belaruskali
- Arab Potash Company PLC
- Compass Minerals International Inc.
- Intrepid Potash Inc.
- Sinofert Holdings Ltd.
- Sociedad Quimica y Minera de Chile SA
- Yara International ASA
- BHP Group Limited
- Canpotex Limited
第七章:CEO们需要思考的关键策略问题
potash fertilizer market size in 2026 is estimated at USD 22.71 billion, growing from 2025 value of USD 21.51 billion with 2031 projections showing USD 29.83 billion, growing at 5.6% CAGR over 2026-2031.
Strong long-term demand arises from accelerating soil-nutrient depletion across intensively farmed regions, rapid adoption of precision-application tools, and policy-driven shifts in Chinese livestock feed formulations that boost domestic grain output. Producers are also benefiting from rising specialty crop acreage in Gulf states, an emerging industrial pull from green-hydrogen salt caverns, and corporate net-zero commitments that favor low-chloride sulfate of potash for sensitive soils. While logistics bottlenecks in Brazil and energy-price swings add cost pressure, leading suppliers are countering through capacity expansions, integrated distribution, and digital agronomy services that embed the product more deeply into farm decision cycles. Together, these forces point to continued momentum for the potash fertilizer market through 2030.
Global Potash Fertilizer Market Trends and Insights
Rising Soil-Nutrient Depletion in Intensively Farmed Regions
Decades of high-yield corn-soybean rotations and double-cropping systems have stripped potassium reserves faster than natural weathering can replace them, leaving many topsoils functionally deficient . In the U.S. Midwest, 60% of fields now test below agronomic sufficiency thresholds, a share that has risen every season since 2021 despite record fertilizer outlays. Similar erosion is unfolding in China's Yangtze grain belt, where intensive rice-wheat schedules compress fallow windows and prevent organic matter recovery. Newly cultivated Brazilian cerrado land appears fertile at first, yet within five growing cycles, it requires heavy potash doses as native minerals are oxidized and leached. These overlapping patterns create a structural consumption floor that insulates the potash fertilizer market from cyclical acreage swings. Agronomists warn that failing to close the nutrient gap could slice global cereal yields by 6-8% within a decade, reinforcing the urgency of sustained potassium application.
Accelerating Adoption of Precision-Application Technologies
Variable-rate spreaders, multispectral drones, and in-field potassium probes now let growers pinpoint micro-zones of deficiency that blanket applications once missed. John Deere data show farms above 2,000 acres raise total potash use by 15% after switching to zone-specific prescriptions because hidden low-K strips are finally corrected. Digital platforms also timestamp each pass, ensuring potassium is placed hours rather than days before peak plant uptake, which boosts grain weight and farmer revenue. Equipment makers bundle sensors and software into financing packages, lowering upfront barriers and speeding adoption in the Corn Belt and Canadian Prairies. Europe's Common Agricultural Policy adds fuel by reimbursing digital mapping costs, pushing precision adoption toward 40% of large holdings in Germany and France in 2025. As these tools migrate to medium-sized farms, the potash fertilizer market gains a durable volume lift that offsets incremental efficiency gains.
Geopolitical Sanctions Limiting Belaruskali Exports
European Union restrictions that took effect in March 2024 sidelined nearly 12 million tons of Belarusian potash capacity, equal to one fifth of global traded volume. Spot prices spiked 30% within weeks as traders scrambled for replacement cargoes, and ocean freight times to Southeast Asia lengthened by two months while supply chains realigned. Importers in India and China turned to Russian and Canadian miners, yet rail and port congestion capped replacement flows. Banks grew wary of letters of credit tied to Belarus, adding financing premiums that filter down to farm input costs. Though some sanctioned volumes may leak through third-country channels, uncertainty keeps users cautious about forward bookings. This constraint will persist at least through 2026, dampening potential upside for the potash fertilizer market.
Other drivers and restraints analyzed in the detailed report include:
- Shifting Chinese Feed Regulations Toward Grain-Based Livestock Rations
- Growing Specialty Crop Acreage for High-Value Gulf Horticulture
- Volatile Natural-Gas Prices Inflating Downstream Costs
For complete list of drivers and restraints, kindly check the Table Of Contents.
Segment Analysis
Muriate of Potash held 86.05% of the potash fertilizer market share in 2025, reflecting its role as the low-cost nutrient foundation for large grain systems. Its popularity stems from compatibility with common spreaders and rail networks that move bulk volumes quickly across farm belts. Cost per unit of potassium remains the deciding factor for corn, soybean, and wheat growers who manage thin operating margins. As a result, muriate continues to anchor procurement plans even when prices cycle upward.
Sulfate of Potash is expanding at a faster 5.85% CAGR as controlled-environment farms and chloride-sensitive crops gain ground. Growers of greenhouse tomatoes, table grapes, and potatoes value sulfate's low chloride profile, which supports product quality and export premiums. Europe leads adoption, with Germany and the Netherlands using it widely in heated glasshouses, while North America fruit and vegetable producers follow closely.
The Potash Fertilizer Market Report is Segmented by Product (Muriate of Potash, Sulfate of Potash, and Others), Application Mode (Fertigation, Foliar, and Soil), Crop Type (Field Crops, Horticultural Crops, and Turf and Ornamental), and Geography (North America, South America, Europe, Asia-Pacific, Middle East, and Africa). The Market Forecasts are Provided in Terms of Value and Volume.
Geography Analysis
The Asia-Pacific region captured 41.90% of the global potash fertilizer market share in 2025, representing the largest regional share. The region is projected to advance through 2031 at 5.5% CAGR, as diversified farming systems range from high-intensity grain belts to expanding perennial plantations. Policy incentives that subsidize precision inputs and balanced nutrition are increasing application rates, even as prices rise. Investments in controlled-environment agriculture add steady, year-round demand for low-chloride grades that complement broad-acre muriate volumes. Mining service firms in resource-rich economies are also pivoting into fertilizer distribution, improving supply security across remote production zones.
North America, the Middle East, and Africa are expected to experience the fastest expansion pace at a 6.82% CAGR between 2026 and 2031. In North America, widespread variable-rate technology is revealing hidden potassium deficits that push total nutrient use upward even as per-acre efficiency climbs. Concurrently, irrigation build-outs and food security programs across arid and semi-arid regions in the Middle East and Africa are unlocking previously marginal cropland. Specialty sulfate shipments into desert greenhouses complement bulk muriate flows into new row-crop estates, balancing the regional product mix.
Europe and South America demonstrate how mature acreage can still drive demand when nutrient stewardship and export competitiveness are aligned. Eastern European growers are rebuilding depleted soils and adopting zone sampling, while Western markets favor premium sulfate blends that mesh with organic labeling requirements. South America's potash fertilizer market is projected to grow at a significant CAGR, despite logistics bottlenecks and currency fluctuations. Ongoing rail and port upgrades, combined with the wider adoption of digital agronomy tools, are expected to alleviate supply constraints and sustain the region's growth momentum.
- Nutrien Ltd.
- The Mosaic Company
- Uralkali PJSC
- K+S Aktiengesellschaft
- Israel Chemicals Ltd.
- EuroChem Group AG
- JSC Belaruskali
- Arab Potash Company PLC
- Compass Minerals International Inc.
- Intrepid Potash Inc.
- Sinofert Holdings Ltd.
- Sociedad Quimica y Minera de Chile S.A.
- Yara International ASA
- BHP Group Limited
- Canpotex Limited
Additional Benefits:
- The market estimate (ME) sheet in Excel format
- 3 months of analyst support
TABLE OF CONTENTS
1 Introduction
- 1.1 Study Assumptions & Market Definition
- 1.2 Scope of the Study
- 1.3 Research Methodology
2 Report Offers
3 Executive Summary and Key Findings
4 Key Industry Trends
- 4.1 Acreage Of Major Crop Types
- 4.1.1 Field Crops
- 4.1.2 Horticultural Crops
- 4.2 Average Nutrient Application Rates
- 4.2.1 Primary Nutrients
- 4.2.1.1 Field Crops
- 4.2.1.2 Horticultural Crops
- 4.2.1 Primary Nutrients
- 4.3 Agricultural Land Equipped For Irrigation
- 4.4 Regulatory Framework
- 4.5 Value Chain & Distribution Channel Analysis
- 4.6 Market Drivers
- 4.6.1 Rising soil-nutrient depletion in intensively farmed regions
- 4.6.2 Accelerating adoption of precision-application technologies among large growers
- 4.6.3 Shifting Chinese feed regulations toward grain-based livestock rations
- 4.6.4 Growing specialty crop acreage for high-value horticulture in Gulf states (under-reported)
- 4.6.5 Potash demand from green-hydrogen salt caverns for seasonal storage (under-reported)
- 4.6.6 Corporate net-zero pledges driving sulfate-of-potash in low-chloride soils (under-reported)
- 4.7 Market Restraints
- 4.7.1 Geopolitical sanctions limiting Belaruskali exports
- 4.7.2 Volatile natural-gas prices inflating downstream fertilizer costs
- 4.7.3 Rising adoption of regenerative farming that lowers synthetic-input intensity
- 4.7.4 Infrastructure bottlenecks at Brazilian inland ports (under-reported)
5 Market Size and Growth Forecasts (Value and Volume)
- 5.1 Type
- 5.1.1 MoP
- 5.1.2 SoP
- 5.1.3 Others
- 5.2 Application Mode
- 5.2.1 Fertigation
- 5.2.2 Foliar
- 5.2.3 Soil
- 5.3 Crop Type
- 5.3.1 Field Crops
- 5.3.2 Horticultural Crops
- 5.3.3 Turf & Ornamental
- 5.4 Region
- 5.4.1 Asia-Pacific
- 5.4.1.1 Australia
- 5.4.1.2 Bangladesh
- 5.4.1.3 China
- 5.4.1.4 India
- 5.4.1.5 Indonesia
- 5.4.1.6 Japan
- 5.4.1.7 Pakistan
- 5.4.1.8 Philippines
- 5.4.1.9 Thailand
- 5.4.1.10 Vietnam
- 5.4.1.11 Rest of Asia-Pacific
- 5.4.2 Europe
- 5.4.2.1 France
- 5.4.2.2 Germany
- 5.4.2.3 Italy
- 5.4.2.4 Netherlands
- 5.4.2.5 Russia
- 5.4.2.6 Spain
- 5.4.2.7 Ukraine
- 5.4.2.8 United Kingdom
- 5.4.2.9 Rest of Europe
- 5.4.3 Middle East and Africa
- 5.4.3.1 Saudi Arabia
- 5.4.3.2 Turkey
- 5.4.3.3 South Africa
- 5.4.3.4 Nigeria
- 5.4.3.5 Rest of Middle East and Africa
- 5.4.4 North America
- 5.4.4.1 Canada
- 5.4.4.2 Mexico
- 5.4.4.3 United States
- 5.4.4.4 Rest of North America
- 5.4.5 South America
- 5.4.5.1 Argentina
- 5.4.5.2 Brazil
- 5.4.5.3 Rest of South America
- 5.4.1 Asia-Pacific
6 Competitive Landscape
- 6.1 Key Strategic Moves
- 6.2 Market Share Analysis
- 6.3 Company Landscape
- 6.4 Company Profiles (Includes Global level Overview, Market level Overview, Core Segments, Financials as Available, Strategic Information, Market Rank/Share for Key Companies, Products and Services, and Recent Developments)
- 6.4.1 Nutrien Ltd.
- 6.4.2 The Mosaic Company
- 6.4.3 Uralkali PJSC
- 6.4.4 K+S Aktiengesellschaft
- 6.4.5 Israel Chemicals Ltd.
- 6.4.6 EuroChem Group AG
- 6.4.7 JSC Belaruskali
- 6.4.8 Arab Potash Company PLC
- 6.4.9 Compass Minerals International Inc.
- 6.4.10 Intrepid Potash Inc.
- 6.4.11 Sinofert Holdings Ltd.
- 6.4.12 Sociedad Quimica y Minera de Chile S.A.
- 6.4.13 Yara International ASA
- 6.4.14 BHP Group Limited
- 6.4.15 Canpotex Limited


