


 |
市场调查报告书
商品编码
1911712
叶面喷布:市场占有率分析、产业趋势与统计、成长预测(2026-2031)Foliar Fertilizer - Market Share Analysis, Industry Trends & Statistics, Growth Forecasts (2026 - 2031) |
||||||
※ 本网页内容可能与最新版本有所差异。详细情况请与我们联繫。
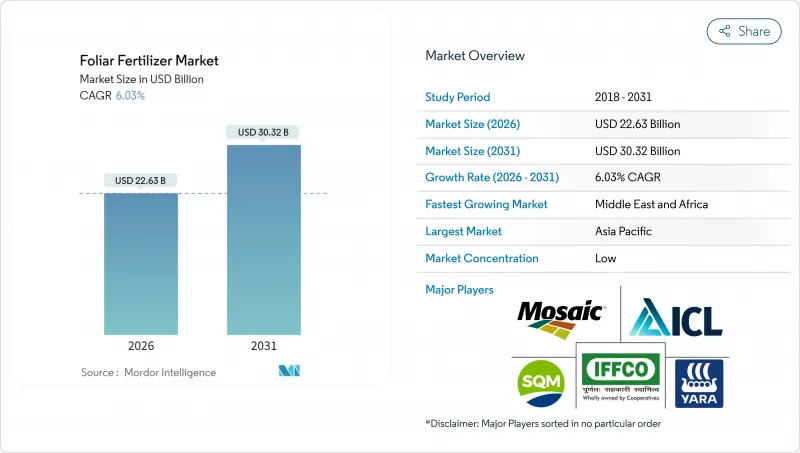
预计叶面喷布市场规模将从 2025 年的 213.4 亿美元成长到 2026 年的 226.3 亿美元,到 2031 年将达到 303.2 亿美元,2026 年至 2031 年的复合年增长率为 6.03%。
这一增长得益于作物养分管理技术的快速现代化、精密农业平台的整合以及政府鼓励均衡施肥的奖励。亚太地区主导潮流,中国和印度的补贴计画加速了科技的普及。同时,中东和非洲地区正经历最快的成长,沙漠农业正转向节水型养分供应。复合型多营养素肥料配方正受到寻求一步式解决方案的种植者的青睐,而激励叶面喷布通讯协定的排碳权计划则为早期采用者创造了新的收入来源。市场竞争依然适中,前五名供应商仅占三分之一的销售额,因此产品创新和区域伙伴关係仍然至关重要。
全球叶面喷布市场趋势与洞察
平衡施肥计划的动力日益增强
农业推广机构建议采用叶面施肥作为一种有针对性的方法,在不影响大量营养元素供应的情况下解决微量元素缺乏问题。玉米和大豆的产量试验表明,在土壤施用氮磷肥的基础上,补充叶面喷施锌锰肥,可使产量提高10%至15%。遵循4R原则(适当的肥料来源、适当的用量、适当的时间、适当的地点)可以减少养分流失,并有助于符合相关法规。美国的公共成本分担计画可补贴高达30%的叶面喷布成本,加速了该技术的推广应用。供应商正在将教育服务纳入其销售方案中,以培养品牌忠诚度并提高复购率。
精密农业应用的快速普及
变数喷洒器、无人机田间调查和物联网 (IoT) 遥测技术正透过根据田间差异调整施肥量,提升叶面肥料市场的绩效。数据驱动的施肥时间优化可减少 25% 的过度施肥,并提高养分利用效率。用户正在整合卫星植被指数和天气预报,以确定肥料渗透性最佳的叶片生长阶段,从而提高吸收率。目前,设备投资回收期平均为三年,这项阈值正推动中型农场的投资。硬体供应商正与肥料生产商合作,透过将软体授权与营养液捆绑销售,建立更牢固的通路伙伴关係。
硝酸盐和磷酸盐原料价格波动
2024年,能源市场动盪导致硝酸铵价格上涨45%,严重挤压了依赖高纯度原料的液体叶面喷布生产商的利润空间。儘管期货合约可以缓解部分风险,但小规模生产商缺乏对冲所需的信贷额度。由于被迫进行现货采购,许多公司不得不在高峰期限制产量,导致供应中断。随着大型公司寻求规模经济效益,产业整合可能会加速。中国磷酸盐出口监管政策的改变也为长期规划带来了更多不确定性。
细分市场分析
到2025年,单一成分产品将占据叶面肥料市场50.18%的份额。这主要归功于单一营养素产品成本低且用量灵活。然而,复合配方产品的复合年增长率将达到6.19%,显示种植者对多种营养素的便利性有着强劲的需求。与非螯合盐相比,复合奈米螯合配方可延长营养素在植物体内的停留时间,并将吸收率提高20%。与生物刺激剂的混合相容性使得单次施用即可实现营养补充和抗逆性缓解,从而减少人工投入。同时,简单的铁锌喷雾对于柑橘黄化病等急性病害的防治至关重要,这表明简单产品和复合产品是互补的,而非相互排斥的。复合产品的监管申报需要更多的残留数据,这给了资金有限的新参与企业一个障碍。
为了因应这一趋势,欧洲和以色列正在升级其螯合处理厂。市场策略着重于为作物提供全方位的营养,固定期限的供应合约在主要温室种植区日益普遍。在只需纠正单一营养缺乏的大型粮食田中,单一成分产品仍有市场需求,尤其是在阿根廷和哈萨克。同时,由于原物料成本上涨导致定价权不足,商品化盐产品正面临越来越大的折扣压力。
叶面肥料市场报告按类型(复合肥和单质肥)、作物类型(田间作物、园艺作物、草坪和观赏植物)以及地区(北美、南美、欧洲、亚太、中东和非洲)进行细分。市场预测以价值(美元)和数量(公吨)为单位。
区域分析
到2025年,亚太地区将占全球收入的43.78%。这主要得益于中国政府的补贴计划,该计划涵盖了叶面喷布采购成本的20%。印度农民肥料合作社(IFFCO)等印度合作社在2025年将奈米脲喷施量扩大到300万公升,提高了农民的认知度。热带气候多变,也有利于分次施肥,因此叶面施肥可以在季风淋失期间补充土壤养分。分销管道的进步,例如越南的太阳能冷藏仓库,正在减少对温度敏感的溶液的变质。与州立大学的研究合作正在提高产品在地化程度,电子商务通路正在触及小规模农户丛集。北美是一个成熟但创新主导的产业。精密农业的互联互通和碳抵消支付创造了多层次的奖励。在爱荷华州的先导计画中,叶面硫肥和可变速率氮肥相结合,减少了 12% 的合成肥料用量,帮助玉米种植者达到永续性指标。
加拿大的无污染燃料法规为实施排放措施的种植者提供积分,叶面喷布方法现在也计入合规要求。咨询服务是争夺市场份额的关键,将遥感探测分析与产品供应相结合的公司,其续约率是仅供应投入品的供应商的两倍。欧洲正在努力平衡成长与监管限制。欧盟的「从农场到餐桌」战略要求到2030年减少20%的化肥使用量,并将资金用于能够显着减少土壤侵蚀的高效叶面喷施技术。荷兰园艺业率先使用硝酸镁叶面喷布滴灌系统,在维持低径流的同时,使温室黄瓜产量提高了15%。东欧正成为生产扩张的驱动力,而波兰和罗马尼亚正在对其农业机械进行现代化改造。更严格的微量元素残留标准要求对产品进行配方调整,以符合欧洲食品安全局的限制。能够快速获得认证的供应商将有机会在市场上获得先发优势。
中东和非洲地区正经历最快成长,年复合成长率达6.42%。沙乌地阿拉伯的「2030愿景」计画正在资助水耕大型农场,这些农场大量依赖叶面喷布来保护沙漠水资源。肯亚酪梨出口商正在使用低浓度铜叶面喷施混合物,以满足欧洲严格的残留标准并提高出口接受率。儘管基础设施仍有不足,但行动低温运输单元正在进入城市边缘地区,并有助于减少废弃物。南非粮食产业正在试验使用无人机进行叶面氮肥喷施,以应对尿素价格上涨,并实现了8%的增产。
其他福利:
- Excel格式的市场预测(ME)表
- 3个月的分析师支持
目录
第一章 引言
- 研究假设和市场定义
- 调查范围
- 调查方法
第二章 报告
第三章执行摘要和主要发现
第四章:主要产业趋势
- 主要农作物种植面积
- 田间作物
- 园艺作物
- 平均应用率
- 微量营养素
- 田间作物
- 园艺作物
- 宏量营养素
- 田间作物
- 园艺作物
- 次要大量营养元素
- 田间作物
- 园艺作物
- 微量营养素
- 具有灌溉设施的农田
- 法律规范
- 价值炼和通路分析
- 市场驱动因素
- 平衡施肥计划的动力日益增强
- 精密农业应用的快速普及
- 扩大高附加价值园艺作物的种植面积
- 扩大与碳信用挂钩的叶面养分管理方案
- 在农场混合叶面肥料和生物活性物质
- 奈米螯合营养配方可降低施用量
- 市场限制
- 硝酸盐和磷酸盐原料价格波动;
- 作物在关键生长阶段后叶面吸收的局限性
- 出口市场对叶面微量元素基准值更加严格
- 需要温控的液体产品的物流挑战
第五章 市场规模及成长预测(数量与价值)
- 类型
- 合成的
- 直的
- 按营养成分
- 微量营养素
- 含氮
- 磷酸盐
- 钾
- 次要大量营养素
- 按营养成分
- 作物类型
- 田间作物
- 园艺作物
- 草坪和观赏植物
- 地区
- 亚太地区
- 澳洲
- 孟加拉
- 中国
- 印度
- 印尼
- 日本
- 巴基斯坦
- 菲律宾
- 泰国
- 越南
- 亚太其他地区
- 欧洲
- 法国
- 德国
- 义大利
- 荷兰
- 俄罗斯
- 西班牙
- 乌克兰
- 英国
- 其他欧洲地区
- 中东和非洲
- 奈及利亚
- 沙乌地阿拉伯
- 南非
- 土耳其
- 其他中东和非洲地区
- 北美洲
- 加拿大
- 墨西哥
- 美国
- 北美其他地区
- 南美洲
- 阿根廷
- 巴西
- 南美洲其他地区
- 亚太地区
第六章 竞争情势
- 关键策略倡议
- 市占率分析
- 公司概况
- 公司简介
- Grupa Azoty SA
- Haifa Chemicals Ltd
- ICL Group Ltd
- Indian Farmers Fertiliser Cooperative Ltd
- Sociedad Quimica y Minera de Chile SA
- The Mosaic Company
- UPL Limited
- Yara International ASA
- Nutrien Ltd
- K+S Aktiengesellschaft
- EuroChem Group AG
- Coromandel International Ltd
- CF Industries Holdings Inc.
- Yara International ASA
- Brandt Inc.
第七章:CEO们需要思考的关键策略问题
The foliar fertilizer market is expected to grow from USD 21.34 billion in 2025 to USD 22.63 billion in 2026 and is forecast to reach USD 30.32 billion by 2031 at 6.03% CAGR over 2026-2031.
Rapid modernization of crop nutrition, integration of precision-ag platforms, and government incentives that reward balanced fertilization underpin this growth. Asia-Pacific dominates because subsidy programs in China and India accelerate adoption. At the same time, the Middle East and Africa are the fastest-growing regions as desert farming pivots toward water-efficient nutrient delivery. Complex, multi-nutrient blends gain traction as growers look for single-pass solutions, and carbon-credit schemes that reward foliar protocols create new income streams for early adopters. Competitive intensity remains moderate; the top five suppliers command only one-third of sales, so product innovation and regional partnerships remain pivotal.
Global Foliar Fertilizer Market Trends and Insights
Rising push toward balanced fertilization programs
Extension agencies endorse foliar feeding as a targeted method to correct micronutrient shortages without disturbing macronutrient regimes. Yield trials in corn and soybeans show 10-15% gains when foliar zinc and manganese supplement soil-applied nitrogen and phosphorus. Adherence to the 4R (Right Source, Right Rate, Right Time, Right Place) framework reduces leaching, supporting regulatory compliance. Public cost-share programs in the United States reimburse up to 30% of foliar application expenses, motivating faster technology turnover. Suppliers position educational services as part of the sales package, strengthening brand loyalty and raising repeat-purchase rates.
Rapid adoption of precision-ag applications
Variable-rate sprayers, drone scouting, and IoT (Internet of Things) telemetry elevate foliar fertilizer market performance by matching dosage to in-field variability. Data-driven timing cuts over-application by 25% and improves nutrient-use efficiency. Users integrate satellite vegetation indices with weather forecasts to pinpoint the most permeable leaf stages, boosting uptake. Equipment payback periods now average three years, a threshold that persuades medium-sized farms to invest. Hardware vendors partner with fertilizer producers to bundle software licenses with nutrient packages, weaving stronger channel partnerships.
Volatility in raw-material prices for nitrates and phosphates
Ammonium nitrate prices climbed 45% in 2024 due to energy-market turmoil, squeezing margins for liquid foliar producers that rely on high-purity inputs. Forward contracts mitigate some risk, yet small manufacturers lack the credit lines to hedge. Spot sourcing forces many to ration production in peak season, disrupting supply. Industry consolidation could accelerate as bigger firms pursue economy-of-scale procurement. Regulatory reviews of phosphate exports from China inject further uncertainty into long-term planning.
Other drivers and restraints analyzed in the detailed report include:
- Increasing high-value horticultural acreage
- Growth of carbon-credit linked foliar nutrition schemes
- Limited crop-leaf absorption beyond critical phenological windows
For complete list of drivers and restraints, kindly check the Table Of Contents.
Segment Analysis
Straight products account for 50.18% of the foliar fertilizer market share in 2025 because their single-nutrient focus offers low cost and flexible dosing. Yet complex blends show a 6.19% CAGR, indicating a stronger pull from growers who want multi-nutrient convenience. Complex nanochelated formulas extend nutrient residence time, lifting uptake by 20% compared with unchelated salts. Their tank-mix compatibility with biostimulants trims labor because one pass suffices for both nutrition and stress mitigation. Straight iron or zinc sprays remain vital for acute corrections, such as citrus greening defense, underscoring a complementary rather than exclusive relationship. Regulatory dossiers for complex products demand more residue data, creating barriers that deter low-cap ex entrants.
Suppliers upscale chelation plants in Europe and Israel to match this momentum. Marketing positions revolve around "complete crop diets," and subscription supply contracts gain traction in greenhouse hubs. Straight products keep traction in broad-acre cereals where single-deficiency fixes suffice, especially in Argentina and Kazakhstan. Discounting pressure intensifies because commoditized salts face rising raw-material costs without parallel pricing power.
The Foliar Fertilizer Market Report is Segmented by Type (Complex and Straight), Crop Type (Field Crops, Horticultural Crops, and Turf and Ornamental), and Geography (North America, South America, Europe, Asia-Pacific, The Middle East, and Africa). The Market Forecasts are Provided in Terms of Value (USD) and Volume (Metric Tons).
Geography Analysis
Asia-Pacific contributed 43.78% of global revenue in 2025, as government rebate programs in China covered up to 20% of foliar purchase costs. Indian cooperatives such as Indian Farmers Fertiliser Cooperative Limited (IFFCO) scaled nano-urea sprays to 3 million liters in 2025, widening farmer familiarity. Tropical climatic variability also favors split applications, so foliar feeding supplements soil regimes during monsoon leaching events. Distribution advances, including solar-powered cold stores in Vietnam, reduce spoilage for temperature-sensitive solutions. Research partnerships with state universities sharpen product localization, and e-commerce channels reach smallholder clusters. North America offers a mature but innovation-driven arena. Precision-ag connectivity and carbon-offset payments create layered incentives. Pilot projects in Iowa report that foliar sulfur combined with variable-rate nitrogen cuts total synthetic use by 12%, helping maize growers meet sustainability metrics.
Canada's Clean Fuel Regulations credit growers for emission-reducing practices, and foliar methods count toward compliance. Market-share battles hinge on advisory services; companies that bundle remote sensing analytics with product supply win renewals at double the rate of input-only vendors. Europe balances growth with regulatory constraint. The European Union Farm to Fork strategy mandates a 20% fertilizer reduction by 2030, steering funds toward high-efficiency foliar technologies that slash soil losses. Dutch horticulture pioneers foliar magnesium nitrate drip-mist systems that lift greenhouse cucumber yields 15% while maintaining low runoff. Eastern Europe emerges as a volume booster as Poland and Romania upgrade machinery fleets. Micronutrient residue thresholds tighten, forcing reformulation to comply with European Food Safety Authority limits. Suppliers that certify quickly enjoy first-mover shelf access.
The Middle East and Africa grows fastest at 6.42% CAGR. Saudi Vision 2030 funds hydroponic megafarms that lean heavily on foliar inputs to conserve desert water. Kenyan avocado exporters meet strict European residue caps using low-rate copper foliar mixes, boosting export acceptance rates. Infrastructure gaps persist, but mobile cold-chain units now reach peri-urban hubs, reducing spoilage. South Africa's grain sector trials drone-based foliar nitrogen to offset high urea prices, showing 8% yield uplift.
- Grupa Azoty S.A.
- Haifa Chemicals Ltd
- ICL Group Ltd
- Indian Farmers Fertiliser Cooperative Ltd
- Sociedad Quimica y Minera de Chile SA
- The Mosaic Company
- UPL Limited
- Yara International ASA
- Nutrien Ltd
- K+S Aktiengesellschaft
- EuroChem Group AG
- Coromandel International Ltd
- CF Industries Holdings Inc.
- Yara International ASA
- Brandt Inc.
Additional Benefits:
- The market estimate (ME) sheet in Excel format
- 3 months of analyst support
TABLE OF CONTENTS
1 INTRODUCTION
- 1.1 Study Assumptions and Market Definition
- 1.2 Scope of the Study
- 1.3 Research Methodology
2 REPORT OFFERS
3 EXECUTIVE SUMMARY AND KEY FINDINGS
4 KEY INDUSTRY TRENDS
- 4.1 Acreage Of Major Crop Types
- 4.1.1 Field Crops
- 4.1.2 Horticultural Crops
- 4.2 Average Nutrient Application Rates
- 4.2.1 Micronutrients
- 4.2.1.1 Field Crops
- 4.2.1.2 Horticultural Crops
- 4.2.2 Primary Nutrients
- 4.2.2.1 Field Crops
- 4.2.2.2 Horticultural Crops
- 4.2.3 Secondary Macronutrients
- 4.2.3.1 Field Crops
- 4.2.3.2 Horticultural Crops
- 4.2.1 Micronutrients
- 4.3 Agricultural Land Equipped For Irrigation
- 4.4 Regulatory Framework
- 4.5 Value Chain and Distribution Channel Analysis
- 4.6 Market Drivers
- 4.6.1 Rising push toward balanced fertilization programs
- 4.6.2 Rapid adoption of precision-ag applications
- 4.6.3 Increasing high-value horticultural acreage
- 4.6.4 Growth of carbon-credit linked foliar nutrition schemes
- 4.6.5 On-farm biostimulant blending with foliar fertilizers
- 4.6.6 Nanochelated nutrient formulations lowering application rates
- 4.7 Market Restraints
- 4.7.1 Volatility in raw-material prices for nitrates and phosphates
- 4.7.2 Limited crop-leaf absorption beyond critical phenological windows
- 4.7.3 Residue-limit tightening for foliar micronutrients in export markets
- 4.7.4 Logistics bottlenecks for temperature-sensitive liquid products
5 MARKET SIZE AND GROWTH FORECASTS (VALUE AND VOLUME)
- 5.1 Type
- 5.1.1 Complex
- 5.1.2 Straight
- 5.1.2.1 By Nutrient
- 5.1.2.1.1 Micronutrients
- 5.1.2.1.2 Nitrogenous
- 5.1.2.1.3 Phosphatic
- 5.1.2.1.4 Potassic
- 5.1.2.1.5 Secondary Macronutrients
- 5.1.2.1 By Nutrient
- 5.2 Crop Type
- 5.2.1 Field Crops
- 5.2.2 Horticultural Crops
- 5.2.3 Turf and Ornamental
- 5.3 Region
- 5.3.1 Asia-Pacific
- 5.3.1.1 Australia
- 5.3.1.2 Bangladesh
- 5.3.1.3 China
- 5.3.1.4 India
- 5.3.1.5 Indonesia
- 5.3.1.6 Japan
- 5.3.1.7 Pakistan
- 5.3.1.8 Philippines
- 5.3.1.9 Thailand
- 5.3.1.10 Vietnam
- 5.3.1.11 Rest of Asia-Pacific
- 5.3.2 Europe
- 5.3.2.1 France
- 5.3.2.2 Germany
- 5.3.2.3 Italy
- 5.3.2.4 Netherlands
- 5.3.2.5 Russia
- 5.3.2.6 Spain
- 5.3.2.7 Ukraine
- 5.3.2.8 United Kingdom
- 5.3.2.9 Rest of Europe
- 5.3.3 Middle East and Africa
- 5.3.3.1 Nigeria
- 5.3.3.2 Saudi Arabia
- 5.3.3.3 South Africa
- 5.3.3.4 Turkey
- 5.3.3.5 Rest of Middle East and Africa
- 5.3.4 North America
- 5.3.4.1 Canada
- 5.3.4.2 Mexico
- 5.3.4.3 United States
- 5.3.4.4 Rest of North America
- 5.3.5 South America
- 5.3.5.1 Argentina
- 5.3.5.2 Brazil
- 5.3.5.3 Rest of South America
- 5.3.1 Asia-Pacific
6 COMPETITIVE LANDSCAPE
- 6.1 Key Strategic Moves
- 6.2 Market Share Analysis
- 6.3 Company Landscape
- 6.4 Company Profiles (includes Global level Overview, Market level overview, Core Segments, Financials as available, Strategic Information, Market Rank/Share for key companies, Products and Services, and Recent Developments)
- 6.4.1 Grupa Azoty S.A.
- 6.4.2 Haifa Chemicals Ltd
- 6.4.3 ICL Group Ltd
- 6.4.4 Indian Farmers Fertiliser Cooperative Ltd
- 6.4.5 Sociedad Quimica y Minera de Chile SA
- 6.4.6 The Mosaic Company
- 6.4.7 UPL Limited
- 6.4.8 Yara International ASA
- 6.4.9 Nutrien Ltd
- 6.4.10 K+S Aktiengesellschaft
- 6.4.11 EuroChem Group AG
- 6.4.12 Coromandel International Ltd
- 6.4.13 CF Industries Holdings Inc.
- 6.4.14 Yara International ASA
- 6.4.15 Brandt Inc.

