


 |
市场调查报告书
商品编码
1911754
有机肥料:市场占有率分析、产业趋势与统计、成长预测(2026-2031)Organic Fertilizer - Market Share Analysis, Industry Trends & Statistics, Growth Forecasts (2026 - 2031) |
||||||
※ 本网页内容可能与最新版本有所差异。详细情况请与我们联繫。
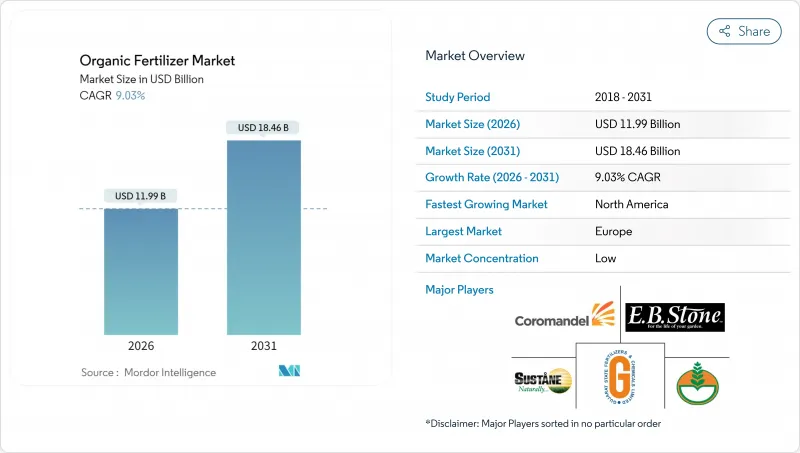
2025年有机肥料市场价值110亿美元,预计2031年将达到184.6亿美元,高于2026年的119.9亿美元。
预计在预测期(2026-2031 年)内,复合年增长率将达到 9.03%。
日益增长的永续性需求、消费者对洁净标示食品的需求以及对高碳投入品的监管处罚,正在推动各大作物系统采用清洁标籤产品。儘管欧洲目前主导市场,但北美产能的快速扩张和政府补贴计画的不断扩大,正使成长重心向西半球转移。将牲畜粪便、食物废弃物和作物残渣转化为标准化、无病原体颗粒的技术创新,不仅延长了保质期,提高了营养成分的可预测性,还缩小了与传统合成肥料的成本差距。同时,企业为实现净零排放目标所做的努力,正在推动与认证生产商签订长期供应协议,从而稳定收入预测并降低投资风险。
全球有机肥料市场趋势与洞察
政府激励措施和补贴
公共支出正在重塑有机肥料市场的成本经济模式。美国农业部(USDA)的肥料生产扩张计画将在2025年前向国内产能注入1.163亿美元,其中包括2,500万美元用于利用黑蝇进行废弃物增值回收,以及1,280万美元用于农场堆肥。欧盟的类似资金筹措管道,例如爱尔兰的有机转化津贴德国的三年风险缓解方案,正在缩小有机肥料与合成肥料的价格差距。这些奖励,加上日益严格的环境法规,正在有效地引导生产商转向低碳替代方案。随着补贴降低资本门槛,小规模设施数量激增,本地供应的韧性增强,运输距离也缩短。政府津贴与自愿性碳市场结合,创造了双重收入来源,进一步增强了计划的经济效益。
消费者对有机食品的需求日益增长
有机食品的消费仍然强劲,有机贸易协会 (OTA) 预测,到 2024 年,有机食品的销售额将保持两位数成长。注重健康的年轻一代以及疫情期间的消费习惯,都促使消费者优先选择无化学添加的农产品。为了达到其范围 3 的排放目标,各大品牌正在转向认证供应链,例如百事可乐欧洲公司承诺在 2030 年每年采购低碳肥料。高端食品价格的上涨提高了农场利润率,使农民能够在维持产量的同时应对不断上涨的投入成本。这种需求驱动力正促使大型经销商将认证有机农产品作为标准库存,使有机肥料市场从利基市场转变为供应链的基础市场。
生产成本高于合成肥料
有机肥料的单位养分成本仍比尿素或磷酸一铵高出30-50%。这主要是由于批次堆肥、较长的成熟週期和较高的劳动密集度所造成的。较低的养分密度也导致更高的施用量,从而推高了旺季的燃料和资本成本。虽然补贴正在缩小差距,但许多商业作物种植者的利润率仍然很低,因此在监管允许的情况下,合成肥料在经济上是可行的。短途雾化装置透过降低运输成本缓解了部分问题,但在当地原材料价格高企和劳动力市场紧张的时期,这种虚假的经济效益仍然存在。
细分市场分析
截至2025年,畜禽粪便衍生产品占有机肥料市场份额的42.58%,预计到2031年将保持领先地位,年复合增长率达9.62%,这既反映了市场的成熟度,也体现了其成长空间。畜禽存栏量的增长以及农场自用沼气池的广泛应用(可将粪便加工成无病原体颗粒)推动了该细分市场的发展。有机农作物种植者的强劲需求支撑了市场销售量,而特种水果和坚果行业正在试用由高温高温堆肥畜禽粪便製成的叶面喷布配方。
循环经济的经济学原理支撑着该产业的韧性。加州酪农合作社将分离的固态投入蚯蚓过滤床,生产富含营养的堆肥,从而将原本的废弃物处理负担转化为经济效益。除臭接种剂的专利申请数量激增,有效解决了社区长期以来对附近堆肥的反对意见。与生物固形物相比,该领域原料可追溯性强,因此能够更快地获得有机肥料认证机构 (OMRI) 的註册,有助于在认证计画中儘早获得种植面积。加工能力的提升缩短了平均运输距离,降低了物流成本,进一步增强了有机肥料市场的竞争力。
有机肥料市场报告按类型(动物粪便、粉状肥料等)、作物类型(经济作物、园艺作物、田间作物等)和地区(非洲、亚太地区、欧洲等)细分。市场预测以价值(美元)和数量(公吨)为单位。
区域分析
到2025年,欧洲将占全球有机食品收入的40.35%,这一地位源于欧盟的「从农场到餐桌」战略,该战略旨在到2030年将25%的农业用地转化为有机耕地。德国的补贴计画在转换的第一年报销高达70%的认证费用,显着降低了生产商的财务风险。该地区成熟的有机食品零售业支撑着稳定的下游溢价,即使在家庭支出低迷的情况下,也能实现年度复合消费成长。 COMPO集团位于明斯特的先进缓释技术工厂将于2024年运作,这将提高营养输送的精准度,巩固欧洲作为引领未来全球品质标准技术潮流的先锋地位。
北美是成长最快的地区,预计到2031年将以11.55%的复合年增长率成长。这主要得益于美国农业部(USDA)肥料生产扩张计画为76家工厂提供的资金支持。加州拥有多项重大创新技术,包括先进的昆虫废弃物处理技术。应对气候变迁的承诺,尤其是来自大型加工食品公司的承诺,正在推动向有机采购的转变,从而对原料供应商提出了更高的要求。在加拿大草原地区,一家豆类加工厂和一家堆肥厂正在整合,以将高蛋白粉用作土壤改良剂,进一步促进该地区的循环经济发展。
亚太地区被视为最大的未开发市场。公私合营,例如KRIBHCO与Novonesis合作,以每英亩500-600卢比(6.3-7.5美元)的价格销售「Rizosuper」肥料,展现了弥合价格和技术知识差距的策略。中国环境的改善促进了多卤石的进口,这种互补的矿产资源与有机基材相容。泰国的一体化肥料产业园区自2024年底运作中以来,已开始向国内外用户供应肥料,征兆该地区将在预测期内从进口地区转型为具有竞争力的出口地区。
其他福利:
- Excel格式的市场预测(ME)表
- 3个月的分析师支持
目录
第一章 引言
- 研究假设和市场定义
- 调查范围
- 调查方法
第二章 报告
第三章执行摘要和主要发现
第四章:主要产业趋势
- 有机耕作面积
- 人均有机产品支出
- 法律规范
- 澳洲
- 巴西
- 加拿大
- 中国
- 法国
- 德国
- 印度
- 印尼
- 义大利
- 日本
- 墨西哥
- 荷兰
- 菲律宾
- 俄罗斯
- 西班牙
- 泰国
- 土耳其
- 英国
- 美国
- 越南
- 价值炼和通路分析
- 市场驱动因素
- 政府激励措施和补贴
- 消费者对有机食品的需求日益增长
- 限制化肥的环境法规
- 扩大经认证的有机农田
- 循环经济中的废弃物化肥料伙伴关係
- 利用感测器进行堆肥品质分析
- 市场限制
- 生产成本高于合成肥料
- 营养成分和品质标准不一致
- 来自生质能源和饲料产业的原料竞争
- 物流排放法规对大宗堆肥运输处以罚款
第五章 市场规模及成长预测(价值及数量)
- 形式
- 堆肥
- 以膳食为基础的肥料
- 油饼
- 其他有机肥料
- 作物类型
- 经济作物
- 园艺作物
- 田间作物
- 地区
- 非洲
- 按国家/地区
- 埃及
- 奈及利亚
- 南非
- 其他非洲地区
- 按国家/地区
- 亚太地区
- 按国家/地区
- 澳洲
- 中国
- 印度
- 印尼
- 日本
- 菲律宾
- 泰国
- 越南
- 亚太其他地区
- 按国家/地区
- 欧洲
- 按国家/地区
- 法国
- 德国
- 义大利
- 荷兰
- 俄罗斯
- 西班牙
- 土耳其
- 英国
- 其他欧洲地区
- 按国家/地区
- 中东
- 按国家/地区
- 伊朗
- 沙乌地阿拉伯
- 其他中东地区
- 按国家/地区
- 北美洲
- 按国家/地区
- 加拿大
- 墨西哥
- 美国
- 北美其他地区
- 按国家/地区
- 南美洲
- 按国家/地区
- 阿根廷
- 巴西
- 南美洲其他地区
- 按国家/地区
- 非洲
第六章 竞争情势
- 关键策略倡议
- 市占率分析
- 公司概况
- 公司简介
- Coromandel International Ltd
- Italpollina SPA
- Gujarat State Fertilizers and Chemicals Ltd
- Deepak Fertilisers and Petrochemicals Corp. Ltd
- EBStone and Sons Inc
- Biolchim SPA(JM Huber Corporation)
- Sustane Natural Fertilizer Inc.
- Fertikal NV
- Nature Safe(Darling Ingredients Inc.)
- California Organic Fertilizers Inc.(Wilbur-Ellis Agribusiness)
- BioFert Manufacturing Inc.(Excel Industries Ltd)
- Indogulf BioAg LLC
- Midwestern BioAg
- True Organic Products Inc.
- The Espoma Company
第七章:CEO们需要思考的关键策略问题
The organic fertilizer market was valued at USD 11 billion in 2025 and estimated to grow from USD 11.99 billion in 2026 to reach USD 18.46 billion by 2031, at a CAGR of 9.03% during the forecast period (2026-2031).
Rising sustainability mandates, consumer demand for clean-label food, and regulatory penalties on high-carbon inputs are propelling adoption across all major crop systems. Europe currently anchors market leadership, while rapid capacity expansions in North America and widening government subsidy programs tip the growth balance toward the Western Hemisphere. Technology upgrades that convert manure, food waste, and crop residues into standardized, pathogen-free granules are improving shelf life and nutrient predictability, narrowing the historical cost gap with synthetics. Simultaneously, corporate net-zero commitments are funneling long-term offtake agreements to certified producers, locking in revenue visibility and lowering investment risk.
Global Organic Fertilizer Market Trends and Insights
Government Incentives and Subsidies
Public spending is redefining the cost economics of the organic fertilizer market. The United States Department of Agriculture (USDA) Fertilizer Production Expansion Program injected USD 116.3 million in 2025 into domestic capacity, including USD 25 million for black soldier fly waste-upcycling and USD 12.8 million for on-farm manure processing. Comparable European Union funding channels, such as Ireland's organic transition grants and Germany's three-year risk-reduction packages, compress price differentials with synthetic fertilizers. These incentives align with tightening environmental rules, effectively boxing growers into lower-carbon alternatives. As subsidies reduce capital barriers, smaller facilities proliferate, increasing regional supply resilience and shortening transportation distances. When combined with voluntary carbon markets, government grants create dual revenue streams that further strengthen project economics.
Rising Consumer Demand for Organic Food
Organic food spending has remained robust, with the Organic Trade Association reporting double-digit sales growth through 2024. Health-focused younger demographics and pandemic-era purchasing habits continue to prioritize chemical-free produce. Brands are shifting procurement toward certified supply chains to hit Scope 3 emissions targets, evidenced by PepsiCo Europe's agreement to source low-carbon fertilizers annually by 2030. Premium grocery price points widen farm gate margins, allowing growers to absorb higher input costs while sustaining yields. This demand pull has convinced mainstream distributors to list organic-labeled produce as standard inventory, moving the organic fertilizer market from niche to baseline supply chain status.
Higher Production Cost Than Synthetic Fertilizers
Organic formulations remain 30-50% more expensive per nutrient unit than urea or monoammonium phosphate, mainly due to batch-based composting, longer curing cycles, and higher labor intensity. Lower nutrient density also translates to heavier application rates, raising fuel and equipment expenses during peak planting windows. While subsidies narrow the gap, many commodity growers still face thin margins that make synthetics economically compelling when stewardship rules allow. Short-haul micro-granulation plants mitigate part of the problem by cutting transport costs, yet false economies persist if regional feedstock prices spike or labor markets tighten.
Other drivers and restraints analyzed in the detailed report include:
- Environmental Regulations Limiting Chemical Fertilizers
- Expansion of Certified Organic Farmland
- Inconsistent Nutrient Content and Quality Standards
For complete list of drivers and restraints, kindly check the Table Of Contents.
Segment Analysis
Manure-based products commanded 42.58% of the organic fertilizer market share in 2025 and are projected to maintain the top slot with a 9.62% CAGR through 2031, reflecting simultaneous maturity and room for growth. The segment benefits from rising livestock populations and on-farm digesters that sanitize manure into pathogen-free pellets. Robust demand from organic row-crop growers anchors baseline volumes, while specialty fruit and nut operations are piloting foliar formulations derived from manures treated with high-temperature thermophilic composting.
Circular-economy economics underpin the manure segment's resilience. Dairy cooperatives in California feed separated solids into vermifiltration beds that yield nutrient-rich castings, monetizing what was historically a disposal liability. Patent filings on odor-control inoculants have surged, tackling a longstanding community opposition barrier to nearby manure processing. The segment also enjoys faster OMRI listing times than biosolids, owing to well-documented feedstock traceability, positioning it to capture early-adopter acreage in certification programs. As capacity expands, average haul distances shorten, trimming logistics bills and further polishing its competitive profile within the organic fertilizer market.
The Organic Fertilizer Market Report is Segmented by Form (Manure, Meal-Based Fertilizers, and More), Crop Type (Cash Crops, Horticultural Crops and Row Crops), and Geography (Africa, Asia-Pacific, Europe, and More). The Market Forecasts are Provided in Terms of Value (USD) and Volume (Metric Tons).
Geography Analysis
Europe held 40.35% of global revenues in 2025, a position rooted in the European Union Farm to Fork Strategy, which targets 25% organic farmland by 2030. Germany's subsidy program reimburses up to 70% of certification costs in the first conversion year, slashing financial risk for growers. The region's mature organic grocery sector supports stable downstream premiums, enabling compound annual consumption growth even as household spending moderates. COMPO Group's 2024 commissioning of an advanced release technology plant in Munster elevates nutrient-delivery precision, solidifying Europe as a technology trendsetter that shapes forthcoming global quality standards.
North America is the fastest-growing geography, tracking an 11.55% CAGR through 2031, lifted by the USDA Fertilizer Production Expansion Program's funding across seventy-six facilities. California concentrates a critical mass of innovation, including insect-based waste upgrade. Corporate climate declarations, especially among packaged-food giants, shift procurement into organic channels, creating pull for input suppliers. Canada's Prairie provinces now explore co-locating composting units with pulse-processing plants to recycle high-protein fines into field-applied soil amendments, boosting regional circular-economy credentials.
Asia-Pacific ranks as the largest untapped frontier. Government alliances, such as KRIBHCO partnering with Novonesis to market Rhizosuper at INR 500-600 (USD 6.3-7.5) per acre, reveal public-private strategies to bridge affordability and technical knowledge gaps. China's environmental amendments encourage polyhalite imports, providing a complementary mineral source that blends well with organic matrices. Thailand's fully integrated fertilizer park, operational since late 2024, supplies both domestic and export users, signaling the region's shift from importer to competitive exporter over the outlook period.
- Coromandel International Ltd
- Italpollina SPA
- Gujarat State Fertilizers and Chemicals Ltd
- Deepak Fertilisers and Petrochemicals Corp. Ltd
- E.B.Stone and Sons Inc
- Biolchim SPA (J.M. Huber Corporation)
- Sustane Natural Fertilizer Inc.
- Fertikal NV
- Nature Safe (Darling Ingredients Inc.)
- California Organic Fertilizers Inc. (Wilbur-Ellis Agribusiness)
- BioFert Manufacturing Inc. (Excel Industries Ltd)
- Indogulf BioAg LLC
- Midwestern BioAg
- True Organic Products Inc.
- The Espoma Company
Additional Benefits:
- The market estimate (ME) sheet in Excel format
- 3 months of analyst support
TABLE OF CONTENTS
1 INTRODUCTION
- 1.1 Study Assumptions and Market Definition
- 1.2 Scope of the Study
- 1.3 Research Methodology
2 REPORT OFFERS
3 EXECUTIVE SUMMARY AND KEY FINDINGS
4 KEY INDUSTRY TRENDS
- 4.1 Area Under Organic Cultivation
- 4.2 Per Capita Spending on Organic Products
- 4.3 Regulatory Framework
- 4.3.1 Australia
- 4.3.2 Brazil
- 4.3.3 Canada
- 4.3.4 China
- 4.3.5 France
- 4.3.6 Germany
- 4.3.7 India
- 4.3.8 Indonesia
- 4.3.9 Italy
- 4.3.10 Japan
- 4.3.11 Mexico
- 4.3.12 Netherlands
- 4.3.13 Philippines
- 4.3.14 Russia
- 4.3.15 Spain
- 4.3.16 Thailand
- 4.3.17 Turkey
- 4.3.18 United Kingdom
- 4.3.19 United States
- 4.3.20 Vietnam
- 4.4 Value Chain and Distribution Channel Analysis
- 4.5 Market Drivers
- 4.5.1 Government incentives and subsidies
- 4.5.2 Rising consumer demand for organic food
- 4.5.3 Environmental regulations limiting chemical fertilizers
- 4.5.4 Expansion of certified organic farmland
- 4.5.5 Circular-economy waste-to-fertilizer partnerships
- 4.5.6 Sensor-guided compost quality analytics
- 4.6 Market Restraints
- 4.6.1 Higher production cost than synthetic fertilizers
- 4.6.2 Inconsistent nutrient content and quality standards
- 4.6.3 Feedstock competition from bioenergy and feed industries
- 4.6.4 Logistics-emission policies penalizing bulky manure transport
5 MARKET SIZE AND GROWTH FORECASTS (VALUE AND VOLUME)
- 5.1 Form
- 5.1.1 Manure
- 5.1.2 Meal Based Fertilizers
- 5.1.3 Oilcakes
- 5.1.4 Other Organic Fertilizers
- 5.2 Crop Type
- 5.2.1 Cash Crops
- 5.2.2 Horticultural Crops
- 5.2.3 Row Crops
- 5.3 Geography
- 5.3.1 Africa
- 5.3.1.1 By Country
- 5.3.1.1.1 Egypt
- 5.3.1.1.2 Nigeria
- 5.3.1.1.3 South Africa
- 5.3.1.1.4 Rest of Africa
- 5.3.1.1 By Country
- 5.3.2 Asia-Pacific
- 5.3.2.1 By Country
- 5.3.2.1.1 Australia
- 5.3.2.1.2 China
- 5.3.2.1.3 India
- 5.3.2.1.4 Indonesia
- 5.3.2.1.5 Japan
- 5.3.2.1.6 Philippines
- 5.3.2.1.7 Thailand
- 5.3.2.1.8 Vietnam
- 5.3.2.1.9 Rest of Asia-Pacific
- 5.3.2.1 By Country
- 5.3.3 Europe
- 5.3.3.1 By Country
- 5.3.3.1.1 France
- 5.3.3.1.2 Germany
- 5.3.3.1.3 Italy
- 5.3.3.1.4 Netherlands
- 5.3.3.1.5 Russia
- 5.3.3.1.6 Spain
- 5.3.3.1.7 Turkey
- 5.3.3.1.8 United Kingdom
- 5.3.3.1.9 Rest of Europe
- 5.3.3.1 By Country
- 5.3.4 Middle East
- 5.3.4.1 By Country
- 5.3.4.1.1 Iran
- 5.3.4.1.2 Saudi Arabia
- 5.3.4.1.3 Rest of Middle East
- 5.3.4.1 By Country
- 5.3.5 North America
- 5.3.5.1 By Country
- 5.3.5.1.1 Canada
- 5.3.5.1.2 Mexico
- 5.3.5.1.3 United States
- 5.3.5.1.4 Rest of North America
- 5.3.5.1 By Country
- 5.3.6 South America
- 5.3.6.1 By Country
- 5.3.6.1.1 Argentina
- 5.3.6.1.2 Brazil
- 5.3.6.1.3 Rest of South America
- 5.3.6.1 By Country
- 5.3.1 Africa
6 COMPETITIVE LANDSCAPE
- 6.1 Key Strategic Moves
- 6.2 Market Share Analysis
- 6.3 Company Landscape
- 6.4 Company Profiles (Includes Global Level Overview, Market Level Overview, Core Segments, Financials as available, Strategic Information, Market Rank/Share, Products and Services, and Recent Developments)
- 6.4.1 Coromandel International Ltd
- 6.4.2 Italpollina SPA
- 6.4.3 Gujarat State Fertilizers and Chemicals Ltd
- 6.4.4 Deepak Fertilisers and Petrochemicals Corp. Ltd
- 6.4.5 E.B.Stone and Sons Inc
- 6.4.6 Biolchim SPA (J.M. Huber Corporation)
- 6.4.7 Sustane Natural Fertilizer Inc.
- 6.4.8 Fertikal NV
- 6.4.9 Nature Safe (Darling Ingredients Inc.)
- 6.4.10 California Organic Fertilizers Inc. (Wilbur-Ellis Agribusiness)
- 6.4.11 BioFert Manufacturing Inc. (Excel Industries Ltd)
- 6.4.12 Indogulf BioAg LLC
- 6.4.13 Midwestern BioAg
- 6.4.14 True Organic Products Inc.
- 6.4.15 The Espoma Company
7 KEY STRATEGIC QUESTIONS FOR AGRICULTURAL BIOLOGICALS CEOS
 有机肥料市场:2026-2032年全球市场预测(依配方、产品形式、原料、应用、最终用户及销售管道划分)有机农药市场:2026-2032年全球市场预测(依产品类型、作物类型、配方、应用及通路划分)
 2026年全球有机肥料市场报告2026年全球绿肥市场报告
 全球有机肥料市场规模、份额、趋势和成长分析报告(2026-2034年)富磷有机肥市场:依作物类型、形态、应用通路-2026-2032年全球预测
 全球有机肥料市场:市场规模、份额和趋势分析(按产品、形态、应用和地区划分),细分市场预测(2026-2033 年)全球有机农药市场规模、份额、趋势和成长分析报告(2026-2034年)
 全球有机农药市场,2025-2029年
 全球有机肥料市场,2026-2030年