


 |
市场调查报告书
商品编码
1934630
特种石墨:市场占有率分析、产业趋势与统计、成长预测(2026-2031)Special Graphite - Market Share Analysis, Industry Trends & Statistics, Growth Forecasts (2026 - 2031) |
||||||
※ 本网页内容可能与最新版本有所差异。详细情况请与我们联繫。
预计到 2025 年,特种石墨市场价值将达到 10.9 亿美元,从 2026 年的 11.4 亿美元成长到 2031 年的 14.6 亿美元。
预计在预测期(2026-2031 年)内,复合年增长率将达到 4.96%。
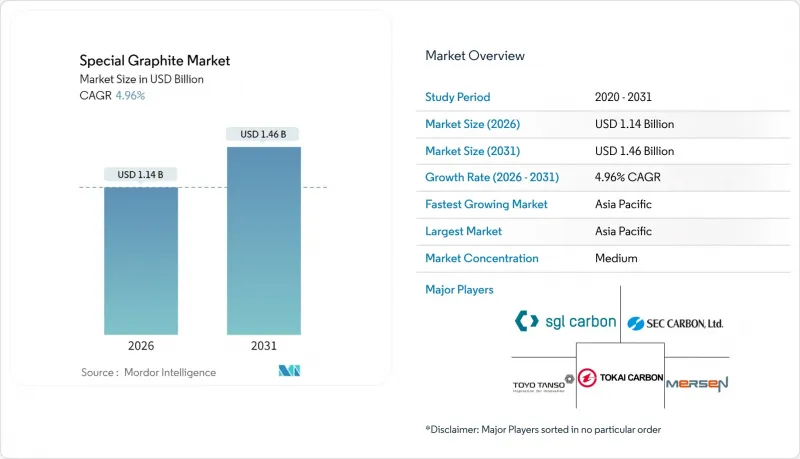
在脱碳政策、太阳能晶片产量增加以及欧美电池负极材料本地化程度不断提高的背景下,对高纯度等向性石墨和模压级石墨的需求正超越传统钢电极的范畴。中国将于2024年推出天然鳞片石墨出口许可证制度,美国将于2026年征收25%的关税,运作倡议正在加速非中国原料的合格,并促使欧美閒置产能暂停状态。铸造厂从金属模具转向石墨模具用于复杂合金铸造、半导体坩埚需求以及太阳能热点地区的消费,都支撑着终端市场的多元化发展。同时,钠离子电池的替代风险限制了其长期销售前景。在这种竞争激烈的环境下,能够保证杂质含量低于10 ppm并提供ISO 9001和ISO 14001认证的供应商更具优势,因为买家越来越重视原产地而非最低成本。整体而言,特种石墨市场集中度适中,但技术差异化程度较高,这为西方和日本的老牌企业捍卫其有利可图的细分市场留下了空间。
全球特种石墨市场趋势与洞察
政府脱碳政策推动了对太阳能晶片的需求
实现净零排放太阳能发电的蓝图正引领吉瓦级规模的扩张,每安装1吉瓦太阳能发电系统就需要消耗180至220吨高纯度石墨坩埚和高温区组件。欧盟的目标是到2030年实现750吉瓦的太阳能发电装置容量,这将每年额外产生超过3万吨石墨的需求。同时,中国的「十四五」计画要求到2030年风能和太阳能发电总装置容量达到1,200吉瓦。印度2024年推出的光学模组生产连结奖励计画(PLI)将进一步扩大区域消费品需求。由于政策支持的采购週期使供应商能够预测未来多年的需求,有助于证明资本投资的合理性,因此这种需求驱动因素受钢铁週期固有波动的影响较小。
美国和欧盟电动车电池本地化将推动对特种石墨的需求。
《通膨控制法案》规定,到2027年将取消对中国产电池材料的补贴,促使非中国石墨计划激增。 Nouveau Monde Graphite公司成功从通用汽车和Panasonic能源公司资金筹措,用于每年从魁北克采购3.6万吨片状石墨。Panasonic还与Novonix公司位于田纳西州的工厂签订了合同,每年采购1万吨合成石墨。欧洲《关键材料法案》(将于2023年生效)要求在2030年实现40%的国内加工,为此,Mersen公司将其在美国的等向性石墨产能扩大至每年1.6万吨。如今,西方电池製造商愿意为可追溯的原料支付20%至30%的溢价,利润也逐渐流向认证供应商。
原料薄片供应集中在中国会增加采购风险
2024年,中国占全球天然石墨开采量的77%,阳极级精炼石墨的产量占比超过90%。 2023年12月实施的出口许可限制暂时抑制了石墨的出货,暴露了供应链的脆弱性。从莫三比克的巴拉马到加拿大的拉克德伊勒,非中国地区的石墨计划面临着资金筹措挑战和长达12-18个月的客户认证週期,这导致西方市场石墨价格上涨15-20%,并加剧了库存积压。
细分市场分析
至2025年,等向性石墨将占特种石墨市场47.90%的份额,年复合成长率(CAGR)为5.44%,主要受半导体坩埚、电火花加工电极和绿色氢气板需求的推动。 Mersen公司正在将其在美国的晶圆厂用石墨产能扩大至1.6万吨,而弗劳恩霍夫研究所的双极板技术创新预计将使需求每年增加3万吨。用于电极和连铸模具的挤压石墨面临产能过剩的问题,此前东海碳素公司计划在2025年7月将其在日本的电极产量削减50%,在欧洲削减30%。成型石墨的需求成长得益于中东地区铝冶炼业的扩张,而柔性箔材产品则满足了电动车温度控管垫片的需求。杂质含量低于10ppm的供应商已获得多年销售合同,从而保障了其收入免受钢铁需求週期性波动的影响。
区域分析
亚太地区预计在2025年将占总营收的45.70%,并在预测期(2026-2031年)内维持6.42%的年均成长率。中国在上游采矿和精炼领域处于领先地位,而日本由于国内电极需求下降,已将重点转向精细碳组分。同时,韩国正透过浦项钢铁未来M公司(POSCO Future M)从莫三比克采购片状碳。印度的光学模组生产关联补贴(PLI)计画正在刺激坩埚需求,并为国内加工商创造机会。
北美占据特种石墨市场的大部分份额。维达利亚公司年产11,300吨球墨铸铁厂和比尔拉碳素公司在南卡罗来纳州投资10亿美元的计划都反映了反通膨立法的益处。计划于2026年对中国石墨征收25%的关税,以及大规模建设超级工厂的浪潮,都在推动着该地区的成长,但12至18个月的认证週期却构成了一大障碍。
欧洲市场份额主要由半导体、汽车和可再生能源设备产业推动。 SGL Carbon半导体销售额成长30%,与中国因成本压力而减少阳极材料研发投入形成鲜明对比。 REACH粉尘法规推高了合规成本,而《关键材料法》则鼓励国内加工。
南美洲和中东及非洲地区为铝提炼提供铝片和阴极铝原料,但基础设施不足限制了近期的发展。
其他福利:
- Excel格式的市场预测(ME)表
- 分析师支持(3个月)
目录
第一章 引言
- 研究假设和市场定义
- 调查范围
第二章调查方法
第三章执行摘要
第四章 市场情势
- 市场概览
- 市场驱动因素
- 政府脱碳政策提振了对太阳能晶片的需求
- 欧盟和美国电动车电池供应链的本地化将推动对特殊石墨的需求。
- 向富硅大尺寸负极材料过渡,需要高纯度石墨
- 复杂合金的铸造正越来越多地用石墨模具取代金属模具。
- 利用等静压石墨快速扩展绿色氢电解槽板
- 市场限制
- 由于原料薄片供应集中在中国,采购风险增加。
- 钛酸锂 (LTO) 和钠离子化学领域的创新减少了石墨的使用量
- 欧盟的 REACH 法规将透过收紧对石墨粉尘排放的限制来增加资本支出 (CAPEX)。
- 价值链分析
- 波特五力模型
- 供应商的议价能力
- 买方的议价能力
- 新进入者的威胁
- 替代品的威胁
- 竞争程度
第五章 市场规模与成长预测
- 依产品类型
- 挤压石墨
- 等向性石墨
- 模压石墨
- 其他类型
- 按最终用户行业划分
- 电子产业
- 太阳能产业
- 铸造和冶金行业
- 其他最终用户
- 按地区
- 亚太地区
- 中国
- 日本
- 韩国
- 印度
- 亚太其他地区
- 北美洲
- 我们
- 加拿大
- 墨西哥
- 欧洲
- 德国
- 英国
- 法国
- 义大利
- 俄罗斯
- 其他欧洲地区
- 南美洲
- 巴西
- 阿根廷
- 其他南美洲
- 中东和非洲
- 沙乌地阿拉伯
- 南非
- 阿拉伯聯合大公国
- 其他中东和非洲地区
- 亚太地区
第六章 竞争情势
- 市场集中度
- 策略趋势
- 市占率(%)/排名分析
- 公司简介
- Entegris, Inc.
- Fangda Carbon New Material Co. Ltd
- GrafTech International
- Graphite India Limited
- MERSEN PROPERTY
- Morgan Advanced Materials Plc
- Nippon Carbon Co. Ltd
- Pingdingshan City Kaiyuan Specialty Graphite Ltd
- Schunk Carbon Technology
- SEC CARBON, Limited
- SGL Carbon
- Tokai Carbon Co., Ltd.
- Toyo Tanso Co., Ltd.
- Yichang Xincheng Graphite Co., Ltd.
第七章 市场机会与未来展望
The Special Graphite Market was valued at USD 1.09 billion in 2025 and estimated to grow from USD 1.14 billion in 2026 to reach USD 1.46 billion by 2031, at a CAGR of 4.96% during the forecast period (2026-2031).
Decarbonization policies, solar-wafer build-outs, and Western battery-anode localization are expanding high-purity isotropic and molded grades beyond traditional steel electrodes. China's 2024 export-license regime for natural flake and the 25% United States tariff set for 2026 are accelerating the qualification of non-Chinese feedstocks and the restarts of dormant Western capacity. Foundry migration from metal to graphite molds in complex-alloy casting, semiconductor crucible demand, and photovoltaic hot-zone consumption underpin resilient end-market diversity, while substitution risks from sodium-ion chemistries temper longer-range volume expectations. Competitive dynamics favor suppliers who can certify sub-10-ppm impurity levels and offer ISO 9001 and ISO 14001 compliance, as buyers increasingly emphasize provenance over the lowest cost. Overall, the special graphite market remains moderately consolidated yet technically differentiated, giving Western and Japanese incumbents scope to defend high-margin niches.
Global Special Graphite Market Trends and Insights
Government Decarbonization Policies Boosting Solar Wafer Demand
Net-zero roadmaps are translating into gigawatt-scale photovoltaic expansions that consume high-purity graphite crucibles and hot-zone parts at 180-220 t per installed gigawatt. The European Union targets 750 GW by 2030, adding more than 30,000 t of graphite annually, while China's 14th Five-Year Plan mandates 1,200 GW of combined wind and solar capacity by the same year. India's 2024 production-linked incentive for solar modules further amplifies localized consumable demand. Policy-locked procurement cycles give suppliers multi-year volume visibility and justify capacity investments, insulating this driver from typical steel-cycle volatility.
EV Battery Localization in United States and European Union Sparking Specialty Graphite Offtake
Inflation Reduction Act rules phasing out Chinese battery materials from subsidies by 2027 have triggered non-Chinese graphite projects. Nouveau Monde Graphite secured USD 50 million from General Motors and Panasonic Energy to supply 36,000 t/yr of flake from Quebec, and Panasonic additionally contracted 10,000 t/yr of synthetic graphite from Novonix's Tennessee plant. Europe's Critical Raw Materials Act, effective 2023, compels 40% domestic processing by 2030, prompting Mersen to raise US isotropic capacity to 16,000 t/yr. Western cell makers now accept 20-30% price premiums for traceable feedstocks, shifting margin to certified suppliers.
Sino-Centric Raw-Flake Supply Concentration Raising Procurement Risk
China mined 77% of global natural graphite and refined over 90% of anode-grade output in 2024. December 2023 export license controls briefly curbed shipments, revealing supply chain fragility. Non-Chinese projects-from Mozambique's Balama to Canada's Lac des Iles-face financing challenges and 12-18-month customer-qualification cycles, which embed a 15-20% risk premium into Western pricing and incentivize inventory stockpiling.
Other drivers and restraints analyzed in the detailed report include:
- Shift to Large-Format Si-Rich Anodes Requiring Higher-Purity Graphite
- Foundry Migration from Metal Molds to Graphite Molds for Complex Alloys
- Breakthroughs in Lithium Titanium Oxide and Sodium-Ion Chemistries Reducing Graphite Intensity
For complete list of drivers and restraints, kindly check the Table Of Contents.
Segment Analysis
Isotropic graphite held 47.90% of the special graphite market share in 2025 and is growing at a 5.44% CAGR, fueled by semiconductor crucibles, EDM electrodes, and green-hydrogen plates. Mersen lifted US capacity to 16,000 t to serve wafer fabs, and Fraunhofer's bipolar-plate breakthrough could add 30,000 t annual demand. Extruded graphite, used in electrodes and continuous-casting molds, faces structural overcapacity after Tokai Carbon's 50% Japanese and 30% European electrode cuts by July 2025. Molded graphite grows alongside Middle East aluminum smelting, while flexible foils address thermal management gaskets in EVs. Suppliers achieving sub-10-ppm impurity win multiyear offtakes, insulating revenue from cyclical steel swings.
The Special Graphite Market Report is Segmented by Product Type (Extruded Graphite, Isotropic Graphite, Molded Graphite, and Other Types), End-User Industry (Electronics, Photovoltaic, Foundry and Metallurgy, and Other End-Users), and Geography (Asia-Pacific, North America, Europe, South America, and Middle East and Africa). The Market Forecasts are Provided in Terms of Value (USD).
Geography Analysis
The Asia-Pacific region dominated 45.70% of 2025 revenue and is expected to grow at a rate of 6.42% during the forecast period (2026-2031). China anchors upstream mining and refining, yet Japan shifts focus to fine-carbon parts after domestic electrode cuts, while South Korea secures Mozambican flake via Posco Future M. India's PLI scheme for solar modules stimulates crucible demand and domestic fabricator opportunities.
North America captures a substantial share of the special graphite market. Vidalia's 11,300 t spherical plant and Birla Carbon's USD 1 billion South Carolina project illustrate Inflation Reduction Act tailwinds. Tariffs rising to 25% on Chinese graphite in 2026 and a wave of gigafactory construction underpin regional growth, though 12-18-month qualification timelines remain a hurdle.
Europe's share, driven by semiconductor, automotive, and renewable installations. SGL Carbon's 30% jump in semiconductor sales contrasts with its exit from anode R&D due to Chinese cost pressure. REACH dust rules raise compliance costs, yet the Critical Raw Materials Act pushes domestic processing.
South America and the Middle East & Africa supply raw flake and aluminum-smelting cathodes but face infrastructure gaps that temper near-term expansion.
- Entegris, Inc.
- Fangda Carbon New Material Co. Ltd
- GrafTech International
- Graphite India Limited
- MERSEN PROPERTY
- Morgan Advanced Materials Plc
- Nippon Carbon Co. Ltd
- Pingdingshan City Kaiyuan Specialty Graphite Ltd
- Schunk Carbon Technology
- SEC CARBON, Limited
- SGL Carbon
- Tokai Carbon Co., Ltd.
- Toyo Tanso Co., Ltd.
- Yichang Xincheng Graphite Co., Ltd.
Additional Benefits:
- The market estimate (ME) sheet in Excel format
- 3 months of analyst support
TABLE OF CONTENTS
1 Introduction
- 1.1 Study Assumptions & Market Definition
- 1.2 Scope of the Study
2 Research Methodology
3 Executive Summary
4 Market Landscape
- 4.1 Market Overview
- 4.2 Market Drivers
- 4.2.1 Government decarbonisation policies boosting solar wafer demand
- 4.2.2 EV-battery supply-chain localisation in United States and European Union sparking specialty graphite offtake
- 4.2.3 Shift to large-format Si-rich anodes that require higher-purity graphite
- 4.2.4 Foundry migration from metal molds to graphite molds for complex alloys
- 4.2.5 Rapid expansion of green-hydrogen electrolyser plates using isostatic graphite
- 4.3 Market Restraints
- 4.3.1 Sino-centric raw-flake supply concentration raises procurement risk
- 4.3.2 Breakthroughs in Lithium Titanium Oxide (LTO ) and sodium-ion chemistries reducing graphite intensity
- 4.3.3 Stricter EU REACH limits on graphite dust emissions increase CAPEX
- 4.4 Value Chain Analysis
- 4.5 Porter's Five Forces
- 4.5.1 Bargaining Power of Suppliers
- 4.5.2 Bargaining Power of Buyers
- 4.5.3 Threat of New Entrants
- 4.5.4 Threat of Substitutes
- 4.5.5 Degree of Competition
5 Market Size & Growth Forecasts (Value)
- 5.1 By Product Type
- 5.1.1 Extruded Graphite
- 5.1.2 Isotropic Graphite
- 5.1.3 Molded Graphite
- 5.1.4 Other Types
- 5.2 By End-user Industry
- 5.2.1 Electronics Industry
- 5.2.2 Photovoltaic Industry
- 5.2.3 Foundry and Metallurgy Industry
- 5.2.4 Other End-Users
- 5.3 By Geography
- 5.3.1 Asia-Pacific
- 5.3.1.1 China
- 5.3.1.2 Japan
- 5.3.1.3 South Korea
- 5.3.1.4 India
- 5.3.1.5 Rest of Asia-Pacific
- 5.3.2 North America
- 5.3.2.1 United States
- 5.3.2.2 Canada
- 5.3.2.3 Mexico
- 5.3.3 Europe
- 5.3.3.1 Germany
- 5.3.3.2 United Kingdom
- 5.3.3.3 France
- 5.3.3.4 Italy
- 5.3.3.5 Russia
- 5.3.3.6 Rest of Europe
- 5.3.4 South America
- 5.3.4.1 Brazil
- 5.3.4.2 Argentina
- 5.3.4.3 Rest of South America
- 5.3.5 Middle East and Africa
- 5.3.5.1 Saudi Arabia
- 5.3.5.2 South Africa
- 5.3.5.3 United Arab Emirates
- 5.3.5.4 Rest of Middle-East and Africa
- 5.3.1 Asia-Pacific
6 Competitive Landscape
- 6.1 Market Concentration
- 6.2 Strategic Moves
- 6.3 Market Share(%)/Ranking Analysis
- 6.4 Company Profiles (includes Global level Overview, Market level overview, Core Segments, Financials as available, Strategic Information, Market Rank/Share, Products & Services, Recent Developments)
- 6.4.1 Entegris, Inc.
- 6.4.2 Fangda Carbon New Material Co. Ltd
- 6.4.3 GrafTech International
- 6.4.4 Graphite India Limited
- 6.4.5 MERSEN PROPERTY
- 6.4.6 Morgan Advanced Materials Plc
- 6.4.7 Nippon Carbon Co. Ltd
- 6.4.8 Pingdingshan City Kaiyuan Specialty Graphite Ltd
- 6.4.9 Schunk Carbon Technology
- 6.4.10 SEC CARBON, Limited
- 6.4.11 SGL Carbon
- 6.4.12 Tokai Carbon Co., Ltd.
- 6.4.13 Toyo Tanso Co., Ltd.
- 6.4.14 Yichang Xincheng Graphite Co., Ltd.
7 Market Opportunities and Future Outlook
- 7.1 White-space and Unmet-need Assessment
 石墨市场:按类型、纯度、形态、应用和最终用途产业划分-2026-2032年全球市场预测绿色石墨市场:2026-2032年全球市场预测(依石墨类型、纯度等级、形态、应用及最终用户产业划分)
 《2026年版全球碳化硅涂层基座市场研究报告》碳化硅涂层石墨载体市场:全球预测(2026-2032 年),按晶圆尺寸、涂层厚度、应用和最终用户划分高纯度石墨市场按应用、类型、形态和纯度等级划分,全球预测(2026-2032年)
 日本石墨市场规模、份额、趋势和预测:按类型、应用、最终用途行业和地区划分,2026-2034年
 2026年全球石墨市场报告2026年全球热解石墨市场报告2026年全球等向性挤压石墨市场报告2026年全球等向性石墨市场报告