


 |
市场调查报告书
商品编码
1934670
美国活性碳:市场占有率分析、产业趋势与统计、成长预测(2026-2031)United States Activated Carbon - Market Share Analysis, Industry Trends & Statistics, Growth Forecasts (2026 - 2031) |
||||||
※ 本网页内容可能与最新版本有所差异。详细情况请与我们联繫。
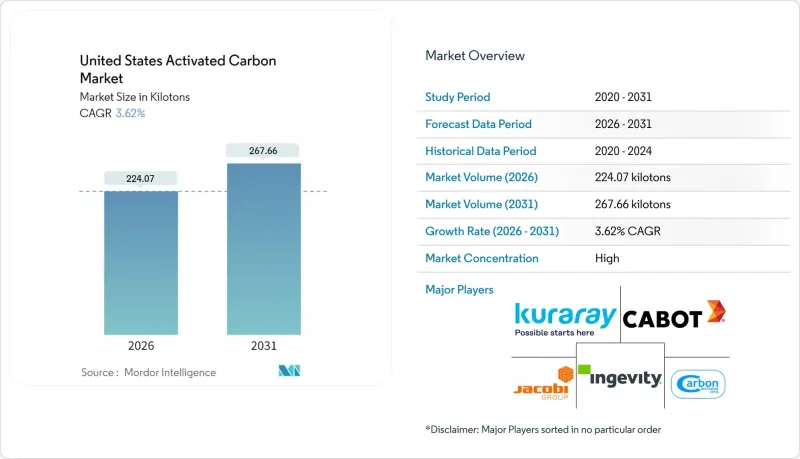
美国活性碳市场预计将从 2025 年的 216.24 千吨增长到 2026 年的 224.07 千吨,预计到 2031 年将达到 267.66 千吨,2026 年至 2031 年的复合年增长率为 3.62%。
这一强劲成长直接归功于联邦水质法规,该法规要求将颗粒活性碳作为 PFAS 合规的标准;政府对长效吸附器的资助;以及对燃煤发电厂汞污染和石化产品中挥发性有机化合物 (VOC) 替代处理方法日益增长的需求。两党基础设施法案下的基础设施津贴,以及与 3M 和杜邦科慕-科迪华达成的单独和解协议,正在为大型处理计划提供资金。同时,汽车蒸发排放气体法规和国内原料药 (API) 生产也推动了该成长要素。这些结构性利好因素受到新型高能耗活化製程、原料价格上涨以及离子交换树脂和奈米过滤滤膜等替代技术的限制,但并未阻止产能扩张或长期供应协议的签署。
美国活性碳市场趋势与分析
美国环保署关于饮用水中 PFAS 的规定
将于2024年4月生效的《国家饮用水标准》将全氟辛酸(PFOA)和全氟辛烷磺酸(PFOS)的浓度限制在4 ppt(十亿分之四)以内,这促使人们迅速采购颗粒活性炭,将其作为最佳可行可用技术(BAT)。监测将于2027年4月开始,全面合规要求将于2029年4月前完成,这意味着尚未配备PFAS处理设备的系统中,77%必须在三年内完成安装。目前,典型的市政水质净化厂每年投入9,000至45,000公斤活性炭,并以9至12个月的突破週期运作。这造成了持续的需求,并增加了活性碳重新运作处理量。卡尔冈炭素公司与美国水务公司签订的为期九年的供应合约(涵盖50多个地点)就是一个典型的例子,说明了确保库存、热重新运作能力和物流资源的迫切需求。由于短链 PFAS 和高有机物含量会缩短 GAC 的运作,因此正在采用粉末活性碳、离子交换和膜处理的混合方法,但这种转变往往会增加而不是降低总处理成本。
排放燃煤发电厂的汞排放
2024 年的《汞和空气毒物评估报告》将褐煤发电厂的汞排放限值从 4 磅/TBtu 收紧至 1.2 磅/TBtu,并在 55 台燃煤机组中实施了溴化粉末活性碳喷射,喷射量为 2-5 磅/百万英亩。 Arq 的精炼煤计划支撑着其既有的吨级规模,其在佛罗里达州、伊利诺伊州、肯塔基州、北卡罗来纳州、德克萨斯州和西维吉尼亚的改造项目也为近期生产提供了支持。这项因素对复合年增长率 (CAGR) 的贡献为 0.6 个百分点,但随着燃煤机组的退役和碳捕集改造维修旧机组,其影响将在 2028 年后逐渐减弱。美国环保署 (EPA) 于 2025 年 3 月进行的评估存在政策风险,可能导致长期 PAC 授权的撤销。
原生蒸气活化的高能耗成本
原生活化製程在 800–1000°C 的温度下运作,每公斤煤基碳产生高达 9.5 公斤二氧化碳排放排放,是热重新运作製程的三倍。由于天然气和电力成本占工厂总成本的 30% 之多,美国公用事业公司在 17 座重新运作炉中回收废弃的活性碳床,目前可回收 66% 的无害碳。卡尔冈碳公司在美国的五座重新运作炉以及 JACOBI 公司 2025 年的价格转嫁策略都反映了能源通膨的连锁反应。微波和真空活化试验预计将节省 50–70% 的成本,但目前仍处于资本密集的试点阶段,到 2028 年,这种影响仍将持续,造成 0.7 个百分点的负面影响。
细分市场分析
到2025年,颗粒活性碳将占出货量的45.78%,凸显了其在市政化粪池中的成熟应用,这些化粪池旨在满足美国环保署(EPA)4 ppt的PFAS限值。像威立雅斯坦顿工厂这样日处理量3000万加仑的设施,需要将168万磅活性碳装入42个货柜,这表明公用事业公司在签订长期服务协议时,会严格控制吨位。粒径在0.6毫米至2.4毫米之间的产品,在压力降和高效再生之间取得了良好的平衡,而五座公共产业窑炉则缩短了重新运作循环的运输距离。儘管美国活性碳市场面临混合产品的竞争,但大多数公共产业仍使用颗粒床来去除除PFAS以外的多种污染物,例如土臭素引起的异味以及农业径流中的有机物。
随着加州空气资源委员会收紧蒸发预防罐标准,要求其具有均匀的大孔以确保碳氢化合物的终身保留,挤出或颗粒状产品预计将以4.18%的复合年增长率成为增长最快的产品。 Ingevity公司70%的特殊活性碳销售额来自汽车业,由于OEM库存调整和亚洲进口增加,其2024年的收入下降了5%。颗粒状活性碳在商业空气净化领域也日益普及,直径4毫米的圆柱形颗粒可以降低鼓风机的能耗。 CarbonXT公司于2025年第一季在肯塔基州运作了一条挤出生产线,年产能达到1万吨,缩短了中西部和东南部客户的前置作业时间。粉状活性碳可以解决季节性的口感和气味控制问题,并满足对用于煤汞控制的溴化PAC喷射剂的需求,从而在美国活性碳市场形成均衡的产品组合,同时又不牺牲颗粒状活性碳的核心市场份额。
美国活性碳市场报告按产品类型(粉末活性碳、颗粒活性碳)、原料应用(气体净化、水处理、金属提取、医疗等)和终端用户产业(水处理、食品饮料、医疗、汽车、工业流程及其他终端用户产业)进行细分。市场预测以公吨为单位。
其他福利:
- Excel格式的市场预测(ME)表
- 3个月的分析师支持
目录
第一章 引言
- 研究假设和市场定义
- 调查范围
第二章调查方法
第三章执行摘要
第四章 市场情势
- 市场概览
- 市场驱动因素
- 美国环保署关于饮用水中 PFAS/PFOA 的规定
- 逐步排放燃煤发电厂的汞排放
- 工业用Airstream拖车VOC排放法规更加严格
- 原料药生产能力快速扩张
- 利用活性碳的电网级超级电容计划
- 市场限制
- 原生蒸气活化的高能耗成本
- 与硅胶、生物炭和先进膜技术的竞争
- 气候变迁导致椰壳原料供应面临风险
- 价值链分析
- 波特五力模型
- 供应商的议价能力
- 消费者议价能力
- 新进入者的威胁
- 替代产品和服务的威胁
- 竞争程度
第五章 市场规模与成长预测
- 依产品类型
- 粉末活性碳
- 颗粒活性碳
- 挤压或造粒活性碳
- 按原料
- 气体净化
- 水处理
- 金属提取
- 製药
- 其他用途
- 按最终用户行业划分
- 水处理
- 食品/饮料
- 卫生保健
- 车
- 工业製程
- 其他终端用户产业
第六章 竞争情势
- 市场集中度
- 策略趋势
- 市占率(%)/排名分析
- 公司简介
- Advanced Emissions Solutions, Inc.
- Albemarle Corporation
- Arq, Inc.
- Boyce Carbon.
- Cabot Corporation
- Carbon Activated Corporation
- CarbUSA
- CPL Activated Carbons
- Donau Chemie AG
- Evoqua Water Technologies LLC
- General Carbon Corporation
- Ingevity
- JACOBI CARBONS GROUP
- Kuraray Co., Ltd.
- Kureha Corporation
- Prominent Systems, Inc.
- Puragen Activated Carbons
- Veolia
第七章 市场机会与未来展望
The United States Activated Carbon Market is expected to grow from 216.24 kilotons in 2025 to 224.07 kilotons in 2026 and is forecast to reach 267.66 kilotons by 2031 at 3.62% CAGR over 2026-2031.
This steady climb links directly to federal water rules that now treat granular activated carbon as the benchmark for PFAS compliance, municipal budgets earmarked for long-life adsorption beds, and growing replacements across coal plant mercury-control and petrochemical VOC streams. Infrastructure grants under the Bipartisan Infrastructure Law and separate 3M and DuPont-Chemours-Corteva settlements are underwriting large-scale treatment projects, while automotive evaporative-emission standards and domestic API manufacturing add second-layer momentum. Against these structural tailwinds, high-energy virgin activation, feedstock inflation, and emerging substitutes such as ion-exchange resins and nanofiltration membranes act as counterweights yet have not stalled capacity expansions or long-term supply contracts.
United States Activated Carbon Market Trends and Insights
EPA Regulations on PFAS in Drinking Water
The April 2024 National Primary Drinking Water Regulation established a 4 ppt limit for PFOA and PFOS, prompting the rapid procurement of granular activated carbon as Best Available Technology. Monitoring starts in April 2027, and full compliance is due by April 2029, forcing 77% of systems still lacking PFAS treatment to install beds within three years. A typical municipal plant now loads between 9,000 kg and 45,000 kg of carbon with 9- to 12-month breakthrough cycles, creating repeat demand and lifting carbon reactivation volumes. Calgon Carbon's nine-year supply pact with American Water covering more than 50 sites showcases the rush to lock in inventory, thermal reactivation slots, and logistics. Short-chain PFAS and high organic matter lessen GAC's run length, prompting hybrid pairs with powdered carbon, ion exchange, or membranes, yet this shift enlarges rather than shrinks total treatment spending.
Phase-Out of Mercury Emissions from Coal-Fired Utilities
The 2024 Mercury and Air Toxics review tightened lignite plant mercury limits from 4.0 lb to 1.2 lb per TBtu, prompting the use of brominated powdered carbon injections at 2-5 lb per million acf across 55 coal units. Arq's refined coal production underscores the tonnage scale already in place, while retrofit projects in Florida, Illinois, Kentucky, North Carolina, Texas, and West Virginia keep short-term volume buoyant. The driver contributes 0.6 percentage points to CAGR yet fades as coal retirements and carbon-capture retrofits displace aging units after 2028. The EPA's March 2025 reconsideration introduces policy risk that could lead to a reversal of long-run PAC orders.
High Energy Cost of Virgin Steam Activation
Virgin activation runs at 800-1,000°C and emits up to 9.5 kg CO2-eq per kg of coal-based carbon, triple that of thermal reactivation. Natural gas and electricity account for as much as 30% of a factory's cost, encouraging utilities to recycle spent beds through 17 U.S. reactivation furnaces, where 66% of non-hazardous carbon now finds a second life. Calgon Carbon's five domestic reactivation kilns and JACOBI's 2025 price pass-throughs illustrate the ripple effects of energy inflation. Microwave and vacuum activation trials promise 50-70% savings but remain capital-intensive pilots, keeping this drag at -0.7 percentage points through 2028.
Other drivers and restraints analyzed in the detailed report include:
- Tightening VOC Limits for Industrial Air Streams
- Rapid Expansion of Pharmaceutical API Capacity
- Competition from Silica Gel, Biochar and Advanced Membranes
For complete list of drivers and restraints, kindly check the Table Of Contents.
Segment Analysis
Granular activated carbon accounted for 45.78% of 2025 shipments, a figure that underscores its entrenched use in municipal beds designed to meet the EPA's 4 ppt PFAS ceiling. A single 30 MGD facility, such as Veolia's Stanton plant, loads 1.68 million pounds across 42 vessels, showcasing the tonnage discipline utilities lock into when entering long-dated service contracts. Granular grades ranging from 0.6 mm to 2.4 mm balance pressure drop with efficient regeneration, and five domestic kilns keep trucking lanes short for reactivation loops. Although the United States activated carbon market faces hybrid contenders, most utilities retain granular beds for multi-contaminant removal beyond PFAS, from geosmin taste episodes to agricultural runoff organics.
Extruded or pelletized forms capture the fastest 4.18% CAGR as the California Air Resources Board boosts evaporative canister standards that require uniform macropores for lifetime hydrocarbon retention. Ingevity credits 70% of its specialty carbon sales to the auto sector, yet saw a 5% dip in 2024 revenue tied to OEM destocking and Asian imports. Pellet demand also grows in commercial air purification, where cylindrical 4 mm pellets reduce the energy required by blowers. Carbonxt placed its Kentucky extrusion line onstream in Q1 2025 at 10,000 tpa, cutting lead times to Midwest and Southeast clients. Powdered activated carbon maintains seasonal swings for taste and odor spikes and brominated PAC injections for coal mercury, giving the United States activated carbon market a balanced product mosaic without undermining granular's core share.
The United States Activated Carbon Market Report is Segmented by Product Type (Powdered Activated Carbon, and Granular Activated Carbon), Raw Material (Gas Purification, Water Purification, Metal Extraction, Medicine, and More), and End-User Industry (Water Treatment, Food and Beverage, Healthcare, Automotive, Industrial Processing, and Other End-User Industries). The Market Forecasts are Provided in Terms of Volume (tons).
List of Companies Covered in this Report:
- Advanced Emissions Solutions, Inc.
- Albemarle Corporation
- Arq, Inc.
- Boyce Carbon.
- Cabot Corporation
- Carbon Activated Corporation
- CarbUSA
- CPL Activated Carbons
- Donau Chemie AG
- Evoqua Water Technologies LLC
- General Carbon Corporation
- Ingevity
- JACOBI CARBONS GROUP
- Kuraray Co., Ltd.
- Kureha Corporation
- Prominent Systems, Inc.
- Puragen Activated Carbons
- Veolia
Additional Benefits:
- The market estimate (ME) sheet in Excel format
- 3 months of analyst support
TABLE OF CONTENTS
1 Introduction
- 1.1 Study Assumptions & Market Definition
- 1.2 Scope of the Study
2 Research Methodology
3 Executive Summary
4 Market Landscape
- 4.1 Market Overview
- 4.2 Market Drivers
- 4.2.1 EPA Regulations on PFAS/PFOA in Drinking Water
- 4.2.2 Phase-Out of Mercury Emissions from Coal-Fired Utilities
- 4.2.3 Tightening VOC Limits for Industrial Air Streams
- 4.2.4 Rapid Expansion of Pharmaceutical API Capacity
- 4.2.5 Grid-Scale Supercapacitor Projects Using Activated Carbon
- 4.3 Market Restraints
- 4.3.1 High Energy Cost of Virgin Steam Activation
- 4.3.2 Competition from Silica Gel, Biochar and Advanced Membranes
- 4.3.3 Climate-Driven Supply Risk for Coconut-Shell Feedstocks
- 4.4 Value Chain Analysis
- 4.5 Porter's Five Forces
- 4.5.1 Bargaining Power of Suppliers
- 4.5.2 Bargaining Power of Consumers
- 4.5.3 Threat of New Entrants
- 4.5.4 Threat of Substitute Products and Services
- 4.5.5 Degree of Competition
5 Market Size & Growth Forecasts (Volume)
- 5.1 By Product Type
- 5.1.1 Powdered Activated Carbon
- 5.1.2 Granular Activated Carbon
- 5.1.3 Extruded or Pelletized Activated Carbon
- 5.2 By Raw Material
- 5.2.1 Gas Purification
- 5.2.2 Water Purification
- 5.2.3 Metal Extraction
- 5.2.4 Medicine
- 5.2.5 Other Applications
- 5.3 By End-User Industry
- 5.3.1 Water Treatment
- 5.3.2 Food and Beverage
- 5.3.3 Healthcare
- 5.3.4 Automotive
- 5.3.5 Industrial Processing
- 5.3.6 Other End-user Industries
6 Competitive Landscape
- 6.1 Market Concentration
- 6.2 Strategic Moves
- 6.3 Market Share (%)/ Ranking Analysis
- 6.4 Company Profiles (includes Global level Overview, Market level overview, Core Segments, Financials as available, Strategic Information, Market Rank/Share for key companies, Products & Services, and Recent Developments)
- 6.4.1 Advanced Emissions Solutions, Inc.
- 6.4.2 Albemarle Corporation
- 6.4.3 Arq, Inc.
- 6.4.4 Boyce Carbon.
- 6.4.5 Cabot Corporation
- 6.4.6 Carbon Activated Corporation
- 6.4.7 CarbUSA
- 6.4.8 CPL Activated Carbons
- 6.4.9 Donau Chemie AG
- 6.4.10 Evoqua Water Technologies LLC
- 6.4.11 General Carbon Corporation
- 6.4.12 Ingevity
- 6.4.13 JACOBI CARBONS GROUP
- 6.4.14 Kuraray Co., Ltd.
- 6.4.15 Kureha Corporation
- 6.4.16 Prominent Systems, Inc.
- 6.4.17 Puragen Activated Carbons
- 6.4.18 Veolia
7 Market Opportunities and Future Outlook
- 7.1 White-space and Unmet-Need Assessment
 活性碳市场:2026-2032年全球市场预测(依产品类型、原料、孔径分布、製造流程、最终用户、分销管道及应用划分)废气吸附净化系统市场:依技术、吸附剂类型、产品类型、运作模式、流量、应用和最终用户划分-2026-2032年全球预测竹粒活性碳市场:依原料、製造流程、粒径、应用及通路-2026-2032年全球预测腐蚀性气体吸附分析仪市场:依技术、终端用户产业及通路划分,全球预测(2026-2032年)颗粒活性碳接触器市场:依应用、阶段、最终用户、操作模式和系统配置划分,全球预测,2026-2032年
 全球活性碳市场(2026-2036)
 挤压活性碳市场规模、份额和成长分析:按类型、功能、物理形态、包装类型、应用、最终用户和地区划分-2026-2033年产业预测
 活性碳基非不织布市场分析及预测(至2035年):类型、产品类型、应用、材料类型、技术、最终用户、功能、形式、安装类型全球活性碳市场规模、份额、趋势和成长分析报告(2026-2034)全球活性碳过滤器市场规模、份额、趋势和成长分析报告(2026-2034年)