


 |
市场调查报告书
商品编码
1934725
农业生物製品:市场占有率分析、产业趋势与统计、成长预测(2026-2031)Agricultural Biologicals - Market Share Analysis, Industry Trends & Statistics, Growth Forecasts (2026 - 2031) |
||||||
※ 本网页内容可能与最新版本有所差异。详细情况请与我们联繫。
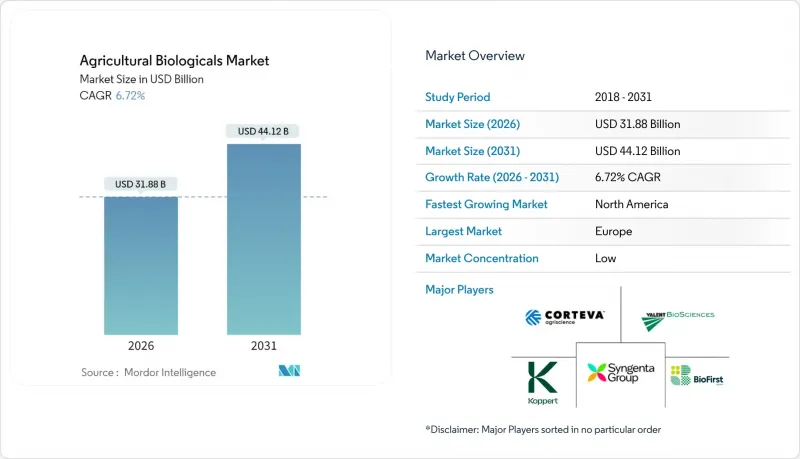
预计农业生物产品市场将从 2025 年的 298.7 亿美元成长到 2026 年的 318.8 亿美元,到 2031 年将达到 441.2 亿美元,2026 年至 2031 年的复合年增长率为 6.72%。
对合成残留物的监管力度加大、农民对土壤健康解决方案的需求不断增长,以及人工智慧加速菌株发现,这些因素共同推动了市场成长。随着大型食品零售商收紧残留物标准,目标客户群正从认证有机农场扩展到更广泛的范围。微生物研发週期正在加快,商业候选产品如今只需数月而非数年即可上市,这缩短了产品上市时间,也加剧了市场竞争。企业对本地生产和农场发酵的投资降低了物流成本,并扩大了产品覆盖范围。
全球农业生技药品市场趋势与洞察
对有机和无农药农产品的需求不断增长
预计到2024年,美国有机食品销售额将成长4.6%,达到672亿美元,反映出消费者对农药残留的日益关注。认证农产品的高价促使传统农户采用生物投入品,以满足零售商严格的检测标准。在亚洲这个新兴的中等收入地区,也出现了类似的趋势,食品安全是当地家庭最关心的问题之一。随着超级市场收紧农药残留标准,许多供应合约中的生物解决方案正从可选变为强制。这种拉动效应正在推动生物肥料、生物刺激剂和生物农药等产品持续成长的需求。
加强全球对合成农药的监管
自2020年以来,欧盟在其「从农场到餐桌」战略下禁用了70多种活性成分,而美国环保署(EPA)则允许合格的微生物农药快速註册。更严格的基准值缩短了许多合成产品的商业寿命。随着农民可选择的化学农药种类减少,生物替代品正变得越来越重要,其审批流程仅需约18个月——仅为传统活性成分所需时间的一半。政策制定者致力于降低风险,这增强了生物农药的长期需求基础。
许多药品保质期短,且依赖低温运输运输。
许多活性菌製剂需要在2°C至8°C的温度下储存,这在冷藏车运输受限的地区可能会使分销成本增加高达40%。在最终分销过程中暴露于高温会显着降低活菌数量,从而影响其在田间的功效并降低农民的信心。东南亚和撒哈拉以南非洲等热带市场面临最高的劣化率,除非常温保存的製剂供应日益充足,否则将限制销售量成长。
细分市场分析
2025年,作物营养领域在农业生物製品市场中占据主导地位,市占率高达63.55%,主要得益于种植者对土壤微生物群落韧性和养分利用效率的重视。该领域的领先地位主要源于合成肥料需求减少带来的显着成本节约以及碳信用收益的增加。其中,固氮生物肥料每英亩可提供高达50磅的氮当量,直接降低投入成本。此外,生物刺激剂还能增强作物对非生物胁迫的耐受性,这在气候变迁日益严峻的背景下显得特别重要。
作物营养领域持续保持强劲成长,以6.78%的复合年增长率 (CAGR) 超过其他所有功能领域。此外,作物营养领域的成熟将确保其继续保持销售领先地位。然而,随着製造商追求跨功能价值提案,他们正日益将产品组合多元化,推出兼具营养和保护功能的复合产品。
除了数量指标之外,创新能力将成为企业间差异化的关键因素。人工智慧驱动的菌株筛选将成为下一代接种剂的基础,提供精准的代谢物谱,从而降低试验成本并提高田间均匀性。营养配方中越来越多地融入载体化学物质,以保护微生物免受紫外线和干燥的影响,从而无需冷藏即可实现长达18个月的保质期。
农业生物製品市场报告按功能(作物营养:有机肥料、生物肥料、生物刺激剂)、作物保护(生物农药、生物防治剂)、作物类型(农田作物、园艺作物、经济作物)和地区(北美、南美、欧洲、其他)进行细分。市场预测以价值(美元)和数量(公吨)为单位。
区域分析
到2025年,欧洲将占据全球农业生物产品市场34.05%的份额,这主要得益于欧盟的化学品禁令以及为有机农业转型提供的财政支持措施。成员国透过「生态计画」(Eco Scheme)补贴,报销高达25%的生物投入成本,从而缩短了种植者的投资回收期。鑑于其庞大的规模,高价值水果产业的扩张速度较为缓慢,渗透率已接近100%,欧洲供应商正转向透过技术合作,出口监管方面的专业知识和配方。
北美地区到2031年将达到8.55%的复合年增长率,成为成长最快的地区。生物技术协调架构简化了微生物核准,中位审批时间为18个月,并加快了产品平臺。科迪华和BASF在国内发酵工厂的7亿美元以上投资,反映了其长期发展承诺。与加拿大的跨境监管协调进一步拓展了邻近的潜在市场,而墨西哥以出口为导向的水果产业正在采用生物农药,以满足欧洲的残留标准。
亚太地区已成为新兴的成长区域,主要得益于印度加速核准15种生物农药于2024年上市,以及中国提供高达30%农产品采购补贴的计画。对分散式生产基地的投资缓解了低温运输挑战,使得热带地区的小规模农户也能采用生物农药。消费者对过度使用化学物质和土壤污染日益增长的抵制也推动了区域市场的成长。在南美洲,巴西的大豆生产优势持续推动强劲的销售成长。当地的发酵能力和巴西IN 36加速核准程序降低了审批成本,促进了专注于塞拉多土壤的国内和跨国公司产品推出。阿根廷和智利正在加速采用生物农药,以应对欧洲进口国日益严格的残留物标准,从而保持出口竞争力。
其他福利:
- Excel格式的市场预测(ME)表
- 3个月的分析师支持
目录
第一章 引言
- 研究假设和市场定义
- 调查范围
- 调查方法
第二章执行摘要和主要发现
第三章 报告
第四章:主要产业趋势
- 有机耕作面积
- 人均有机产品支出
- 法律规范
- 阿根廷
- 澳洲
- 巴西
- 加拿大
- 中国
- 埃及
- 法国
- 德国
- 印度
- 印尼
- 义大利
- 日本
- 墨西哥
- 荷兰
- 奈及利亚
- 菲律宾
- 俄罗斯
- 南非
- 西班牙
- 泰国
- 土耳其
- 英国
- 我们
- 越南
- 价值炼和通路分析
- 市场驱动因素
- 有机种植和无农药农产品的需求不断增长
- 加强全球对合成农药的监管
- 将生物农药纳入企业综合虫害管理(IPM)计划
- 透过再生农业实践获得的排碳权收益
- 人工智慧驱动的微生物菌株发现加速研发週期
- 农场发酵与本地生物投入生产模式
- 市场限制
- 许多药品保质期短,且依赖低温运输运输。
- 复杂且不连贯的註册流程
- 仿冒品和劣质生物农药的普遍存在
- 海藻等关键原料供应不稳定
第五章 市场规模和成长预测(价值和数量)
- 按功能
- 作物营养
- 有机肥料
- 生物肥料
- 生物刺激剂
- 作物保护
- 生物农药
- 生物防治剂
- 作物营养
- 按作物类型
- 田间作物
- 园艺作物
- 经济作物
- 按地区
- 北美洲
- 我们
- 加拿大
- 墨西哥
- 北美其他地区
- 南美洲
- 巴西
- 阿根廷
- 其他南美洲
- 欧洲
- 德国
- 英国
- 法国
- 西班牙
- 义大利
- 荷兰
- 俄罗斯
- 土耳其
- 其他欧洲地区
- 亚太地区
- 中国
- 印度
- 日本
- 澳洲
- 越南
- 泰国
- 印尼
- 菲律宾
- 亚太其他地区
- 中东
- 伊朗
- 沙乌地阿拉伯
- 其他中东地区
- 非洲
- 南非
- 奈及利亚
- 埃及
- 其他非洲地区
- 北美洲
第六章 竞争情势
- 市场集中度
- 策略趋势
- 市占率分析
- 公司简介
- Corteva Agriscience
- BASF SE
- Bayer AG
- Syngenta AG
- UPL Limited
- Novonesis A/S
- Koppert Biological Systems BV
- Biofirst Group NV
- Valent BioSciences LLC
- FMC Corporation
- Rovensa SA
- Certis USA LLC
- ProFarm Group Inc.
- Andermatt Biocontrol AG
- Yara International ASA
第七章:CEO们需要思考的关键策略问题
The agricultural biologicals market is expected to grow from USD 29.87 billion in 2025 to USD 31.88 billion in 2026 and is forecast to reach USD 44.12 billion by 2031 at 6.72% CAGR over 2026-2031.
Escalating regulatory scrutiny of synthetic residues, farmer demand for soil health solutions, and the acceleration of artificial intelligence-enabled strain discovery collectively propel growth. Large food retailers are tightening residue standards, widening the addressable base beyond certified-organic farms. Rapid microbial research and development (R&D) cycles now deliver commercial candidates in months instead of years, compressing time-to-market and intensifying competitive churn. Corporate capital commitments to local manufacturing and on-farm fermentation lower logistics costs and widen geographic reach.
Global Agricultural Biologicals Market Trends and Insights
Rising Demand for Organic, Residue-Free Produce
Organic food sales in the United States rose 4.6% to USD 67.2 billion in 2024, reflecting shoppers' heightened vigilance over pesticide residues. Premium pricing for certified produce incentivizes conventional growers to adopt biological inputs that help them clear stringent retailer tests. Similar patterns unfold in expanding middle-income segments of Asia, where food safety ranks high among household concerns. As supermarkets tighten private residue standards, biological solutions move from optional to compulsory within many supply contracts. The pull effect boosts recurring demand across biofertilizer, biostimulant, and biopesticide categories.
Stringent Global Curbs on Synthetic Agro-Chemicals
The European Union has banned more than 70 active ingredients since 2020 under its Farm to Fork Strategy, whereas the United States Environmental Protection Agency allows fast-track registration for eligible microbial pesticides. Tighter maximum residue limits shorten the commercial life of many synthetic products. Farmers now face fewer chemical options, raising the strategic value of biological substitutes that clear regulatory hurdles in roughly 18 months, half the timeline of conventional actives. Policymakers' alignment on risk-reduction amplifies the long-run demand floor for biologicals.
Short Shelf Life and Cold-Chain Dependence Of Many Formulations
Many live-culture formulations require storage between 2 °C and 8 °C, which can increase distribution costs by up to 40% where refrigerated trucking is limited. Heat exposure during last-mile delivery can significantly reduce viable colony counts and compromise field performance, eroding farmer confidence. Tropical markets in Southeast Asia and sub-Saharan Africa experience the highest spoilage rates, which constrain volume growth unless shelf-stable formulations scale rapidly.
Other drivers and restraints analyzed in the detailed report include:
- Integration of Biologicals into Corporate IPM Programs
- Carbon-Credit Revenue from Regenerative Farming Practices
- Complex, Non-Harmonized Registration Pathways
For complete list of drivers and restraints, kindly check the Table Of Contents.
Segment Analysis
Crop nutrition maintained a commanding 63.55% share of the agricultural biologicals market in 2025 as growers prioritized soil microbiome resilience and nutrient-use efficiency. The segment's leadership reflects tangible cost savings from reduced synthetic fertilizer demand and improved carbon-credit earnings. Within this category, biofertilizers that fix nitrogen deliver up to 50 pounds per acre equivalence, directly lowering input purchases. Biostimulants extend benefits by enhancing abiotic stress tolerance, a valued trait amid widening climate variability.
Crop nutrition is growing at a robust pace, outpacing all other functions with a 6.78% CAGR. In addition, the maturity of crop nutrition ensures continued volume dominance. However, portfolio diversification into combined nutrition-protection products is rising as manufacturers pursue cross-functional value propositions.
Beyond volume metrics, innovation intensity differentiates players. AI-guided strain selection now underpins next-generation inoculants that deliver precise metabolite profiles, cutting trial-and-error costs while elevating field consistency. Nutrient formulations are increasingly integrating carrier chemistries that shield microbes from UV radiation and desiccation, extending shelf life to 18 months without refrigeration.
The Agricultural Biologicals Market Report is Segmented by Function (Crop Nutrition Into Organic Fertilizers, Biofertilizers, and Biostimulants); (Crop Protection Into Biopesticides and Biocontrol Agents), by Crop Type (Row Crops, Horticultural Crops, Cash Crops), and Geography (North America, South America, Europe, and More). The Market Forecasts are Provided in Terms of Value (USD) and Volume (Metric Tons).
Geography Analysis
Europe held a 34.05% share of the agricultural biologicals market in 2025, underpinned by the European Union's combination of chemical bans and financial stimuli for organic transitions. Member states reimburse up to 25% of biological input costs within eco-scheme payments, shortening grower payback horizons. Despite its scale, expansion moderates as penetration nears 100% in high-value fruit sectors, prompting European suppliers to pivot outward and export regulatory expertise and formulations through technology partnerships.
North America registered the fastest 8.55% CAGR by 2031. The Coordinated Framework for Biotechnology simplifies microbial approvals to an 18-month median, catalyzing product pipeline throughput. Capital spending on domestic fermentation plants by Corteva and BASF exceeds USD 700 million, signaling a long-term commitment. Cross-border regulatory alignment with Canada further enlarges the contiguous addressable market, while Mexico's export-oriented fruit sector adopts biologicals to meet European residue limits.
The Asia-Pacific region stands as the emerging frontier, driven by India's expedited clearance of 15 biological pesticides in 2024 and China's subsidy program, which rebates up to 30% of farmers' purchases. Investment in decentralized production hubs mitigates cold-chain gaps, making biologicals viable in tropical smallholder systems. Regional market growth also benefits from mounting consumer backlash against chemical overuse and soil contamination. South America sustains robust volume growth anchored in Brazil's soybean dominance. Local fermentation capacity and Brazil's IN 36 fast-track process reduce approval costs, catalyzing a surge in domestic and multinational launches tailored to Cerrado soils. Argentina and Chile accelerate adoption to preserve export competitiveness as European importers enforce tougher residue ceilings.
- Corteva Agriscience
- BASF SE
- Bayer AG
- Syngenta AG
- UPL Limited
- Novonesis A/S
- Koppert Biological Systems B.V.
- Biofirst Group NV
- Valent BioSciences LLC
- FMC Corporation
- Rovensa S.A.
- Certis USA LLC
- ProFarm Group Inc.
- Andermatt Biocontrol AG
- Yara International ASA
Additional Benefits:
- The market estimate (ME) sheet in Excel format
- 3 months of analyst support
TABLE OF CONTENTS
1 Introduction
- 1.1 Study Assumptions and Market Definition
- 1.2 Scope of the Study
- 1.3 Research Methodology
2 Executive Summary and Key Findings
3 Report Offers
4 Key Industry Trends
- 4.1 Area Under Organic Cultivation
- 4.2 Per Capita Spending On Organic Products
- 4.3 Regulatory Framework
- 4.3.1 Argentina
- 4.3.2 Australia
- 4.3.3 Brazil
- 4.3.4 Canada
- 4.3.5 China
- 4.3.6 Egypt
- 4.3.7 France
- 4.3.8 Germany
- 4.3.9 India
- 4.3.10 Indonesia
- 4.3.11 Italy
- 4.3.12 Japan
- 4.3.13 Mexico
- 4.3.14 Netherlands
- 4.3.15 Nigeria
- 4.3.16 Philippines
- 4.3.17 Russia
- 4.3.18 South Africa
- 4.3.19 Spain
- 4.3.20 Thailand
- 4.3.21 Turkey
- 4.3.22 United Kingdom
- 4.3.23 United States
- 4.3.24 Vietnam
- 4.4 Value Chain & Distribution Channel Annalysis
- 4.5 Market Drivers
- 4.5.1 Rising demand for organic, residue-free produce
- 4.5.2 Stringent global curbs on synthetic agro-chemicals
- 4.5.3 Integration of biologicals into corporate IPM programs
- 4.5.4 Carbon-credit revenue from regenerative farming practices
- 4.5.5 AI-enabled microbial-strain discovery accelerates R&D cycles
- 4.5.6 On-farm fermentation and local bio-input manufacturing models
- 4.6 Market Restraints
- 4.6.1 Short shelf-life and cold-chain dependence of many formulations
- 4.6.2 Complex, non-harmonized registration pathways
- 4.6.3 Proliferation of counterfeit and sub-standard biologicals
- 4.6.4 Volatile supply of critical feedstocks such as seaweed
5 Market Size and Growth Forecasts (Value and Volume)
- 5.1 By Function
- 5.1.1 Crop Nutrition
- 5.1.1.1 Organic Fertilizers
- 5.1.1.2 Biofertilizers
- 5.1.1.3 Biostimulants
- 5.1.2 Crop Protection
- 5.1.2.1 Biopesticides
- 5.1.2.2 Biocontrol Agents
- 5.1.1 Crop Nutrition
- 5.2 By Crop Type
- 5.2.1 Row Crops
- 5.2.2 Horticultural Crops
- 5.2.3 Cash Crops
- 5.3 By Geography
- 5.3.1 North America
- 5.3.1.1 United States
- 5.3.1.2 Canada
- 5.3.1.3 Mexico
- 5.3.1.4 Rest of North America
- 5.3.2 South America
- 5.3.2.1 Brazil
- 5.3.2.2 Argentina
- 5.3.2.3 Rest of South America
- 5.3.3 Europe
- 5.3.3.1 Germany
- 5.3.3.2 United Kingdom
- 5.3.3.3 France
- 5.3.3.4 Spain
- 5.3.3.5 Italy
- 5.3.3.6 Netherlands
- 5.3.3.7 Russia
- 5.3.3.8 Turkey
- 5.3.3.9 Rest of Europe
- 5.3.4 Asia-Pacific
- 5.3.4.1 China
- 5.3.4.2 India
- 5.3.4.3 Japan
- 5.3.4.4 Australia
- 5.3.4.5 Vietnam
- 5.3.4.6 Thailand
- 5.3.4.7 Indonesia
- 5.3.4.8 Philippines
- 5.3.4.9 Rest of Asia-Pacific
- 5.3.5 Middle East
- 5.3.5.1 Iran
- 5.3.5.2 Saudi Arabia
- 5.3.5.3 Rest of Middle East
- 5.3.6 Africa
- 5.3.6.1 South Africa
- 5.3.6.2 Nigeria
- 5.3.6.3 Egypt
- 5.3.6.4 Rest of Africa
- 5.3.1 North America
6 Competitive Landscape
- 6.1 Market Concentration
- 6.2 Strategic Moves
- 6.3 Market Share Analysis
- 6.4 Company Profiles (includes Global Overview, Market Overview, Core Segments, Financials, Strategic Information, Market Rank/Share, Products & Services, and Recent Developments)
- 6.4.1 Corteva Agriscience
- 6.4.2 BASF SE
- 6.4.3 Bayer AG
- 6.4.4 Syngenta AG
- 6.4.5 UPL Limited
- 6.4.6 Novonesis A/S
- 6.4.7 Koppert Biological Systems B.V.
- 6.4.8 Biofirst Group NV
- 6.4.9 Valent BioSciences LLC
- 6.4.10 FMC Corporation
- 6.4.11 Rovensa S.A.
- 6.4.12 Certis USA LLC
- 6.4.13 ProFarm Group Inc.
- 6.4.14 Andermatt Biocontrol AG
- 6.4.15 Yara International ASA
7 Key Strategic Questions for Agricultural Biological CEOs
 农业生技药品市场:2026-2032年全球市场预测(按产品类型、应用方法、製剂形式来源、配方、作物、功能、最终用户和分销管道划分)
 动物微生物组市场规模、份额和增长分析:按动物种类、产品类型、原材料、形态、应用、最终用户、通路和地区划分——2026-2033年行业预测
 农业生技药品市场规模、份额、成长及全球产业分析:按类型、应用和地区划分,并预测至2026-2034年全球农业生技药品市场规模、份额、趋势和成长分析报告(2026-2034年)
 2026年全球农业生技药品市场报告生物合理作物保护市场依产品类型、作物类型、配方、作用机制、成分及应用方法划分-2026-2032年全球预测
 农业生技药品市场规模、份额和趋势分析报告:按作物类型、产品类型、应用方法、地区和细分市场预测(2026-2033 年)
 日本农业生物製品市场报告(按类型、来源、应用方式、应用领域和地区划分,2026-2034年)
 农业生技药品市场规模、份额和成长分析(按类型、来源、应用、作物类型和地区划分)-2026-2033年产业预测
 农业生技药品市场规模、份额和成长分析(按类型、来源、应用、作物类型和地区划分)-2026-2033年产业预测