


 |
市场调查报告书
商品编码
1934763
铜:市场份额分析、行业趋势和统计数据、成长预测(2026-2031 年)Copper - Market Share Analysis, Industry Trends & Statistics, Growth Forecasts (2026 - 2031) |
||||||
※ 本网页内容可能与最新版本有所差异。详细情况请与我们联繫。
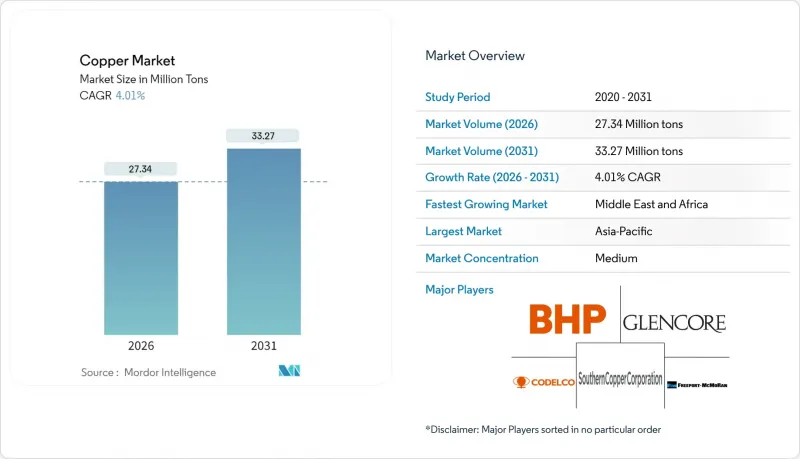
预计到 2026 年,铜市场规模将达到 2,734 万吨,高于 2025 年的 2,629 万吨。
预计到 2031 年产量将达到 3,327 万吨,2026 年至 2031 年的复合年增长率为 4.01%。
此次扩张受结构性电气化趋势、可再生能源计划铜用量成长五倍以及电网现代化专案等因素共同推动,这些因素进一步加剧了本已紧张的供应体系。电动车、资料中心建设和智慧城市发展带来的日益增长的需求,促使矿业公司加快现有矿场的扩张,即便矿石品位正在下降。回收的能源效率高、碳足迹低,使得二次供应成为公用事业公司、汽车製造商和电子产品製造商寻求稳定采购方案时极具吸引力的经济和信誉保障之选。此外,铜市场也面临投机交易和关税不确定性带来的价格波动,促使製造商在避险成本高时签订长期合约或转向废铜原料。
全球铜市场趋势与洞察
可再生能源和电网电气化带来的需求成长
1兆瓦的风能或太阳能发电装置容量所需的铜量约为传统发电的五倍,这使得可再生能源的扩张成为铜市场最强劲的结构性需求驱动因素。一台3兆瓦的陆域风力发电机消耗4.7短吨(约4.3吨)铜,而一块1兆瓦的太阳能板消耗5.5短吨(约5.1吨)铜。电网升级进一步放大了这一影响,因为每条高压直流(HVDC)线路都需要数千吨铜,而且各大洲都在同步实施电网强化项目。中国的国家电网投资计画和欧洲的跨境离岸风力发电骨干网就是很好的例子,它们透过多年采购週期为铜市场带来可预测的供应。
电动汽车中铜的使用量正在快速成长。
一辆普通电池式电动车(BEV) 平均消耗 183 磅铜,而内燃机 (ICE) 车型仅消耗 51 磅铜,这意味着电动交通工具对铜市场的需求量是传统燃油车的 3.6 倍。这种车辆层面的需求与充电基础设施的需求相辅相成,单一直流快速充电器就需要消耗高达 17 磅铜。原始设备製造商 (OEM) 正在洽谈多年期承购协议,以确保在矿山开发週期结束后,生产扩张之前,铜供应能够得到保障。
严格的环境法规和审批流程的延误
在经济合作暨发展组织成员国,完整的矿场开发週期可能需要 20 多年,期间会设定许多建设前里程碑,包括环境影响评估、水资源管理计画、区域咨询通讯协定等。合规成本可能会使计划预算增加 5,000 万美元以上,并阻碍新的开发计划,导致生产商优先考虑扩大现有矿场或收购已获许可的矿床。
细分市场分析
到2025年,矿产铜供应量将占全球总量的84.15%,而再生原料的复合年增长率(CAGR)为5.42%,超过了原生铜的生产速度。随着电子垃圾的品位远高于矿石品位,城市采矿的经济效益日益提升,铜回收市场的成长速度也超过了矿产供应量。再生铜生产可实现高达90%的节能,符合企业净零排放目标以及环境、社会和管治(ESG)相关的融资奖励。
扩大回收规模面临许多挑战,因为铝和钢的污染会推高检验成本。半成品加工商每月在品质检验上花费 28,000 美元,但每年仍拒绝约 25 批货物。儘管有这些营运挑战,预计 2024 年废铜供应量将成长 4.2%,是矿场产量成长的两倍,这标誌着铜市场正持续向循环经济原料供应模式转变。
铜市场报告按来源(采矿和回收)、终端用户行业(建筑、基础设施、工业、交通运输、消费品和电子产品等)以及地区(亚太地区、北美地区、欧洲地区、南美地区以及中东和非洲地区)进行细分。市场预测以吨为单位。
区域分析
到2025年,亚太地区将占全球消费量的70.30%,这主要得益于中国一体化的冶炼加工生态系统和印度电网建设的加速发展。中国拥有全球44%的提炼产能,赋予了该地区定价权,并使其能够在期货曲线倒挂时囤积阴极材料。
北美和欧洲是成熟市场,目前处于更新阶段。自2000年以来,美国已关闭四家提炼,并于2023年出口了34.1万吨精矿用于海外加工。但《通膨控制法案》已确保了冶炼产能回流的资金。欧洲的离岸风力发电计画需要采购高压直流电缆以支援高品质阴极钢的进口,而严格的回收规定有利于二次冶炼厂,从而帮助下游製造商减少范围3排放。
中东和非洲地区预计将成为成长最快的市场,年复合成长率将达到5.21%,这主要得益于主权财富基金向尚比亚、刚果民主共和国和纳米比亚的计划投入巨资。海湾国家也增加对国内下游产能的投入,以对冲石油收入波动带来的风险,并透过将非洲原料与当地的钢筋和钢管厂连接起来,在铜市场打造新的南南供应链。
其他福利:
- Excel格式的市场预测(ME)表
- 3个月的分析师支持
目录
第一章 引言
- 研究假设和市场定义
- 调查范围
第二章调查方法
第三章执行摘要
第四章 市场情势
- 市场概览
- 市场驱动因素
- 可再生能源和电网电气化需求不断增长
- 电动车中铜的使用量迅速成长
- 新兴市场城市基础设施的扩建
- 用于离岸风电的高压直流(HVDC)海底电缆
- 抗菌铜在医疗领域的应用
- 市场限制
- 严格的环境法规和审批流程的延误
- 铜价波动源自投机交易
- 来自轻质替代导体的竞争
- 价值链分析
- 波特五力分析
- 新进入者的威胁
- 买方的议价能力
- 供应商的议价能力
- 替代品的威胁
- 竞争程度
第五章 市场规模与成长预测
- 按来源
- 矿业
- 回收利用
- 按最终用途行业划分
- 建筑施工
- 基础设施
- 产业
- 运输
- 消费品和电子产品
- 其他的
- 按地区
- 亚太地区
- 中国
- 日本
- 印度
- 韩国
- 亚太其他地区
- 北美洲
- 我们
- 加拿大
- 墨西哥
- 欧洲
- 德国
- 英国
- 法国
- 义大利
- 其他欧洲地区
- 南美洲
- 巴西
- 阿根廷
- 其他南美洲
- 中东和非洲
- 沙乌地阿拉伯
- 南非
- 其他中东和非洲地区
- 亚太地区
第六章 竞争情势
- 市场集中度
- 策略趋势
- 市占率(%)/排名分析
- 公司简介
- Antofagasta plc
- Aurubis AG
- BHP
- Codelco
- First Quantum Minerals
- Freeport-McMoRan
- Glencore
- Grupo Mexico(Southern Copper Corporation)
- Hindustan Copper Limited
- Jiangxi Copper Corporation
- Kaz Minerals
- KGHM
第七章 市场机会与未来展望
Copper Market size in 2026 is estimated at 27.34 million tons, growing from 2025 value of 26.29 million tons with 2031 projections showing 33.27 million tons, growing at 4.01% CAGR over 2026-2031.
This expansion is shaped by structural electrification trends, the fivefold copper intensity of renewable-energy projects, and grid-modernization programs that collectively strain an already tight supply pipeline. Heightened demand from electric vehicles, data-center construction, and smart-city rollouts is pushing miners to accelerate brownfield expansions even as ore grades fall. Recycling's energy-efficiency advantages and lower carbon footprint make secondary supply economically and reputationally attractive to utilities, automakers, and electronics manufacturers seeking resilient procurement options. The copper market also navigates price swings triggered by speculative trading and tariff uncertainty, prompting manufacturers to lock in long-term contracts or diversify toward scrap feedstock when hedging options appear costly.
Global Copper Market Trends and Insights
Expanding Demand from Renewable Energy and Grid Electrification
A single megawatt of wind or solar capacity demands roughly five times the copper used in conventional generation, turning renewable build-outs into the strongest structural pull on the copper market. A 3 MW onshore turbine requires 4.7 short tons of copper, while a 1 MW solar array consumes 5.5 short tons. Transmission upgrades magnify the effect because High Voltage Direct Current (HVDC) links draw thousands of tons each, and grid-strengthening programs run in parallel on every continent. China's State Grid investment plan and Europe's cross-border offshore-wind backbones exemplify multi-year procurement cycles that add predictable volume to the copper market.
Rapid Growth in EV Copper Intensity
Battery-electric cars average 183 lb of copper versus 51 lb in internal-combustion models, making electrified transport a 3.6X intensity lever on the copper market. This vehicle-level demand compounds with charging infrastructure, where a single direct-current fast charger incorporates up to 17 lb of the metal. Automotive original equipment manufacturers (OEMs) are negotiating multi-year offtake contracts to secure supply ahead of production ramps surpassing mine-development timelines.
Stringent Environmental Regulations and Permitting Delays
Full-cycle mine development stretches past two decades in the Organisation for Economic Co-operation and Development (OECD) jurisdictions because environmental impact assessments, water-management plans, and community-consultation protocols impose extensive pre-construction milestones. Compliance outlays can add USD 50 million or more to project budgets and discourage greenfield proposals, motivating producers to favor brownfield expansions or acquire permitted deposits.
Other drivers and restraints analyzed in the detailed report include:
- Urban Infrastructure Expansion in Emerging Markets
- HVDC Submarine Cables for Offshore Wind
- Copper Price Volatility Driven by Speculative Trading
For complete list of drivers and restraints, kindly check the Table Of Contents.
Segment Analysis
Mining supplied 84.15% of global volume in 2025, but secondary feedstock is expanding at a 5.42% CAGR that outstrips primary output growth. The Copper market size for recycled material is rising faster than mined supply as the economics of urban mining improve once scrap grades in obsolete electronics exceed ore grades by an order of magnitude. Secondary copper production requires up to 90% less energy, aligning with corporate net-zero mandates and Environmental, Social, and Governance (ESG)-linked financing incentives.
Scaling recycling is not trivial because contamination from aluminum and iron inflates testing costs-semi-finished fabricators spend USD 28,000 per month on quality checks and still reject roughly 25 shipments annually. Despite these operational challenges, scrap supply grew 4.2% in 2024, double the rate of mined output, signaling a durable pivot toward circular-economy inputs for the copper market.
The Copper Market Report is Segmented by Source (Mining and Recycling), End-Use Industry (Building Construction, Infrastructure, Industrial, Transportation, Consumer Products and Electronic Equipment, and Others), and Geography (Asia-Pacific, North America, Europe, South America, and Middle East and Africa). The Market Forecasts are Provided in Terms of Volume (Tons).
Geography Analysis
Asia-Pacific commanded 70.30% of 2025 consumption, propelled by China's integrated smelting-to-fabrication ecosystem and India's accelerating grid build-out. China also houses 44% of global refining capacity, giving the region price-setting clout and the ability to stockpile cathode when futures curves turn backwardated.
North America and Europe remain mature but are entering renewal phases. The United States has closed four refineries since 2000, exporting 341,000 t of concentrate for overseas processing in 2023, yet the Inflation Reduction Act has earmarked funds to reshore smelting capacity. Europe's offshore-wind agenda mandates HVDC cable procurement that supports premium-grade cathode imports, while stringent recycling directives favor secondary smelters that lower Scope 3 emissions for downstream manufacturers.
The Middle East & Africa represents the fastest-growing arena, with a 5.21% CAGR forecast as sovereign-wealth investors channel capital into Zambian, DRC, and Namibian projects. Gulf states are also funding domestic downstream capacity to hedge against oil-revenue volatility, linking African feedstock with local rod and tube mills to create an emergent south-south supply chain for the copper market.
- Antofagasta plc
- Aurubis AG
- BHP
- Codelco
- First Quantum Minerals
- Freeport-McMoRan
- Glencore
- Grupo Mexico (Southern Copper Corporation)
- Hindustan Copper Limited
- Jiangxi Copper Corporation
- Kaz Minerals
- KGHM
Additional Benefits:
- The market estimate (ME) sheet in Excel format
- 3 months of analyst support
TABLE OF CONTENTS
1 Introduction
- 1.1 Study Assumptions & Market Definition
- 1.2 Scope of the Study
2 Research Methodology
3 Executive Summary
4 Market Landscape
- 4.1 Market Overview
- 4.2 Market Drivers
- 4.2.1 Expanding Demand from Renewable Energy and Grid Electrification
- 4.2.2 Rapid Growth in EV Copper Intensity
- 4.2.3 Urban Infrastructure Expansion in Emerging Markets
- 4.2.4 HVDC Submarine Cables for Offshore Wind
- 4.2.5 Antimicrobial Copper Adoption in Healthcare
- 4.3 Market Restraints
- 4.3.1 Stringent Environmental Regulations and Permitting Delays
- 4.3.2 Copper Price Volatility Driven by Speculative Trading
- 4.3.3 Competition from Lightweight Alternative Conductors
- 4.4 Value Chain Analysis
- 4.5 Porter's Five Forces Analysis
- 4.5.1 Threat of New Entrants
- 4.5.2 Bargaining Power of Buyers
- 4.5.3 Bargaining Power of Suppliers
- 4.5.4 Threat of Substitute Products
- 4.5.5 Degree of Competition
5 Market Size & Growth Forecasts (Volume)
- 5.1 By Source
- 5.1.1 Mining
- 5.1.2 Recycling
- 5.2 By End-use Industry
- 5.2.1 Building Construction
- 5.2.2 Infrastructure
- 5.2.3 Industrial
- 5.2.4 Transportation
- 5.2.5 Consumer Products and Electronic Equipment
- 5.2.6 Others
- 5.3 By Geography
- 5.3.1 Asia-Pacific
- 5.3.1.1 China
- 5.3.1.2 Japan
- 5.3.1.3 India
- 5.3.1.4 South Korea
- 5.3.1.5 Rest of Asia-Pacific
- 5.3.2 North America
- 5.3.2.1 United States
- 5.3.2.2 Canada
- 5.3.2.3 Mexico
- 5.3.3 Europe
- 5.3.3.1 Germany
- 5.3.3.2 United Kingdom
- 5.3.3.3 France
- 5.3.3.4 Italy
- 5.3.3.5 Rest of Europe
- 5.3.4 South America
- 5.3.4.1 Brazil
- 5.3.4.2 Argentina
- 5.3.4.3 Rest of South America
- 5.3.5 Middle East and Africa
- 5.3.5.1 Saudi Arabia
- 5.3.5.2 South Africa
- 5.3.5.3 Rest of Middle East and Africa
- 5.3.1 Asia-Pacific
6 Competitive Landscape
- 6.1 Market Concentration
- 6.2 Strategic Moves
- 6.3 Market Share (%)**/Ranking Analysis
- 6.4 Company Profiles (includes Global level Overview, Market level overview, Core Segments, Financials as available, Strategic Information, Market Rank/Share for key companies, Products & Services, and Recent Developments)
- 6.4.1 Antofagasta plc
- 6.4.2 Aurubis AG
- 6.4.3 BHP
- 6.4.4 Codelco
- 6.4.5 First Quantum Minerals
- 6.4.6 Freeport-McMoRan
- 6.4.7 Glencore
- 6.4.8 Grupo Mexico (Southern Copper Corporation)
- 6.4.9 Hindustan Copper Limited
- 6.4.10 Jiangxi Copper Corporation
- 6.4.11 Kaz Minerals
- 6.4.12 KGHM
7 Market Opportunities & Future Outlook
- 7.1 White-space & Unmet-need Assessment
 铜:全球市场份额和排名、总收入和需求预测(2026-2032年)
 数控主轴市场:2026-2032年全球市场预测(依冷却方式、转速、功率范围、加工材料、安装方式、应用及最终用途产业划分)铜市场:2026-2032年全球市场预测(按形状、产品类型、应用和最终用途行业划分)铜型材市场:依产品类型、铜牌、製造流程、表面处理及最终用途产业划分,全球预测,2026-2032年铜矿开采市场:2026-2032年全球预测,依开采方法、矿石类型、产品类型、通路和应用划分
 2026年全球铜磷合金市场研究报告数控车床主轴市场:依主轴类型、轴配置、转速范围、轴承类型、安装方向、最终用户划分,全球预测,2026-2032年
 无机铜化学品市场规模、份额和成长分析:按产品类型、配方类型、最终用途产业、销售管道和地区划分-2026-2033年产业预测
 钴铜产品市场规模、份额和成长分析:按产品类型、形态、最终用途产业、电池应用、地区和产业预测,2026-2033年
 铜金属市场分析及预测(至2035年):依类型、产品、应用、形态、材质、最终用户、技术、功能、安装类型及设备划分