


 |
市场调查报告书
商品编码
1934827
美国电信铁塔:市场占有率分析、产业趋势与统计、成长预测(2026-2031)United States Telecom Towers - Market Share Analysis, Industry Trends & Statistics, Growth Forecasts (2026 - 2031) |
||||||
※ 本网页内容可能与最新版本有所差异。详细情况请与我们联繫。
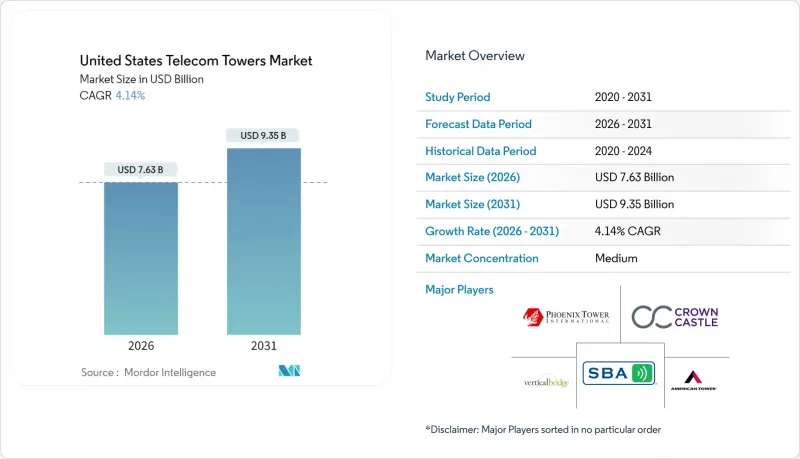
据估计,到 2026 年,美国电信铁塔市值将达到 76.3 亿美元,高于 2025 年的 73.3 亿美元。
预计到 2031 年将达到 93.5 亿美元,2026 年至 2031 年的复合年增长率为 4.14%。
长期成长依赖中频段和C频段5G网路密度的提升,而非大规模建设新基地台。因此,营运商正透过先进的天线系统和多租户租赁模式,从现有资产中获取更多收益。独立铁塔公司扩张最为迅速,主要得益于通讯业者出售资产并将资金再投资于频宽。能源现代化,尤其是太阳能混合动力,是另一个大结构性利多因素,因为燃料成本波动和环境法规的推动,加速了可再生能源的普及。同时,优惠的联邦税收政策和国防支出的开放式无线接入网(Open-RAN)试点项目,即使在高利率环境下,也确保了资金持续流入现代化计划。
美国电信铁塔市场趋势与洞察
5G中频段和C频段密集化波
通讯业者在2025年投入约350亿美元的资本支出用于3.5GHz和C频段的升级改造,这些升级将在现有设施中加装天线、无线电设备和电力系统,而非新建设。这种转变使得拥有维修经验的铁塔公司能够获得更高的租金,并更快地增加租户。 T-Mobile迅速部署原Sprint的中频宽频谱就是一个典型的例子,它展示了在数千个共享站点上进行高密度部署如何创造新的收入来源。即使在受分区法规限制新建设的地区,对站点升级的重视也推动了美国电信铁塔市场的成长。技术复杂性增加了通讯业者转换营运商的门槛,从而增强了长期租赁的稳定性,并为大型铁塔房地产投资信託基金(REIT)带来了可预测的现金流。
美国国税局「安全港」特殊折旧
加速折旧政策允许铁塔所有者在第一年累计,从而提高税后收益并释放资金用于其他计划。独立营运商可以透过具有竞争力的租金递增机制将部分收益转让给通讯业者,从而增强其自有铁塔的价值提案。符合条件的资产范围已从钢筋混凝土扩展到光纤回程传输、电池和加固设备,使得该激励措施在多轮升级中均有效。这项政策尤其有利于农村地区,因为这些地区的租户收入较低,但现代化成本是固定的,从而维持了美国电信铁塔市场的全国成长动能。
地方政府的高度限制(低于 150 英尺)
许多郊区市政当局现在将建筑物高度限制在 150 英尺以内,这延长了审批週期并增加了设计复杂性。营运商要么必须采用更昂贵的隐藏式桿塔,要么必须增设屋顶小型基站,通常需要将站点数量增加一倍才能达到类似的覆盖范围。核准时间可能超过 24 个月,这会延迟现金流并减缓美国电信铁塔市场的成长速度。
细分市场分析
预计到2025年,独立铁塔公司将占据美国电信铁塔市场75.02%的份额,并在2031年之前保持4.66%的复合年增长率。通讯业者资产出售所得资金正用于频谱竞标,Verizon向Vertical Bridge出售6339个基地台(价值33亿美元)的案例,正是营运商向轻资产战略转型多年战略的典型代表。每个铁塔拥有多个租户可以提高获利能力,而维护、能源和许可方面的规模综效则能带来结构性的成本优势。
在需要直接控制以保障关键任务涵盖的地区,业者自有站点仍具有重要的策略意义,但其相对成长速度较为缓慢。在农村和军事建设领域,合资企业应运而生,使通讯业者能够在利用独立专业知识的同时保持影响力。
在美国电信塔市场,预计到 2025 年,地面安装式塔架将占收入的 74.15%,而屋顶安装式塔架预计到 2031 年将以 5.24% 的复合年增长率增长。由于在人口密集的城市地区安装新的宏塔很困难,与业主达成的协议可以快速安装屋顶塔架,从而填补毫米波覆盖的空白。
地面基地台的平均租户密度仍然最高,根据Crown Castle报告,平均每座塔楼有2.4个租户。因此,它们仍然是核心收入来源。然而,分区限制和美观方面的考虑正在推动对隐藏式建筑幕墙、筒桿式和女儿墙式小型基地台的需求成长。这些都市区设施的开发週期较短,即使租金较低,也能更快实现收入。
美国电信铁塔市场报告按所有权类型(通讯业者拥有、独立铁塔公司等)、安装类型(屋顶安装、地面安装)、燃料类型(可再生能源供电、电网/柴油混合供电)和铁塔类型(单极塔、格构塔、拉线塔、隐蔽式/暗装塔)进行细分。市场预测以价值(美元)和数量(已安装基数)为单位。
其他福利:
- Excel格式的市场预测(ME)表
- 3个月的分析师支持
目录
第一章 引言
- 研究假设和市场定义
- 调查范围
- 分类系统
第二章调查方法
第三章执行摘要
- 电信铁塔数量预测(单位数量,2023-2030 年)
- 电信铁塔租赁收入预测(美元,2023-2030 年)
- 电信铁塔建设收入预测(美元,2023-2030 年)
第四章 市场情势
- 市场概览
- 市场驱动因素
- 5G中频段和C频段密度增强波
- 根据美国国税局「安全港」条款,塔楼维修可享有特殊折旧。
- 美国国防部资助各军事基地进行开放式无线接取网路(Open-RAN)试点项目
- T-Mobile与Crown Castle续约12年主租赁协议
- CHIPS 和科学法案光纤塔税额扣抵
- 省级太阳能混合发电净计量
- 市场限制
- 地方政府的高度限制(低于 150 英尺)
- 资本成本较高(联邦基金利率 > 4.75%)
- 有线 MVNO CBRS小型基地台卸载
- 柴油发电机加油禁令(2028 年后)
- 生态系分析
- 电讯基础设施相关法规
- 技术展望
- 波特五力分析
- 供应商的议价能力
- 买方的议价能力
- 新进入者的威胁
- 替代品的威胁
- 竞争对手之间的竞争
- 宏观经济因素如何影响市场
第五章 市场规模及成长预测(价值与数量,2023-2030 年)
- 依所有权类型
- 企业所有
- 独立铁塔公司
- 合资塔楼公司
- MNO独家
- 透过安装
- 屋顶安装类型
- 地面安装
- 按燃料类型
- 可再生能源
- 电网/柴油混合动力
- 按塔类型
- 单极子
- 格子
- 包含拉线
- 隐蔽/隐藏
第六章 竞争情势
- 市场集中度
- 重大併购详情
- 主要供应商市占率分析
- 公司简介
- TowerCos
- American Tower Corporation
- Crown Castle Inc.
- SBA Communications Corp.
- Vertical Bridge, REIT, LLC
- Phoenix Tower International(PTI)
- Mobile Network Operator
- Verizon Communications Inc.
- AT&T Inc.
- T-Mobile US, Inc.
- Dish Wireless(DISH Network LLC)
- TowerCos
第七章 市场机会与未来展望
United States Telecom Towers Market size in 2026 is estimated at USD 7.63 billion, growing from 2025 value of USD 7.33 billion with 2031 projections showing USD 9.35 billion, growing at 4.14% CAGR over 2026-2031.
Long-term growth hinges on densifying mid-band and C-band 5G rather than erecting large volumes of new structures, so operators are extracting more revenue from existing assets through advanced antenna systems and multi-tenant lease-up. Independent tower companies have scaled fastest, helped by carrier asset divestitures that recycle capital into spectrum. Energy modernization, particularly solar-hybrid power, is another structural tailwind as fuel cost volatility and environmental rules accelerate renewable deployments. Simultaneously, favorable federal tax incentives and defense-funded Open-RAN pilots keep capital flowing into modernization projects even as borrowing rates stay elevated.
United States Telecom Towers Market Trends and Insights
5G Mid-Band and C-Band Densification Wave
Carriers are channeling roughly USD 35 billion of 2025 capex into 3.5 GHz and C-band upgrades that bolt additional antennas, radios, and power systems onto existing structures rather than funding green-field builds. This shift allows tower companies with proven modification expertise to command higher amendment rents and quicker tenant additions. T-Mobile's rapid deployment of ex-Sprint mid-band spectrum exemplifies how densification generates fresh revenue streams across thousands of co-located sites. The emphasis on site upgrades keeps the United States telecom towers market growing, even where new construction is zoning-constrained. Engineering complexity also raises switching barriers for carriers, reinforcing long leases and predictable cash flows for leading tower REITs.
IRS "Safe-Harbor" Bonus Depreciation
Accelerated depreciation lets tower owners expense a large share of upgrade costs in year one, boosting after-tax returns and freeing cash for additional projects. Independent operators pass part of this benefit to carrier tenants through competitive rent escalators, thereby strengthening their value proposition versus self-owned towers. Qualifying assets extend beyond steel and concrete to fiber backhaul, batteries, and environmental hardening, making the incentive relevant across multiple upgrade waves. The policy particularly supports rural sites where revenue per tenant is lower, yet modernization costs remain fixed, sustaining nationwide momentum for the United States telecom towers market.
Municipal Height Caps (<150 ft)
Many suburban councils now cap structure height at 150 ft, lengthening permitting cycles and raising design complexity . Operators must adopt costlier stealth poles or add rooftop small cells, often doubling site counts for equivalent coverage. Approval timelines can exceed 24 months, deferring cash flows and tempering the growth trajectory of the United States telecom towers market.
Other drivers and restraints analyzed in the detailed report include:
- DoD Open-RAN Pilot Funding
- Fiber-to-Tower tax credits in CHIPS and Science Act
- High Cost of Capital
For complete list of drivers and restraints, kindly check the Table Of Contents.
Segment Analysis
Independent tower companies dominated the United States telecom towers market with a 75.02% share in 2025 and are on track for a 4.66% CAGR through 2031. Carrier divestitures free up funds for spectrum auctions, so Verizon's USD 3.3 billion sale of 6,339 sites to Vertical Bridge capped a multi-year shift to asset-light strategies. Multiple tenants per structure lift returns, and scale synergies in maintenance, energy, and permitting create structural cost advantages.
Operator-owned sites remain strategically important where mission-critical coverage demands direct control, yet their relative growth lags. Joint-venture vehicles emerge for rural or military builds where carriers retain influence while leveraging independent expertise.
Ground-based structures accounted for 74.15% of 2025 revenue within the United States telecom towers market; rooftops, however, carry a 5.24% CAGR outlook to 2031. Dense downtown corridors often prohibit new macro towers, so property-owner agreements enable quicker rooftop deployments that fill millimeter-wave coverage gaps.
Ground sites still drive the highest average tenancy, Crown Castle reports 2.4 tenants per tower, so they remain core revenue engines . Yet zoning pushback and aesthetics tilt incremental demand toward concealed facades, canister poles, and parapet-mounted small cells. These urban installations carry shorter development cycles, supporting faster revenue realization even if per-site rent is lower.
The United States Telecom Towers Market Report is Segmented by Ownership (Operator-Owned, Independent TowerCo, and More), Installation (Rooftop, Ground-Based), Fuel Type (Renewable-Powered, Grid/Diesel Hybrid), and Tower Type (Monopole, Lattice, Guyed, Stealth/Concealed). The Market Forecasts are Provided in Terms of Value (USD) and Volume (Installed Base).
List of Companies Covered in this Report:
- TowerCos
- Mobile Network Operator
Additional Benefits:
- The market estimate (ME) sheet in Excel format
- 3 months of analyst support
TABLE OF CONTENTS
1 INTRODUCTION
- 1.1 Study Assumptions and Market Definition
- 1.2 Scope of the Study
- 1.3 Taxonomy
2 RESEARCH METHODOLOGY
3 EXECUTIVE SUMMARY
- 3.1 Telecom Tower Volume Estimates (Units, 2023-2030)
- 3.2 Telecom Tower Leasing Revenue Estimates (USD, 2023-2030)
- 3.3 Telecom Tower Construction Revenue Estimates (USD, 2023-2030)
4 MARKET LANDSCAPE
- 4.1 Market Overview
- 4.2 Market Drivers
- 4.2.1 5G mid-band and C-band densification wave
- 4.2.2 IRS "safe-harbor" bonus depreciation on tower upgrades
- 4.2.3 DoD Open-RAN pilot funding across military bases
- 4.2.4 T-Mobile and Crown Castle 12-yr master-lease renewal
- 4.2.5 Fiber-to-Tower tax credits in CHIPS and Science Act
- 4.2.6 State-level net-metering for solar-hybrid power
- 4.3 Market Restraints
- 4.3.1 Municipal height caps (<150 ft)
- 4.3.2 High cost of capital (Fed Funds >4.75 %)
- 4.3.3 Cable-MVNO CBRS small-cell off-load
- 4.3.4 Diesel-genset refueling moratoria (post-2028)
- 4.4 Ecosystem Analysis
- 4.5 Regulatory Landscape Related to Telecom Infrastructure
- 4.6 Technological Outlook
- 4.7 Porter's Five Forces Analysis
- 4.7.1 Bargaining Power of Suppliers
- 4.7.2 Bargaining Power of Buyers
- 4.7.3 Threat of New Entrants
- 4.7.4 Threat of Substitutes
- 4.7.5 Intensity of Competitive Rivalry
- 4.8 Impact of Macroeconomic Factors on the Market
5 MARKET SIZE AND GROWTH FORECASTS (VALUE AND VOLUME, 2023-2030)
- 5.1 By Ownership
- 5.1.1 Operator-owned
- 5.1.2 Independent TowerCo
- 5.1.3 Joint-Venture TowerCo
- 5.1.4 MNO Captive
- 5.2 By Installation
- 5.2.1 Rooftop
- 5.2.2 Ground-based
- 5.3 By Fuel Type
- 5.3.1 Renewable-powered
- 5.3.2 Grid/Diesel Hybrid
- 5.4 By Tower Type
- 5.4.1 Monopole
- 5.4.2 Lattice
- 5.4.3 Guyed
- 5.4.4 Stealth / Concealed
6 COMPETITIVE LANDSCAPE
- 6.1 Market Concentration
- 6.2 Details of Major Mergers and Acquisitions
- 6.3 Market Share Analysis for Top Vendors
- 6.4 Company Profiles (includes Global level Overview, Market level overview, Core Segments, Financials, Strategic Information,Products and Services, Recent Developments)
- 6.4.1 TowerCos
- 6.4.1.1 American Tower Corporation
- 6.4.1.2 Crown Castle Inc.
- 6.4.1.3 SBA Communications Corp.
- 6.4.1.4 Vertical Bridge, REIT, LLC
- 6.4.1.5 Phoenix Tower International (PTI)
- 6.4.2 Mobile Network Operator
- 6.4.2.1 Verizon Communications Inc.
- 6.4.2.2 AT&T Inc.
- 6.4.2.3 T-Mobile US, Inc.
- 6.4.2.4 Dish Wireless (DISH Network L.L.C)
- 6.4.1 TowerCos
7 MARKET OPPORTUNITIES AND FUTURE OUTLOOK
- 7.1 White-space and Unmet-need Assessment
- 7.2 Investment Analysis
- 7.3 Analyst Suggestions and Recommendations
 通讯塔市场规模、份额、趋势和预测:按塔型、燃料类型、安装方式、所有权方式和地区划分,2026-2034 年
 隐蔽通讯塔市场规模、份额和成长分析:按伪装设计/类型、塔架结构、频率/频段相容性、安装位置和地区划分-2026-2033年产业预测
 行动电话基地台管理市场:依接取技术、塔型、安装方式、服务类型、高度等级、组件类型及最终用户产业划分-2026-2032年全球市场预测
 2026年全球数位双胞胎市场报告
 2026-2030年全球电信塔市场2026年全球通讯塔市场报告
 非洲电信塔及相关产业:市场占有率分析、产业趋势与统计、成长预测(2026-2031)
 塔架管理软体市场 - 全球产业规模、份额、趋势、机会及预测(按部署类型、塔架类型、功能、最终用户、地区和竞争格局划分,2021-2031 年)电信塔供电系统市场-全球产业规模、份额、趋势、机会与预测:电源、电网、组件、区域和竞争格局,2021-2031年
 电信塔市场规模、份额和成长分析(按类型、燃料类型、安装方式、所有权类型和地区划分)—产业预测,2026-2033年