


 |
市场调查报告书
商品编码
1934845
云端运算:市场占有率分析、产业趋势与统计、成长预测(2026-2031)Cloud Computing - Market Share Analysis, Industry Trends & Statistics, Growth Forecasts (2026 - 2031) |
||||||
※ 本网页内容可能与最新版本有所差异。详细情况请与我们联繫。
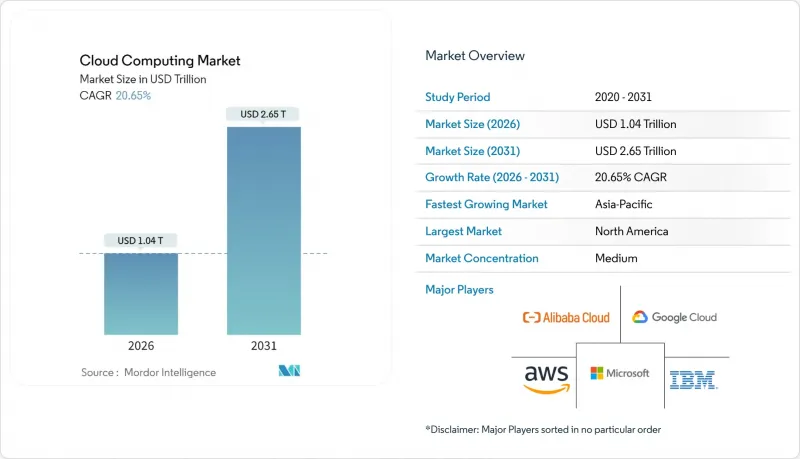
预计云端运算市场将从 2025 年的 8,600 亿美元成长到 2026 年的 1.04 兆美元,到 2031 年达到 2.65 兆美元,2026 年至 2031 年的复合年增长率为 20.65%。
这种快速成长与以人工智慧为先导的数位转型计画、核心应用程式向SaaS平台的迁移、欧洲和沿岸地区主权云端法规的扩展,以及支援扩增实境(XR)和自动驾驶用例的10毫秒以下边缘云端区域的部署密切相关。因此,超大规模云端服务供应商正在迅速扩展其GPU密集型资料中心的面积,而产业专用的云端蓝图正在简化医疗保健、金融和公共部门的合规性。同时,随着企业寻求工作负载可携性和成本控制,混合云端策略的重要性日益凸显。提供者之间日益激烈的竞争使得多重云端互通性成为重中之重,而开放的生态系统(而非锁定)正在成为创造新价值的关键驱动力。
全球云端运算市场趋势与洞察
SaaS在关键业务线软体领域的爆炸性成长
云端迁移的应用范围已从生产力工作负载扩展到业务线的企业资源规划 (ERP)、客户关係管理 (CRM) 和财务系统,这一转变正日益重塑整个云端运算市场。Delta航空在 2024 年投资 5 亿美元用于数位化基础架构的现代化改造,利用 SaaS 实现人工智慧驱动的个人化服务并提升航班准点率。这一转变实现了持续的功能更新和嵌入式分析,从而支援即时决策,而这些是本地部署软体无法实现的。受监管行业由于 SaaS 堆迭中内建的标准化合规控制,审核速度更快,营运成本更低。与优先采用 SaaS 的竞争对手相比,延迟迁移的企业将面临功能缺失和产品週期延长的风险。
需要弹性运算的生成式人工智慧工作负载激增
训练大型语言模式需要数千个高频宽GPU并行运作,远超过传统企业工作负载的规模。 OracleOracle为其位于德克萨斯的OpenAI资料中心预订了价值400亿美元的NVIDIA处理器,用于2025年。这种规模将从根本上改变资料中心的供电、冷却和网路架构设计。供应商正在围绕AI优化晶片、直接液冷和高速互连进行重新设计,以满足不断增长的需求。客户越来越倾向于选择能够为突发性AI实验和生产推理提供容量保证和经济效益的供应商。
资料本地化法律使全球足迹支离破碎
司法管辖区居住规则迫使服务提供者复製基础设施并创建独立的逻辑环境,从而增加成本和营运复杂性。跨国公司在储存、处理和人员存取方面面临重迭的义务,这通常迫使它们重新设计架构并提高服务价格。
细分市场分析
平台即服务 (PaaS) 预计将在 2026 年至 2031 年间以 22.85% 的年复合成长率(CAGR)增长,成为所有服务模式中增长最快的。软体即服务 (SaaS) 将在 2025 年保持其 52.87% 的主导收入份额,而基础设施即服务 (IaaS) 将继续作为其灵活的底层支撑。 PaaS 浪潮的驱动力来自容器编排管理、无伺服器运行时和低程式码工具,这些技术将发布週期从数月缩短至数週。亚马逊已投资 1500 亿美元用于以人工智慧为中心的资料中心,以支援这些 PaaS 工作负载。随着服务供应商透过内建安全和人工智慧服务增强其平台,开发人员可以腾出精力专注于使用者价值,而不是底层架构的维护。
在云端运算市场,PaaS 供应商正日益透过产业框架和整合的 MLOps 功能来凸显自身差异化优势。这些功能能够加速进阶分析的部署,提升程式码质量,并降低开发人员的工作量。这种组合使 PaaS 成为数位化产品的策略推动者,支援快速实验和持续交付。
到2025年,私有云端将占总营收的46.62%,而混合云端正以22.24%的复合年增长率快速成长。这种模式既能确保敏感工作负载的资料接近性,又能利用公共云端的容量进行测试、分析和灾害復原。随着企业在本地基础设施和外包容量中采用Kubernetes控制平面,混合云部署的市场规模预计将呈指数级增长。
Oracle和 AWS 的跨云端协定免除了资料传输费用,并使Oracle资料库能够在两个云端服务供应商之间无缝运作。互通性降低了供应商锁定风险,并帮助客户优化效能和价格。因此,混合云策略既是合规性的保障,也是实现现代化的跳板,避免了风险极高的「即拆即迁移」。
云端运算市场依服务模式(IaaS、PaaS、SaaS)、部署模式(公共云端、私有云端、混合云端)、最终用户产业(IT与电信、银行、金融服务和保险、製造业等)、组织规模(大型企业、中小企业)和地区进行细分。市场预测以美元计价。
区域分析
北美地区凭藉其领先云端运算应用优势和众多数位化原生企业的集中度,在2025年贡献了24.18%的收入。投资仍在继续:亚马逊正斥资300亿美元在宾州和北卡罗莱纳州兴建园区,微软计画在2025财年投入800亿美元的资本支出。该地区目前的成长主要围绕着人工智慧工作负载展开,这需要接近性人才和研究中心。随着企业为了实现冗余和成本优化而分散工作负载,加拿大和墨西哥也涌现出新的机会。
在欧洲,积极的数位转型目标与严格的资料主权法规之间的平衡正在塑造该地区云端运算市场的发展轨迹。企业倾向于采用混合架构,将敏感资料保留在本地,同时利用全球云端进行开发和分析。 OVHcloud 等供应商将欧洲数据居住作为其独特的卖点。英国脱欧后的地缘政治变化迫使英国企业应对不断变化的跨境资料协议,这进一步推动了混合架构的普及。
亚太地区是未来的成长引擎,预计复合年增长率将达到21.65%。基础建设计划正在快速扩张,Sify计划在印度投资50亿美元建造一座专注于人工智慧的资料中心。阿里云和腾讯云等国内巨头主导中国市场,而国际供应商则将目光投向了日本、韩国、印度以及快速成长的东南亚国协。各国政府都在支持「云端优先」政策和智慧城市计划,这加速了对可扩展平台的需求。
其他福利:
- Excel格式的市场预测(ME)表
- 分析师支持(3个月)
目录
第一章 引言
- 研究假设和市场定义
- 调查范围
第二章调查方法
第三章执行摘要
第四章 市场情势
- 市场概览
- 市场驱动因素
- SaaS在关键业务线软体领域的爆炸性成长
- 需要弹性运算的生成式人工智慧工作负载激增
- 产业专用的云端平台(合规蓝图)
- 欧盟和海湾合作委员会的主权云授权
- 面向 XR 和自主运作的 10 毫秒以下边缘云端区域的兴起
- 与范围 3 目标相关的绿色云采购标准
- 市场限制
- 数据本地化法律导致全球营运碎片化
- 运作成本高于本地部署的总拥有成本。
- 高等级的半导体出口限制限制了GPU的供应。
- 超大规模资料中心低碳电力短缺
- 供应链分析
- 监管环境
- 技术展望
- 波特五力分析
- 新进入者的威胁
- 买方的议价能力
- 供应商的议价能力
- 替代品的威胁
- 竞争对手之间的竞争
- 对影响市场的宏观经济因素进行评估
第五章 市场规模与成长预测
- 按服务模式
- IaaS
- PaaS
- SaaS
- 按部署模式
- 公共云端
- 私有云端
- 混合云端
- 按最终用户行业划分
- 资讯科技和电信
- BFSI
- 製造业
- 零售和消费品
- 医疗保健和生命科学
- 其他的
- 按公司规模
- 大公司
- 中小企业
- 按地区
- 北美洲
- 我们
- 加拿大
- 墨西哥
- 南美洲
- 巴西
- 阿根廷
- 其他南美洲
- 欧洲
- 德国
- 英国
- 法国
- 义大利
- 西班牙
- 其他欧洲地区
- 亚太地区
- 中国
- 日本
- 印度
- 韩国
- 东南亚
- 亚太其他地区
- 中东和非洲
- 中东
- 沙乌地阿拉伯
- 阿拉伯聯合大公国
- 土耳其
- 其他中东地区
- 非洲
- 南非
- 奈及利亚
- 埃及
- 其他非洲地区
- 中东
- 北美洲
第六章 竞争情势
- 市场集中度
- 策略趋势
- 市占率分析
- 公司简介
- Amazon(AWS)
- Microsoft
- Google Cloud
- Alibaba Cloud
- IBM
- Oracle
- Salesforce
- SAP SE
- Adobe
- Tencent Cloud
- Huawei Cloud
- Rackspace
- VMware
- Snowflake
- Workday
- ServiceNow
- DigitalOcean
- OVHcloud
- Linode
- Nutanix
第七章 市场机会与未来展望
The Cloud Computing market is expected to grow from USD 0.86 trillion in 2025 to USD 1.04 trillion in 2026 and is forecast to reach USD 2.65 trillion by 2031 at 20.65% CAGR over 2026-2031.
The surge is tied to AI-first digital-transformation agendas, enterprise migration of core applications to Software-as-a-Service (SaaS) platforms, expanding sovereign-cloud rules in Europe and the Gulf, and the rollout of sub-10 millisecond edge-cloud zones that underpin extended-reality (XR) and autonomous-operations use cases. Hyperscale providers are therefore racing to enlarge GPU-rich data-center footprints, while industry-specific cloud blueprints simplify compliance for health, finance, and the public sector. At the same time, hybrid-cloud strategies gain prominence as enterprises seek workload portability and cost discipline. Intensifying competition among providers is pushing multi-cloud interoperability to the forefront, positioning open ecosystems over lock-in as a new source of value creation.
Global Cloud Computing Market Trends and Insights
Explosive SaaS adoption in core enterprise software
Cloud migrations now encompass mission-critical enterprise-resource-planning, customer-relationship-management, and finance systems rather than only productivity workloads, a shift that is increasingly shaping the broader Cloud Computing Market. Delta Air Lines finalized a USD 500 million overhaul of its digital core in 2024, using SaaS to enable AI-driven personalization and punctuality improvements. The pivot delivers continuous feature updates and embedded analytics, unlocking real-time decision-making that on-premises software cannot match. Regulated sectors benefit from standardized compliance controls baked into SaaS stacks, accelerating audits and lowering operational overhead. Organizations delaying migration risk capability gaps and slower product cycles compared with SaaS-first peers
Proliferation of Gen-AI workloads demanding elastic compute
Large-language-model training requires thousands of high-bandwidth GPUs operating in parallel, dwarfing previous enterprise-workload footprints. Oracle reserved USD 40 billion worth of Nvidia processors for a Texas site supporting OpenAI in 2025. Such scale drives radical shifts in data-center power, cooling, and network fabric design. Providers are re-architecting around AI-optimized silicon, direct-liquid cooling, and high-speed interconnects to satisfy growing demand. Customers gravitate toward vendors able to guarantee capacity and favorable economics for bursty AI experiments and production inference.
Data-localization laws fragmenting global footprints
Jurisdiction-specific residency rules compel providers to duplicate infrastructure and create discrete logical environments, adding cost and operational complexity. Multinationals face overlapping obligations on storage, processing, and personnel access, often forcing architectural redesigns and higher service prices.
Other drivers and restraints analyzed in the detailed report include:
- Industry-specific cloud platforms (compliance-ready blueprints)
- Sovereign-cloud mandates in EU and GCC
- Run-rate cost overruns vs on-prem TCO
For complete list of drivers and restraints, kindly check the Table Of Contents.
Segment Analysis
Platform-as-a-Service is forecast to compound at 22.85% from 2026-2031, the quickest pace among service models. SaaS retained a commanding 52.87% of 2025 revenue, while Infrastructure-as-a-Service remains the elastic foundation underneath. The PaaS wave is fueled by container orchestration, serverless runtimes, and low-code tools that compress release cycles from months to weeks. Amazon earmarked USD 150 billion for AI-centric data centers catering to those PaaS workloads. As providers enrich platforms with built-in security and AI services, developers gain more freedom to focus on user value rather than plumbing.
In the cloud computing market, PaaS vendors increasingly differentiate through industry frameworks and integrated MLOps. These capabilities shorten deployment of advanced analytics, raise code quality, and reduce developer toil. The combination positions PaaS as a strategic lever for digital products, underpinning rapid experimentation and continuous delivery.
Although private clouds captured 46.62% revenue in 2025, hybrid clouds are expanding at 22.24% CAGR. The model preserves data closeness for sensitive workloads while bursting to public capacity for testing, analytics, and disaster recovery. The cloud computing market size for hybrid deployments is set to rise sharply as firms standardize Kubernetes control planes across on-premises cores and outsourced capacity.
Oracle's cross-cloud pact with AWS eliminates data-egress fees and permits Oracle Database to run seamlessly on either provider. Interoperability curbs vendor-lock fears and lets customers optimize on performance or price. Consequently, the hybrid strategy is viewed as a safety valve for compliance and a springboard for modernization without risky forklift migrations.
Cloud Computing Market is Segmented by Service Model (IaaS, Paas, Saas). Deployment Model (Public Cloud, Private Cloud, Hybrid Cloud), End User Vertical (IT and Telecom, BFSI, Manufacturing, and More), Organization Size (Large Enterprises, Small and Mid-Sized Enterprises (SMEs)) and by Geography. The Market Forecasts are Provided in Terms of Value (USD).
Geography Analysis
North America commanded 24.18% of 2025 revenue thanks to an early lead in cloud adoption and dense clusters of digital-native enterprises. Investment continues: Amazon is channeling USD 30 billion into Pennsylvania and North Carolina campuses, while Microsoft plans USD 80 billion in fiscal-year 2025 capacity. Growth in the region now pivots around AI workloads that demand proximity to talent and research hubs. Canada and Mexico open incremental opportunities as firms spread workloads for redundancy and cost optimization.
Europe balances aggressive digital-transformation targets with stringent data-sovereignty rules, shaping the region's trajectory within the Cloud Computing Market. Organizations favor hybrid architectures that keep sensitive data local yet leverage global clouds for development and analytics. Providers such as OVHcloud emphasize European data residency as a unique selling point. Geopolitical shifts post-Brexit compel UK businesses to navigate evolving cross-border data agreements, further reinforcing hybrid adoption.
Asia-Pacific is the engine of future expansion, with a projected 21.65% CAGR. Infrastructure projects scale rapidly: Sify will invest USD 5 billion in Indian AI-focused data centers. Domestic champions such as Alibaba Cloud and Tencent Cloud dominate China, while international providers target Japan, South Korea, India, and fast-growing ASEAN states. Governments back cloud-first policies and smart-city programs, accelerating demand for scalable platforms.
- Amazon (AWS)
- Microsoft
- Google Cloud
- Alibaba Cloud
- IBM
- Oracle
- Salesforce
- SAP SE
- Adobe
- Tencent Cloud
- Huawei Cloud
- Rackspace
- VMware
- Snowflake
- Workday
- ServiceNow
- DigitalOcean
- OVHcloud
- Linode
- Nutanix
Additional Benefits:
- The market estimate (ME) sheet in Excel format
- 3 months of analyst support
TABLE OF CONTENTS
1 INTRODUCTION
- 1.1 Study Assumptions and Market Definition
- 1.2 Scope of the Study
2 RESEARCH METHODOLOGY
3 EXECUTIVE SUMMARY
4 MARKET LANDSCAPE
- 4.1 Market Overview
- 4.2 Market Drivers
- 4.2.1 Explosive SaaS adoption in core enterprise software
- 4.2.2 Proliferation of Gen-AI workloads demanding elastic compute
- 4.2.3 Industry-specific cloud platforms (compliance-ready blueprints)
- 4.2.4 Sovereign-cloud mandates in EU and GCC
- 4.2.5 Rise of less than 10 ms edge-cloud zones for XR and autonomous ops
- 4.2.6 Green-cloud buying criteria tied to Scope-3 targets
- 4.3 Market Restraints
- 4.3.1 Data-localisation laws fragmenting global footprints
- 4.3.2 Run-rate cost overruns vs on-prem TCO
- 4.3.3 Advanced chip export controls limiting GPU supply
- 4.3.4 Scarcity of low-carbon power for hyperscale DCs
- 4.4 Supply-Chain Analysis
- 4.5 Regulatory Landscape
- 4.6 Technological Outlook
- 4.7 Porter's Five Forces Analysis
- 4.7.1 Threat of New Entrants
- 4.7.2 Bargaining Power of Buyers
- 4.7.3 Bargaining Power of Suppliers
- 4.7.4 Threat of Substitutes
- 4.7.5 Competitive Rivalry
- 4.8 Assesment of Macroeconomic Factors on the market
5 MARKET SIZE AND GROWTH FORECASTS (VALUE)
- 5.1 By Service Model
- 5.1.1 IaaS
- 5.1.2 PaaS
- 5.1.3 SaaS
- 5.2 By Deployment Model
- 5.2.1 Public Cloud
- 5.2.2 Private Cloud
- 5.2.3 Hybrid Cloud
- 5.3 By End-user Vertical
- 5.3.1 IT and Telecom
- 5.3.2 BFSI
- 5.3.3 Manufacturing
- 5.3.4 Retail and Consumer Goods
- 5.3.5 Healthcare and Life Sciences
- 5.3.6 Others
- 5.4 By Organisation Size
- 5.4.1 Large Enterprises
- 5.4.2 Small and Mid-Sized Enterprises (SMEs)
- 5.5 By Geography
- 5.5.1 North America
- 5.5.1.1 United States
- 5.5.1.2 Canada
- 5.5.1.3 Mexico
- 5.5.2 South America
- 5.5.2.1 Brazil
- 5.5.2.2 Argentina
- 5.5.2.3 Rest of South America
- 5.5.3 Europe
- 5.5.3.1 Germany
- 5.5.3.2 United Kingdom
- 5.5.3.3 France
- 5.5.3.4 Italy
- 5.5.3.5 Spain
- 5.5.3.6 Rest of Europe
- 5.5.4 Asia-Pacific
- 5.5.4.1 China
- 5.5.4.2 Japan
- 5.5.4.3 India
- 5.5.4.4 South Korea
- 5.5.4.5 Southeast Asia
- 5.5.4.6 Rest of Asia-Pacific
- 5.5.5 Middle East and Africa
- 5.5.5.1 Middle East
- 5.5.5.1.1 Saudi Arabia
- 5.5.5.1.2 United Arab Emirates
- 5.5.5.1.3 Turkey
- 5.5.5.1.4 Rest of Middle East
- 5.5.5.2 Africa
- 5.5.5.2.1 South Africa
- 5.5.5.2.2 Nigeria
- 5.5.5.2.3 Egypt
- 5.5.5.2.4 Rest of Africa
- 5.5.5.2.5 Egypt
- 5.5.5.2.6 Rest of Africa
- 5.5.5.1 Middle East
- 5.5.1 North America
6 COMPETITIVE LANDSCAPE
- 6.1 Market Concentration
- 6.2 Strategic Moves
- 6.3 Market Share Analysis
- 6.4 Company Profiles (includes Global level Overview, Market level overview, Core Segments, Financials as available, Strategic Information, Market Rank/Share for key companies, Products and Services, and Recent Developments)
- 6.4.1 Amazon (AWS)
- 6.4.2 Microsoft
- 6.4.3 Google Cloud
- 6.4.4 Alibaba Cloud
- 6.4.5 IBM
- 6.4.6 Oracle
- 6.4.7 Salesforce
- 6.4.8 SAP SE
- 6.4.9 Adobe
- 6.4.10 Tencent Cloud
- 6.4.11 Huawei Cloud
- 6.4.12 Rackspace
- 6.4.13 VMware
- 6.4.14 Snowflake
- 6.4.15 Workday
- 6.4.16 ServiceNow
- 6.4.17 DigitalOcean
- 6.4.18 OVHcloud
- 6.4.19 Linode
- 6.4.20 Nutanix
7 MARKET OPPORTUNITIES AND FUTURE OUTLOOK
- 7.1 White-space and Unmet-Need Assessment
 AIGC云端运算平台市场:依内容模式、部署模式、企业规模、应用程式和最终用户划分-2026-2032年全球预测云端办公软体市场按元件类型、组织规模、垂直产业、应用类型和部署模式划分-全球预测,2026-2032年
 中东和非洲 (MEA) 云端运算市场分析及预测(至 2035 年):按类型、产品、服务、技术、组件、应用、部署、最终用户和解决方案划分云端运算市场分析及预测(至2035年):按类型、产品类型、服务、技术、组件、应用、部署类型、最终用户、解决方案和模式划分
 云端运算全球市场规模、份额、趋势和成长分析报告(2026-2034年)
 云端办公服务市场 - 全球产业规模、份额、趋势、机会及预测(按组件、组织规模、产业、地区和竞争格局划分,2021-2031年)多重云端运算市场 - 全球产业规模、份额、趋势、机会及预测(按解决方案、企业规模、最终用途、地区和竞争格局划分,2021-2031 年)联邦边缘运算市场 - 全球产业规模、份额、趋势、机会、预测:按部署类型、组件、最终用户、地区和竞争格局划分,2021-2031 年
 2026-2030年全球政府部门云端运算市场2026-2031年全球云端运算市场预测