


 |
市场调查报告书
商品编码
1934905
资料中心线缆:市场占有率分析、产业趋势与统计、成长预测(2026-2031)Data Center Wire And Cable - Market Share Analysis, Industry Trends & Statistics, Growth Forecasts (2026 - 2031) |
||||||
※ 本网页内容可能与最新版本有所差异。详细情况请与我们联繫。
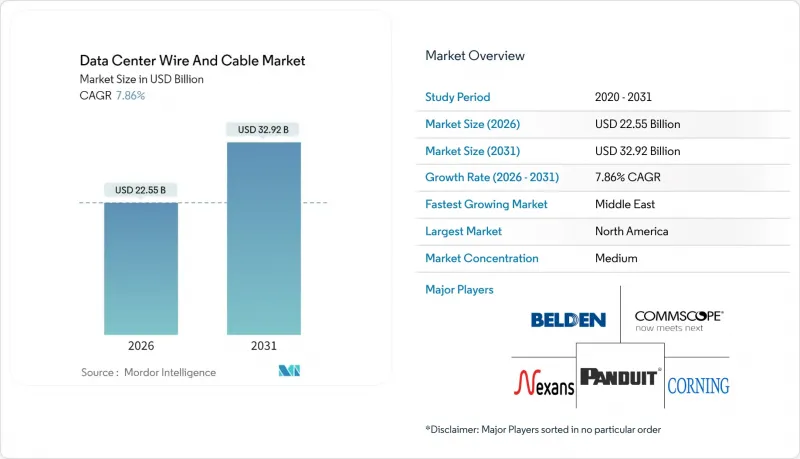
资料中心线缆市场预计将从 2025 年的 209.1 亿美元成长到 2026 年的 225.5 亿美元,预计到 2031 年将达到 329.2 亿美元,2026 年至 2031 年的复合年增长率为 7.86%。
超大规模资料中心的持续建置、向400G和800G光连接模组的快速转型,以及人工智慧和高效能运算(HPC)工作负载的激增需求,是推动成长的核心动力。新建设采用的结构化布线布局密度是传统以CPU为中心的机房的五倍,光纤在机架内和机架间链路中的消耗量已超过铜缆。受5G和对延迟敏感的应用推动,边缘资料中心和微型资料中心的部署,为环境友善和耐热线设计创造了新的应用场景。诸如「建造美国,购买美国货」法案等政策奖励正在推动国内光纤投资,而欧洲的永续性法规则推动了低损耗和可回收材料的采购。商品价格波动仍是关注的焦点,预计到2024年铜价将达到每磅5.20美元,将使线缆成本上涨高达35%。
全球数据中心线市场趋势与洞察
全球资料中心稳步扩张
超大规模云端营运商宣布将于2025年在美国、印度和印尼建造一系列千兆瓦级园区,每个园区都需要数百万个光纤终端。平均机架功率密度将从2022年的15千瓦提升至新建人工智慧机房的40千瓦,每个机架的水平电缆长度也随之翻倍。这促使安装商透过增加电缆配线架容量和采用预端接主干线束来缩短安装週期。儘管新加坡和马来西亚的地方政府对新建资料中心许可证的数量设定了上限,但柔佛新山和凤凰城等区域性城市的新计画正在抵消这一影响。能够保证快速交付多模光纤组件的供应商正在赢得与超大规模资料中心业者签订的多年期供货合约。
人工智慧/高效能运算工作负载的快速成长需要超低延迟链路
基于数万个GPU的训练丛集,每台伺服器所需的跳线数量是CPU机架的四到五倍,这使得材料清单清单转向高密度MPO-MPO主干网路。乙太网路正在大规模AI架构中取代InfiniBand,推动了400G和800G短距离光学模组的广泛应用,这些模组符合叶脊式架构模型。康宁的Contour Flow光缆在与传统144芯光纤束相同的外径下可容纳288根光纤,从而将布线拥塞减少了一半。 GPU节点间5微秒的低延迟需求迫使营运商尽可能减少连接点,从而推动了工厂端接解决方案的需求,并刺激了对精密抛光MT连接器的需求。
高密度束的温度控管挑战
电缆桥架内部的气流限制会提高进气温度,每升高1°C,DWDM链路裕量就会降低0.08 dB。液冷歧管会占用电缆配线架的空间,迫使设计人员重新布线,采用更小的弯曲半径,增加微弯损耗的风险。供应商正在推出耐温85°C的无凝胶电缆,并引入扁平包装的主干线缆,其面积比圆形设计减少了30%。营运商正在尝试使用耐热拉片,以便在温度高达55°C的通道中方便连接,但频繁重新端接带来的高昂营运成本仍需要纳入预算。
细分市场分析
预计到2025年,光纤将占资料中心线缆市场59.30%的份额,到2031年将以8.12%的复合年增长率成长,并在几乎所有指标上超越铜缆。到2031年,光纤电缆的资料中心市场规模预计将达到198亿美元,这表明光纤电缆对于升级到400G、800G以及即将到来的1.6T技术至关重要。铜缆数据线在10G以下和低延迟旁路区域仍然有用,但不断增加的热负载和电磁干扰(EMI)问题限制了其传输距离。电力电缆虽然尺寸较小,但随着机架功率超过90kW以及设施采用415V配电,仍至关重要。
技术创新正致力于提高光纤密度。康宁的SMF-28 Contour光纤连接器可将288根光纤装入传统的144芯光纤外壳中,使设计人员的弯曲半径放宽40%。在短距离、低电流应用中,铜包铝光纤逐渐成为替代方案,以抵销金属价格波动的影响。供应商也正在推出采用生物基护套的光纤组件,以符合欧洲环境法规。将电缆、连接器和收发器整合到一起进行协同设计,推动了供应商之间的差异化竞争,并促成了长期主服务协议的建立。
超大规模资料中心将占据资料中心线材市场最大份额,到2025年将占总营收的48.60%。然而,边缘和微节点部署将以8.78%的复合年增长率推动市场成长,预计到2031年,这些部署的资料中心线线市场规模将达到65.5亿美元。位于俄亥俄州、维吉尼亚和北方邦的千兆级资料中心需要数千公里的单模光纤来互连GPU模组。另一方面,预製微型EDC(µEDC)虽然可以缩短布线距离,但需要坚固的护套和IP防护等级的连接器,因此价格更高。
法兰克福和阿什本的託管服务供应商正持续升级其结构化布线系统,以吸引人工智慧租户,而许多传统企业设施则选择云端卸载而非昂贵的维修。供应商正在优化产品规格,在超大规模资料中心内部布线时采用抗弯多模光纤,在走道机柜中使用铠装鬆套管。随着5G独立组网核心网路的普及,微型站点也开始部署乙太网路供电(PoE)技术用于无线终端,这略微增加了对铜缆的需求。集中式和分散式投资的平衡将决定供应商如何分配研发资金。
区域分析
2025年,北美引领资料中心线缆市场,这主要得益于超过340亿美元的超大规模投资以及联邦政府强制要求公共资助的宽频计画使用国产光纤的政策。康宁、康普和AFL三家公司已承诺总合超过5亿美元用于新增产能,从而降低对进口的依赖并缩短计划前置作业时间。加拿大魁北克省的寒冷气候和可再生能源优势正吸引许多託管设施落脚于此。在墨西哥,近岸外包正在振兴克雷塔罗的Tier III级资料中心,这些资料中心现在需要熟悉美国标准的双语安装人员。
亚太地区将在2031年前实现最高的区域复合年增长率,这主要得益于印度的资料主权法规和中国云端运算服务的扩张。新加坡的建设禁令鼓励业者向柔佛州和巴淡岛扩张,重振了跨境光纤走廊。澳洲在其西海岸完成了一条新的海底光缆登陆,连接珀斯、Muscat和蒙巴萨。同时,日本和韩国在1.6T乙太网路的研发方面主导,刺激了国内对原型干线光缆的需求。
欧洲市场保持稳定,但监管严格,EN 50575 和 CPR 法规要求永久安装在建筑物内的电缆必须带有 CE 标誌和防火等级认证。德国、荷兰和北欧国家正在竞相开发可再生能源和建造稳定的电网,并积极推广永续性的电缆规格。中东和非洲地区虽然规模较小,但正经历两位数的成长,阿联酋、沙乌地阿拉伯和肯亚等国吸引了许多国际云端营运商。儘管政治风险溢价依然存在,但环绕非洲大陆的海底光缆计划确保了对超长距离光纤的长期需求。
其他福利:
- Excel格式的市场预测(ME)表
- 3个月的分析师支持
目录
第一章 引言
- 研究假设和市场定义
- 调查范围
第二章调查方法
第三章执行摘要
第四章 市场情势
- 市场概览
- 市场驱动因素
- 全球资料中心稳步扩张
- 人工智慧/高效能运算工作负载的快速成长需要超低延迟链路
- 400G/800G光连接模组的快速普及
- 边缘和微型资料中心的兴起
- 低损耗可回收电缆的永续性要求
- 政府对国内光纤和电力电缆生产的激励措施
- 市场限制
- 高密度束的温度控管挑战
- 现有设施的高速电缆维修
- 铜铝原料价格波动;
- 先进光纤端接工艺技术纯熟劳工短缺
- 价值/供应链分析
- 监管环境
- 技术展望
- 波特五力模型
- 新进入者的威胁
- 供应商的议价能力
- 买方的议价能力
- 替代品的威胁
- 竞争对手之间的竞争
- 定价分析
- 投资分析
5. 全球资料中心建设活动分析
- 未来资料中心建设热点地区(计画中的IT负载成长)
- 超大规模资料中心的成长
- 区域资料中心建置趋势 - 供应商概况
第六章 市场规模与成长预测
- 按电缆类型
- 光纤电缆
- 铜质数据线(双绞线)
- 电源线
- 电压类型
- 高压(HV)
- 中压(MV)
- 低压(LV)
- 材料类型
- 铜
- 铝
- 应用
- PDU 和 UPS 系统
- 暖通空调系统
- 网路及IT设备
- 其他的
- 电压类型
- 其他电缆(接地线、感测器线、控制线)
- 依资料中心类型
- 企业/边缘/微型
- 搭配
- 超大规模
- 透过使用
- 结构化布线
- 配电
- 暖通空调和楼宇系统
- 监控与控制
- 高速互连(100G以上)
- 透过索结构
- 盾
- 无防护
- 盔甲
- 普伦姆评级
- 按部署环境
- 室内(閒置频段)
- 户外植物
- 海底与设施之间
- 按地区
- 北美洲
- 我们
- 加拿大
- 墨西哥
- 南美洲
- 巴西
- 阿根廷
- 南美洲其他地区
- 欧洲
- 德国
- 英国
- 法国
- 北欧地区
- 俄罗斯
- 其他欧洲
- 亚太地区
- 中国
- 印度
- 日本
- 韩国
- 东南亚
- 亚太其他地区
- 中东
- 阿拉伯聯合大公国
- 沙乌地阿拉伯
- 土耳其
- 其他中东地区
- 非洲
- 南非
- 奈及利亚
- 其他非洲地区
- 北美洲
第七章 竞争情势
- 市占率分析
- 公司简介
- Nexans SA
- Belden Inc.
- Panduit Corp.
- CommScope Holding Co. Inc.
- Corning Inc.
- TE Connectivity plc
- Yangtze Optical Fibre and Cable(YOFC)
- Legrand Group
- Southwire Company LLC
- Furukawa Electric Co. Ltd.
- Prysmian Group
- Sumitomo Electric Industries Ltd.
- LS Cable and System
- Superior Essex Inc.
- AFL Global
- Rosenberger Hochfrequenztechnik GmbH
- Hexatronic Group AB
- HUBER+SUHNER AG
- Fujikura Ltd.
- Datwyler IT Infra
- Ciena Corporation
- Tratos Cavi SpA
第八章:市场机会与未来展望
- 评估差距和未满足的需求
The Data Center Wire and Cable market is expected to grow from USD 20.91 billion in 2025 to USD 22.55 billion in 2026 and is forecast to reach USD 32.92 billion by 2031 at 7.86% CAGR over 2026-2031.
Continued hyperscale construction, rapid migration to 400 G and 800 G optical interconnects, and surging demand from AI and high-performance computing (HPC) workloads are the core growth engines. New-build facilities now specify structured cabling footprints up to five times denser than legacy CPU-centric halls, pushing optical-fiber consumption ahead of copper for intra-rack and inter-rack links. Edge and micro-data-center roll-outs, accelerated by 5G and latency-sensitive applications, are creating fresh use cases for ruggedized, temperature-hardened cable designs. Policy incentives such as the Build America Buy America Act are spurring domestic fiber investments, while sustainability mandates in Europe are steering purchasing toward low-loss and recyclable formulations. Commodity volatility remains a watch item; copper briefly touched USD 5.20 per pound in 2024 and lifted cable bills by as much as 35%.
Global Data Center Wire And Cable Market Trends and Insights
Robust Data-Center Expansion Worldwide
Hyperscale cloud operators announced multi-gigawatt campuses across the United States, India, and Indonesia in 2025, each demanding several million fiber terminations. Average rack densities rose from 15 kW in 2022 to 40 kW in new AI halls, doubling the horizontal cable runs per rack. Contractors, therefore, specify higher cable-tray capacities and pre-terminated trunk bundles to compress installation schedules. Regional governments in Singapore and Malaysia capped new data-center permits, yet green-field projects in secondary metros such as Johor Bahru and Phoenix offset the slowdown. Suppliers able to guarantee short lead times on multimodal assemblies are winning multi-year supply agreements with hyperscalers.
Surge in AI/HPC Workloads Requiring Ultra-Low-Latency Links
Training clusters built around tens of thousands of GPUs need four to five times more fiber jumpers per server than CPU racks, shifting bill-of-materials weighting toward high-density MPO-to-MPO trunks. Ethernet is overtaking InfiniBand for large-scale AI fabrics, prompting broad adoption of 400 G and 800 G short-reach optics that still fit the leaf-and-spine model. Corning's Contour Flow cable now ships with 288 fibers in the same outer diameter as earlier 144-fiber bundles, halving pathway congestion. Latency budgets of 5 µs between GPU nodes force operators to minimize splice points, favoring factory-terminated solutions and driving demand for precision-polished MT-based connectors.
Thermal-Management Challenges in High-Density Bundles
Airflow constriction inside cable ladders raises inlet temperatures, and each 1 °C rise cuts DWDM link margin by 0.08 dB. Liquid-cooling manifolds occupy space once used for cable trays, forcing designers to reroute bundles in tighter radii that risk micro-bending losses. Vendors counter with gel-free cables rated to 85 °C and introduce flat-pack trunk formats that occupy 30% less cross-section than round designs. Operators trial heat-resistant pull-tabs to ease port access inside 55 °C aisles but still budget higher OpEx for frequent re-termination.
Other drivers and restraints analyzed in the detailed report include:
- Rapid Adoption of 400 G/800 G Optical Interconnects
- Proliferation of Edge and Micro Data Centers
- Retrofitting Legacy Facilities with High-Speed Cabling
For complete list of drivers and restraints, kindly check the Table Of Contents.
Segment Analysis
Optical fiber captured 59.30% of the Data Center Wire and Cable market in 2025 and is forecast to grow at an 8.12% CAGR to 2031, outpacing copper on nearly every metric. The Data Center Wire and Cable market size for fiber cables is projected to reach USD 19.8 billion by 2031, reflecting its indispensability for 400 G, 800 G, and forthcoming 1.6 T upgrades. Copper data cables retain relevance below 10 G and in low-latency bypass zones, yet rising thermal loads and EMI concerns cap their lane length. Power cables, while volumetrically smaller, remain mission-critical as rack power climbs past 90 kW and facilities adopt 415 V distribution.
Innovation centers on density: Corning's SMF-28 Contour enables 288 fibers within earlier 144-fiber envelopes, giving designers 40% bend-radius relief. Copper-clad aluminum substitutes appear in short, low-ampacity applications to offset metal volatility. Vendors also release fiber-optic assemblies with bio-based jackets to meet European environmental regulations. The race to co-design cable, connector, and transceiver as a holistic channel differentiates suppliers and cements long-term master-service agreements.
Hyperscale facilities held 48.60% of 2025 revenue, equal to the largest share in the Data Center Wire and Cable market. Edge and micro nodes, however, lead growth at 8.78% CAGR, lifting the Data Center Wire and Cable market size for these deployments to USD 6.55 billion by 2031. Gigawatt-scale campuses in Ohio, Virginia, and Uttar Pradesh require thousands of kilometers of single-mode fiber to interconnect GPU pods. Conversely, prefabricated µEDCs consume shorter runs but demand ruggedized sheathing and IP-rated connectors that command premium pricing.
Colocation operators in Frankfurt and Ashburn keep refreshing structured cabling to court AI tenants, yet many legacy enterprise halls opt for cloud offload rather than expensive overhauls. Suppliers tailor SKUs: bend-insensitive multimode for hyperscale intra-build runs and armored loose-tube for sidewalk cabinets. As 5G standalone cores proliferate, micro sites also install power-over-ethernet for radio heads, subtly raising copper volumes. The balance between centralized and distributed spends will dictate the allocation of R&D funds across vendors.
The Data Center Wire and Cable Market is Segmented by Cable Type (Optical Fiber, Copper Data and More), Data Center Type (Enterprise, Colocation and More), Application (Structured Cabling, Power Distribution and More), Cable Construction(Shielded, Unshielded and More), Deployment Environment (Indoor White Space, Outdoor Plant and More), and Geography(North America, and More). Market Forecasts are Provided in Terms of Value (USD).
Geography Analysis
North America led the Data Center Wire and Cable market in 2025, driven by hyperscale investments exceeding USD 34 billion and reinforced by federal policies mandating domestic fiber for publicly funded broadband projects. Corning, CommScope, and AFL collectively pledged more than USD 500 million in new capacity, reducing import reliance and shortening project lead times. Canada benefits from colder climates and renewable energy, luring colocation builds in Quebec. Mexico's near-shoring wave fuels Tier III halls in Queretaro, which now require bilingual installation crews versed in U.S. standards.
Asia-Pacific delivers the highest regional CAGR through 2031, propelled by India's data-sovereignty rules and China's cloud service scale-up. Singapore's construction moratorium pushed operators to Johor and Batam, stimulating cross-border fiber corridors. Australia records new submarine landings on its western coast, linking Perth to Muscat and Mombasa. Meanwhile, Japan and South Korea spearhead 1.6 T Ethernet R&D, accelerating domestic demand for prototype trunk cables.
Europe remains steady but highly regulated; EN 50575 and CPR rules require CE marking and fire-class certification for any cable permanently installed in buildings. Germany, the Netherlands, and the Nordics compete on renewable energy availability and stable grids, fostering sustainability-driven cable specifications. Middle East and Africa, though smaller, post double-digit growth as UAE, Saudi Arabia, and Kenya entice international cloud incumbents. Subsea projects circling the African continent guarantee long-term pull for ultra-long-haul fiber, even as political risk premiums linger.
- Nexans S.A.
- Belden Inc.
- Panduit Corp.
- CommScope Holding Co. Inc.
- Corning Inc.
- TE Connectivity plc
- Yangtze Optical Fibre and Cable (YOFC)
- Legrand Group
- Southwire Company LLC
- Furukawa Electric Co. Ltd.
- Prysmian Group
- Sumitomo Electric Industries Ltd.
- LS Cable and System
- Superior Essex Inc.
- AFL Global
- Rosenberger Hochfrequenztechnik GmbH
- Hexatronic Group AB
- HUBER+SUHNER AG
- Fujikura Ltd.
- Datwyler IT Infra
- Ciena Corporation
- Tratos Cavi S.p.A.
Additional Benefits:
- The market estimate (ME) sheet in Excel format
- 3 months of analyst support
TABLE OF CONTENTS
1 INTRODUCTION
- 1.1 Study Assumptions and Market Definition
- 1.2 Scope of the Study
2 RESEARCH METHODOLOGY
3 EXECUTIVE SUMMARY
4 MARKET LANDSCAPE
- 4.1 Market Overview
- 4.2 Market Drivers
- 4.2.1 Robust data-center expansion worldwide
- 4.2.2 Surge in AI/HPC workloads requiring ultra-low-latency links
- 4.2.3 Rapid adoption of 400G/800G optical inter-connects
- 4.2.4 Proliferation of edge and micro data centers
- 4.2.5 Sustainability mandates for low-loss recyclable cabling
- 4.2.6 Government incentives for domestic fiber and power-cable production
- 4.3 Market Restraints
- 4.3.1 Thermal-management challenges in high-density bundles
- 4.3.2 Retrofitting legacy facilities with high-speed cabling
- 4.3.3 Volatility in copper and aluminum commodity prices
- 4.3.4 Skilled-labor shortage for advanced fiber termination
- 4.4 Value / Supply-Chain Analysis
- 4.5 Regulatory Landscape
- 4.6 Technological Outlook
- 4.7 Porter's Five Forces
- 4.7.1 Threat of New Entrants
- 4.7.2 Bargaining Power of Suppliers
- 4.7.3 Bargaining Power of Buyers
- 4.7.4 Threat of Substitutes
- 4.7.5 Competitive Rivalry
- 4.8 Pricing Analysis
- 4.9 Investment Analysis
5 ANALYSIS OF DATA CENTER CONSTRUCTION ACTIVITY WORLDWIDE
- 5.1 Upcoming Data Center Construction Hotspots (planned IT-load additions)
- 5.2 Growth of Hyperscale Data Centers
- 5.3 Regional DC Construction - Vendor Landscape
6 MARKET SIZE AND GROWTH FORECASTS (VALUE)
- 6.1 By Cable Type
- 6.1.1 Optical Fiber Cables
- 6.1.2 Copper Data Cables (Twisted Pair)
- 6.1.3 Power Cables
- 6.1.3.1 Voltage Type
- 6.1.3.1.1 High Voltage (HV)
- 6.1.3.1.2 Medium Voltage (MV)
- 6.1.3.1.3 Low Voltage (LV)
- 6.1.3.2 Material Type
- 6.1.3.2.1 Copper
- 6.1.3.2.2 Aluminum
- 6.1.3.3 Application
- 6.1.3.3.1 PDUs and UPS Systems
- 6.1.3.3.2 HVAC System
- 6.1.3.3.3 Networking and IT Equipment
- 6.1.3.3.4 Others
- 6.1.3.1 Voltage Type
- 6.1.4 Other Cables (Grounding, Sensor, Control)
- 6.2 By Data Center Type
- 6.2.1 Enterprise/ Edge / Micro
- 6.2.2 Colocation
- 6.2.3 Hyperscale
- 6.3 By Application
- 6.3.1 Structured Cabling
- 6.3.2 Power Distribution
- 6.3.3 HVAC and Building Systems
- 6.3.4 Monitoring and Control
- 6.3.5 High-Speed Interconnects (>100 G)
- 6.4 By Cable Construction
- 6.4.1 Shielded
- 6.4.2 Unshielded
- 6.4.3 Armored
- 6.4.4 Plenum-Rated
- 6.5 By Deployment Environment
- 6.5.1 Indoor (White Space)
- 6.5.2 Outdoor Plant
- 6.5.3 Sub-sea / Inter-facility
- 6.6 By Geography
- 6.6.1 North America
- 6.6.1.1 United States
- 6.6.1.2 Canada
- 6.6.1.3 Mexico
- 6.6.2 South America
- 6.6.2.1 Brazil
- 6.6.2.2 Argentina
- 6.6.2.3 Rest of South America
- 6.6.3 Europe
- 6.6.3.1 Germany
- 6.6.3.2 United Kingdom
- 6.6.3.3 France
- 6.6.3.4 Nordic Region
- 6.6.3.5 Russia
- 6.6.3.6 Rest of Europe
- 6.6.4 Asia-Pacific
- 6.6.4.1 China
- 6.6.4.2 India
- 6.6.4.3 Japan
- 6.6.4.4 South Korea
- 6.6.4.5 Southeast Asia
- 6.6.4.6 Rest of Asia-Pacific
- 6.6.5 Middle East
- 6.6.5.1 UAE
- 6.6.5.2 Saudi Arabia
- 6.6.5.3 Turkey
- 6.6.5.4 Rest of Middle East
- 6.6.6 Africa
- 6.6.6.1 South Africa
- 6.6.6.2 Nigeria
- 6.6.6.3 Rest of Africa
- 6.6.1 North America
7 COMPETITIVE LANDSCAPE
- 7.1 Market Share Analysis
- 7.2 Company Profiles (includes Global level Overview, Market level overview, Core Segments, Financials as available, Strategic Information, Market Rank/Share for key companies, Products and Services, and Recent Developments)
- 7.2.1 Nexans S.A.
- 7.2.2 Belden Inc.
- 7.2.3 Panduit Corp.
- 7.2.4 CommScope Holding Co. Inc.
- 7.2.5 Corning Inc.
- 7.2.6 TE Connectivity plc
- 7.2.7 Yangtze Optical Fibre and Cable (YOFC)
- 7.2.8 Legrand Group
- 7.2.9 Southwire Company LLC
- 7.2.10 Furukawa Electric Co. Ltd.
- 7.2.11 Prysmian Group
- 7.2.12 Sumitomo Electric Industries Ltd.
- 7.2.13 LS Cable and System
- 7.2.14 Superior Essex Inc.
- 7.2.15 AFL Global
- 7.2.16 Rosenberger Hochfrequenztechnik GmbH
- 7.2.17 Hexatronic Group AB
- 7.2.18 HUBER+SUHNER AG
- 7.2.19 Fujikura Ltd.
- 7.2.20 Datwyler IT Infra
- 7.2.21 Ciena Corporation
- 7.2.22 Tratos Cavi S.p.A.
8 MARKET OPPORTUNITIES AND FUTURE OUTLOOK
- 8.1 White-Space and Unmet-Need Assessment
 NeoCloud 资料中心NeoCloud 资料中心:市场资料概览(2026 年第二季)
 2026年全球人工智慧(AI)资料中心网路市场报告
 资料中心网路市场:2026-2032年全球市场预测(依产品类型、部署模式、连接埠速度、应用程式和最终用户划分)自癒网路市场:按组件、部署类型、组织规模、应用程式和最终用户划分-2026年至2032年全球市场预测2026年全球自癒网路市场报告2026年全球云端资料中心市场报告
 资料中心网路市场分析及预测(至2035年):依类型、产品类型、服务、技术、元件、应用、部署模式、最终使用者及解决方案划分
 全球资料中心线市场:市场规模、份额和趋势分析(按线缆类型、资料中心类型、应用、部署方式和地区划分),细分市场预测(2026-2033 年)
 全球资料中心网路市场:按产品、网路基础设施、软体、服务、工作负载类型、资料中心规模和容量、最终用户和地区划分-预测至2031年