


 |
市场调查报告书
商品编码
1934916
资料中心託管:市场占有率分析、产业趋势与统计、成长预测(2026-2031)Data Center Colocation - Market Share Analysis, Industry Trends & Statistics, Growth Forecasts (2026 - 2031) |
||||||
※ 本网页内容可能与最新版本有所差异。详细情况请与我们联繫。
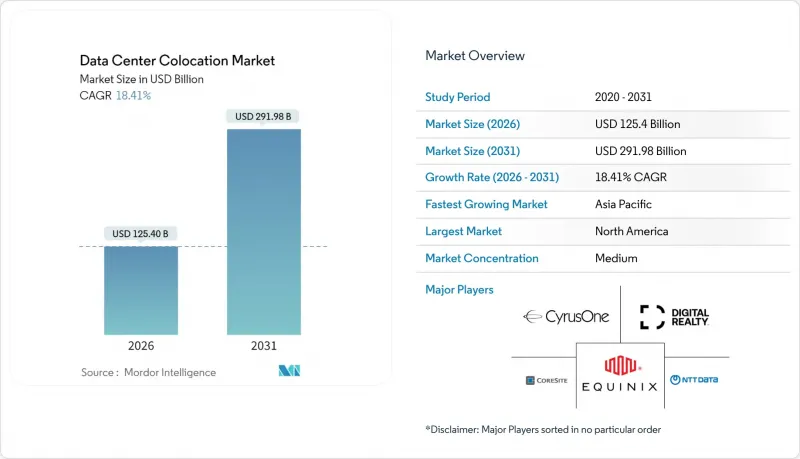
预计到 2025 年,资料中心託管市场规模将达到 1059.1 亿美元,预计在预测期(2026-2031 年)内将以 18.41% 的复合年增长率增长,从 2026 年的 1254 亿美元增长到 2031 年的 2919.8 亿美元。
推动市场需求的因素包括:国家人工智慧指令要求提供可靠、中立的资料中心容量;边缘运算的普及需要分散式架构;以及40kW以上机架密度的液冷机房的主流化应用。随着企业自有设施向服务型模式的转变加速,能够提供云端连接生态系统、快速部署选项和节能设计的中立服务供应商将继续保持优势。私募股权所有权是市场中的一股决定性力量,即使在高利率环境下,也能帮助营运商快速为大型园区计划资金筹措。资料中心託管市场如今已涵盖所有主要产业,能够将高密度人工智慧基础设施与合规环境结合的服务供应商最能掌握不断增长的市场需求。
全球资料中心託管市场趋势与洞察
云端和SaaS工作负载整合持续成长
随着混合IT架构主导企业发展蓝图的製定,企业正被迫将对延迟敏感的工作负载託管在距离主要公共云端仅一个互连端口的託管资料中心。平均15-20个直连云平台的连接埠正成为一项基本要求,这使得租户能够降低资料传输成本,并简化多重云端部署中的合规流程。互连服务已占市场领导总收入的18%,因为客户愿意为即插即用的云端接近性连线支付20-30%的溢价。
物联网/人工智慧和边缘工作负载带来的资料爆炸
生成式人工智慧训练丛集通常每个机架消耗 40-80kW 的电力消耗量,这对于传统的风冷机房来说是难以承受的。为了解决这个问题,营运商正在安装液冷歧管和浸没式冷却槽来支援 GPU钻机,这些设备的功耗是传统机架的三到五倍。并行边缘部署方案是将微节点部署在工厂、体育场和电信塔附近,并透过暗纤环将流量聚合到中心託管站点。这种轴辐式拓扑结构使企业能够在保持集中控制的同时进行即时分析。
高利率环境下,初始建设成本增加。
2024年,受钢材、开关设备和燃料价格上涨的影响,美国毛坯建筑的平均成本上涨至每平方英尺468.66美元,而这些价格上涨又与融资成本密切相关。开发商正透过预製模组、资产证券化和高品质的租户租赁协议来缓解成本上涨的影响,但审批积压仍意味着工期长达18至24个月。这使得财务实力成为一项日益重要的竞争优势,精明的买家会在竞争对手获得规划核准之前就获得建设资金。
细分市场分析
到2025年,零售型资料中心将占据资料中心託管市场52.18%的份额,主要得益于企业对充足交叉连接和便利承包服务的偏好。同时,针对超大规模资料中心业者的单一租户批发服务虽然面积大规模,但随着超大规模资料中心业者不断提升其内部建置能力,利润率将面临压缩。模组化/边缘运算单元细分市场正以18.74%的复合年增长率成长,成为业界成长最快的营收细分市场,凸显了资料中心向接近性运算模式的转变。像Digital Realty这样的供应商正在传统园区中增设工厂预製模组,将标准化设计与快速部署相结合,以满足服务不足的大都会圈。这些混合型资料中心为营运商提供了更大的资金灵活性,使其能够根据工作负载特性调整密度,并满足以往依赖本地机房的新需求。
专注于维持零售市场份额的营运商正在将託管网路架构、合规认证和人工智慧赋能的机房捆绑销售,模糊了零售和批发之间的传统界限。合约越来越多地采用类似云端的计量收费模式,吸引了寻求可预测成本调整的云端原生Start-Ups。随着企业在超大规模云端和边缘资料中心之间迁移工作负载,资料中心託管市场实际上正在从核心到边缘形成一个连续的整体,而不是一个独立的设施类别。能够协调这项连续体容量规划的供应商可望提高交叉销售收入并降低客户流失率。
到2025年,Tier III级资料中心将占託管市场55.26%的份额,因为它们能够为大多数企业工作负载提供冗余性和成本效益之间的平衡。然而,金融交易、人工智慧训练和生命安全等应用需要Tier IV级资料中心99.995%的运转率,预计到2031年,该等级资料中心的复合年增长率将达到18.25%。架构转型包括三模UPS配置、2N+1冷却拓朴结构以及预测性维护分析,以防患于未然。超大规模租户通常会签订长期租赁合同,以证明其高资本投入的合理性,从而提高营运商的盈利。
金融和医疗保健行业的监管机构目前已将运转率标准纳入其许可要求,有效地将Tier III标准锁定为最低可接受标准,同时透过缩短供应商核准週期为Tier IV标准提供优先待遇。合规带来的增值使营运商能够获得更长的合约期限和更高的每平方英尺经常性收入。随着人工智慧工作负载从研发阶段过渡到生产阶段,预计Tier IV标准的应用范围将超越高效能细分市场,并支援资料中心託管市场份额的稳定成长。
区域分析
北美地区在2025年仍将维持39.88%的需求份额,并继续成为最大的收入贡献者,这主要得益于数十年来暗纤的部署、密集的互联网交换基础设施以及支撑云端运算GDP的成熟超大规模资料中心。然而,北维吉尼亚和硅谷的电力开发禁令正将新的需求推向凤凰城、哥伦布和蒙特利尔,这些地区的公共产业仍可在24个月内核准100兆瓦的电力项目。在这些二线枢纽城市,地方政府正透过税收减免和简化审批流程来吸引开发商,从而缓解传统大都会地区面临的土地短缺问题。
亚太地区是成长最快的地区,预计到2031年将维持24.95%的复合年增长率。中国大力推动数位公共基础设施建设、印度积极采用商业云端服务以及日本严格的数据居住改革,都推动了该地区兆瓦级订单的订单。新加坡重新实施建设配额制度,也带动了柔佛和巴淡岛的电力需求。同时,澳洲、印尼和菲律宾迎来了首批超大规模投资,使该地区有望在2031年超越其他任何大洲。
欧洲-南美-中东-非洲走廊构成了第三个成长层级。随着阿姆斯特丹实施更严格的能源效率标准,法兰克福、都柏林和马德里正在应对非洲大陆的过剩需求。圣保罗正崛起为南半球枢纽,而利雅德则利用国家资本建设一条符合其「2030愿景」目标的全新数位走廊。在整个区域内,可再生能源的可用性和高效的电网互联正在成为决定位置的重要因素,风能资源丰富的巴塔哥尼亚和太阳能资源丰富的阿联酋出人意料地成为下一轮建设热潮的理想候选地。
其他福利:
- Excel格式的市场预测(ME)表
- 3个月的分析师支持
目录
第一章 引言
- 研究假设和市场定义
- 调查范围
第二章调查方法
第三章执行摘要
第四章 市场情势
- 市场概览
- 市场驱动因素
- 云端和SaaS工作负载整合正在兴起
- 物联网/人工智慧和边缘工作负载带来的资料爆炸
- 更严格的资料主权法规推动了国内资料中心託管需求。
- 基于小型模组化反应器(SMR)的现场核能发电在大型校园中的兴起
- 对于人工智慧驱动的工作负载密度,您需要一个液冷式託管机房。
- 国家主导的人工智慧倡议需要值得信赖的第三方能力
- 市场限制
- 高利率环境下,初始建设成本不断上涨
- 主要大都市地区长期有电网和土地短缺问题
- 碳排放税逐步增加导致营运成本的不确定性加剧。
- 与气候风险相关的保险费上涨
- 供应链分析
- 监管环境
- 技术展望
- 波特五力模型
- 供应商的议价能力
- 买方的议价能力
- 新进入者的威胁
- 替代品的威胁
- 竞争对手之间的竞争
- 对影响市场的宏观经济因素进行评估
第五章 市场规模与成长预测
- 按託管类型
- 零售
- 批发的
- 层级标准
- 一级和二级
- Tier III
- 四级
- 按资料中心规模
- 小规模
- 中号
- 大规模
- 巨大的
- 百万
- 按最终用户行业划分
- BFSI
- 资讯科技/通讯
- 电子商务与零售
- 政府/国防
- 製造和工业IoT
- 媒体与娱乐
- 医疗保健和生命科学
- 能源与公共产业
- 按地区
- 北美洲
- 我们
- 加拿大
- 墨西哥
- 南美洲
- 巴西
- 阿根廷
- 南美洲其他地区
- 欧洲
- 英国
- 德国
- 法国
- 义大利
- 西班牙
- 俄罗斯
- 其他欧洲
- 亚太地区
- 中国
- 日本
- 印度
- 韩国
- 澳洲和纽西兰
- 亚太其他地区
- 中东和非洲
- 中东
- 沙乌地阿拉伯
- 阿拉伯聯合大公国
- 土耳其
- 其他中东地区
- 非洲
- 南非
- 奈及利亚
- 肯亚
- 其他非洲地区
- 中东
- 北美洲
第六章 竞争情势
- 市占率分析
- 公司简介
- Equinix Inc.
- Digital Realty Trust Inc.
- NTT Global Data Centers
- CyrusOne Inc.
- CoreSite Realty Corp.
- Cyxtera Technologies Inc.
- Iron Mountain Data Centers
- KDDI(telehouse)
- Flexential Corp.
- Rackspace Technology Inc.
- Vantage Data Centers
- QTS Data Centers(Blackstone)
- Switch Inc.
- EdgeConneX
- Stack Infrastructure
- Aligned Data Centers
- Global Switch
- Telefonica Tech
- China Telecom Global
- Scala Data Centers
- Teraco Data Environments
- Keppel DC REIT
第七章 市场机会与未来展望
The data center colocation market was valued at USD 105.91 billion in 2025 and estimated to grow from USD 125.4 billion in 2026 to reach USD 291.98 billion by 2031, at a CAGR of 18.41% during the forecast period (2026-2031).
Demand is fueled by sovereign-AI mandates that require trusted neutral capacity, edge computing deployments that need distributed footprints, and the mainstreaming of liquid-cool-ready suites for rack densities above 40 kW. The accelerating shift from enterprise-owned facilities toward service-based models continues to favor neutral providers that offer cloud-on-ramp ecosystems, rapid deployment options, and energy-efficient designs. Private-equity ownership has become a defining force, allowing operators to finance mega-campus projects quickly even as interest rates remain elevated. The data center colocation market now spans every major industry vertical, and providers able to combine high-density AI infrastructure with compliance-ready environments are best positioned to capture incremental demand.
Global Data Center Colocation Market Trends and Insights
Increasing Integration of Cloud and SaaS Workloads
Hybrid-IT architectures now dominate enterprise roadmaps, pushing organizations to house latency-sensitive workloads in colocation facilities that sit one cross-connect away from major public clouds. Direct-connect ports to an average of 15-20 cloud platforms are becoming table stakes, enabling tenants to shrink egress fees and simplify regulatory compliance for multi-cloud deployments.Interconnection services already contribute 18% of total revenue for market leaders as customers accept 20-30% price premiums for plug-and-play cloud proximity.
Proliferation of Data from IoT/AI and Edge Workloads
Generative-AI training clusters routinely draw 40-80 kW per rack, a power envelope unsustainable in legacy air-cooled halls. Operators are therefore fitting liquid manifolds and immersion tanks to support GPU rigs that devour 3-5 times the electricity of traditional racks. Parallel edge rollouts place micro-nodes near factories, stadia and telco towers, all funneling traffic back to hub colocation sites via dark-fiber rings. This hub-and-spoke topology lets enterprises run real-time analytics while maintaining centralized governance.
High Up-Front Build Cost Amid Elevated Interest Rates
Average U.S. shell-and-core outlays climbed to USD 468.66 per sq ft in 2024 as steel, switchgear and fuel prices rose in tandem with financing costs. Developers are mitigating sticker shock through prefabricated modules, asset-backed securitizations and credit-tenant leases, but permitting queues still stretch delivery cycles to 18-24 months. Balance-sheet strength is therefore becoming a competitive advantage as nimble buyers pre-fund capacity before rivals even secure zoning approval.
Other drivers and restraints analyzed in the detailed report include:
- Stricter Data-Sovereignty Laws Boosting In-Country Demand
- AI-Driven Workload Density Requiring Liquid-Cool-Ready Suites
- Chronic Grid-Power and Land Shortages in Tier-1 Metros
For complete list of drivers and restraints, kindly check the Table Of Contents.
Segment Analysis
Retail facilities commanded 52.18% of data center colocation market share in 2025, largely because enterprises value the convenience of cross-connect-rich ecosystems and turnkey services. Wholesale offerings targeting single-tenant hyperscalers supply larger footprints but face margin compression as hyperscalers develop self-build capabilities. The modular/edge-pod subsegment, growing at a 18.74% CAGR, represents the industry's fastest-rising revenue stream and highlights the pivot toward proximity-driven compute. Providers such as Digital Realty have added factory-built modules to traditional campuses, combining standardized design with rapid deployment for under-served metros. These hybrid estates enable operators to allocate capital more flexibly, match density tiers to workload profiles, and capture new demand nodes that previously defaulted to on-premises closets.
Operators keen to defend retail share now bundle managed-network fabrics, compliance attestations, and AI-ready cages, blurring historical boundaries between retail and wholesale. Contracts increasingly feature consumption-based pricing models similar to cloud, attracting cloud-native startups seeking predictable cost alignment. As enterprises shuffle workloads between hyperscale clouds and edge pods, the data center colocation market is effectively segmenting into core-edge continuums rather than distinct facility classes. Providers that orchestrate capacity-planning across this continuum stand to expand cross-sell revenue and reduce churn.
Tier III facilities held 55.26% of the data center colocation market size in 2025 because they balance redundancy with cost efficiency for most enterprise workloads. Financial trading, AI training, and life-safety applications, however, require the 99.995% uptime of Tier IV, driving an 18.25% CAGR forecast for that class through 2031. The architectural shift includes tri-mode UPS configurations, 2N+1 cooling topologies, and predictive-maintenance analytics that pre-empt failures. Hyperscale tenants often sign anchor leases that justify the higher capital intensity, improving the return profile for operators.
Regulators in finance and healthcare now incorporate uptime standards into licensing, effectively hard-coding Tier III as the minimum acceptable standard while rewarding Tier IV with accelerated vendor-approval cycles. This compliance halo inflates perceived value, allowing operators to secure longer contract terms and higher recurring revenue per square foot. As more AI workloads transition from R&D to production, expect Tier IV adoption to expand beyond its high-performance niche, underpinning steady share gains in the data center colocation market.
Data Center Colocation Market Report is Segmented by Colocation Type (Retail, Wholesale), Tier Standard (Tier I and II, Tier III, Tier IV), Data Center Size (Small, Medium and More), End-User Industry (BFSI, IT and Telecom, E-Commerce and Retail, Government and Defense, and More), and by Geography(North America and Europe and More). The Market Forecasts are Provided in Terms of Value (USD).
Geography Analysis
North America retained 39.88% demand in 2025, North America remains the largest revenue contributor thanks to decades of dark-fiber build-out, dense internet-exchange fabrics, and a mature hyperscale footprint that underpins cloud GDP. Power moratoriums in Northern Virginia and Silicon Valley, however, are steering new demand to Phoenix, Columbus, and Montreal, where utilities can still green-light 100 MW blocks inside 24 months. Local governments in these secondary hubs court developers with tax holidays and expedited permitting, tempering the land-scarcity issues dogging legacy metros.
Asia-Pacific is the fastest mover, Asia-Pacific is forecast to post a 24.95% CAGR through 2031. China's digital-public-infrastructure drive, India's commerce-cloud adoption, and Japan's stringent data-residency amendments are all piling megawatt orders into regional pipelines. Singapore has reinstated a constrained build quota, funneling spill-over demand to Johor and Batam. Meanwhile, Australia, Indonesia and the Philippines are receiving first-time hyperscale commitments, positioning the bloc to outpace every other continent in incremental capacity through 2031.
Europe, South America and the Middle East-Africa corridor form the third growth tier. Frankfurt, Dublin and Madrid handle continental overflow as Amsterdam imposes stricter energy-efficiency hurdles. Sao Paulo is emerging as a southern-hemisphere hub, whereas Riyadh is leveraging sovereign capital to erect new digital corridors linked to Vision 2030 goals. Across all regions, renewable accessibility and streamlined grid interconnections are decisive site-selection filters, making wind-rich Patagonia and solar-dense Emirates unexpectedly attractive for the next wave of builds.
- Equinix Inc.
- Digital Realty Trust Inc.
- NTT Global Data Centers
- CyrusOne Inc.
- CoreSite Realty Corp.
- Cyxtera Technologies Inc.
- Iron Mountain Data Centers
- KDDI (telehouse)
- Flexential Corp.
- Rackspace Technology Inc.
- Vantage Data Centers
- QTS Data Centers (Blackstone)
- Switch Inc.
- EdgeConneX
- Stack Infrastructure
- Aligned Data Centers
- Global Switch
- Telefonica Tech
- China Telecom Global
- Scala Data Centers
- Teraco Data Environments
- Keppel DC REIT
Additional Benefits:
- The market estimate (ME) sheet in Excel format
- 3 months of analyst support
TABLE OF CONTENTS
1 INTRODUCTION
- 1.1 Study Assumptions and Market Definition
- 1.2 Scope of the Study
2 RESEARCH METHODOLOGY
3 EXECUTIVE SUMMARY
4 MARKET LANDSCAPE
- 4.1 Market Overview
- 4.2 Market Drivers
- 4.2.1 Increasing integration of cloud and SaaS workloads
- 4.2.2 Proliferation of data from IoT/AI and edge workloads
- 4.2.3 Stricter data-sovereignty laws boosting in-country colo demand
- 4.2.4 Emergence of SMR-based on-site nuclear power for mega campuses
- 4.2.5 AI-driven workload density requiring liquid-cool-ready colo suites
- 4.2.6 Sovereign AI initiatives requiring trusted third-party capacity
- 4.3 Market Restraints
- 4.3.1 High up-front build cost amid elevated interest rates
- 4.3.2 Chronic grid-power and land shortages in Tier-1 metros
- 4.3.3 Carbon-tax escalation raising opex unpredictability
- 4.3.4 Rising insurance premiums linked to climate risk
- 4.4 Supply-Chain Analysis
- 4.5 Regulatory Landscape
- 4.6 Technological Outlook
- 4.7 Porter's Five Forces
- 4.7.1 Bargaining Power of Suppliers
- 4.7.2 Bargaining Power of Buyers
- 4.7.3 Threat of New Entrants
- 4.7.4 Threat of Substitutes
- 4.7.5 Intensity of Competitive Rivalry
- 4.8 Assesment of Macroeconomic Factors on the Market
5 MARKET SIZE AND GROWTH FORECASTS (VALUE)
- 5.1 By Colocation Type
- 5.1.1 Retail
- 5.1.2 Wholesale
- 5.2 By Tier Standard
- 5.2.1 Tier I & II
- 5.2.2 Tier III
- 5.2.3 Tier IV
- 5.3 By Data Center Size
- 5.3.1 Small
- 5.3.2 Medium
- 5.3.3 Large
- 5.3.4 Massive
- 5.3.5 Mega
- 5.4 By End-user Industry
- 5.4.1 BFSI
- 5.4.2 IT and Telecom
- 5.4.3 E-commerce and Retail
- 5.4.4 Government and Defense
- 5.4.5 Manufacturing and Industrial IoT
- 5.4.6 Media and Entertainment
- 5.4.7 Healthcare and Life Sciences
- 5.4.8 Energy and Utilities
- 5.5 By Geography
- 5.5.1 North America
- 5.5.1.1 United States
- 5.5.1.2 Canada
- 5.5.1.3 Mexico
- 5.5.2 South America
- 5.5.2.1 Brazil
- 5.5.2.2 Argentina
- 5.5.2.3 Rest of South America
- 5.5.3 Europe
- 5.5.3.1 United Kingdom
- 5.5.3.2 Germany
- 5.5.3.3 France
- 5.5.3.4 Italy
- 5.5.3.5 Spain
- 5.5.3.6 Russia
- 5.5.3.7 Rest of Europe
- 5.5.4 Asia-Pacific
- 5.5.4.1 China
- 5.5.4.2 Japan
- 5.5.4.3 India
- 5.5.4.4 South Korea
- 5.5.4.5 Australia and New Zealand
- 5.5.4.6 Rest of Asia-Pacific
- 5.5.5 Middle East and Africa
- 5.5.5.1 Middle East
- 5.5.5.1.1 Saudi Arabia
- 5.5.5.1.2 UAE
- 5.5.5.1.3 Turkey
- 5.5.5.1.4 Rest of Middle East
- 5.5.5.2 Africa
- 5.5.5.2.1 South Africa
- 5.5.5.2.2 Nigeria
- 5.5.5.2.3 Kenya
- 5.5.5.2.4 Rest of Africa
- 5.5.5.1 Middle East
- 5.5.1 North America
6 COMPETITIVE LANDSCAPE
- 6.1 Market Share Analysis
- 6.2 Company Profiles (includes Global level Overview, Market level overview, Core Segments, Financials as available, Strategic Information, Market Rank/Share for key companies, Products and Services, and Recent Developments)
- 6.2.1 Equinix Inc.
- 6.2.2 Digital Realty Trust Inc.
- 6.2.3 NTT Global Data Centers
- 6.2.4 CyrusOne Inc.
- 6.2.5 CoreSite Realty Corp.
- 6.2.6 Cyxtera Technologies Inc.
- 6.2.7 Iron Mountain Data Centers
- 6.2.8 KDDI (telehouse)
- 6.2.9 Flexential Corp.
- 6.2.10 Rackspace Technology Inc.
- 6.2.11 Vantage Data Centers
- 6.2.12 QTS Data Centers (Blackstone)
- 6.2.13 Switch Inc.
- 6.2.14 EdgeConneX
- 6.2.15 Stack Infrastructure
- 6.2.16 Aligned Data Centers
- 6.2.17 Global Switch
- 6.2.18 Telefonica Tech
- 6.2.19 China Telecom Global
- 6.2.20 Scala Data Centers
- 6.2.21 Teraco Data Environments
- 6.2.22 Keppel DC REIT
7 MARKET OPPORTUNITIES AND FUTURE OUTLOOK
- 7.1 White-space and Unmet-Need Assessment
 资料中心託管市场:按类型、服务类型、等级、电力容量、部署模式、企业规模和最终用户产业划分-2026-2032年全球市场预测
 2026年全球多租户资料中心市场报告
 资料中心託管市场分析及预测(至2035年):类型、产品类型、服务、技术、组件、应用、部署模式、最终用户、解决方案
 2026-2030年全球资料中心託管与管理式主机服务市场2026年全球资料中心託管市场报告
 资料中心託管:决策者视角与策略重点,2026-2027 年全球多租户资料中心市场规模、份额、趋势和成长分析报告(2026-2034)
 资料中心託管市场 - 全球产业规模、份额、趋势、机会、预测:託管类型、企业规模、最终用途、地区和竞争格局,2021-2031年全球资料中心营运商概况、託管、2026 年
 日本资料中心託管市场报告(按类型、组织规模、最终用途行业和地区划分,2026-2034 年)