


 |
市场调查报告书
商品编码
1937323
硫酸:市占率分析、产业趋势与统计、成长预测(2026-2031)Sulfuric Acid - Market Share Analysis, Industry Trends & Statistics, Growth Forecasts (2026 - 2031) |
||||||
※ 本网页内容可能与最新版本有所差异。详细情况请与我们联繫。
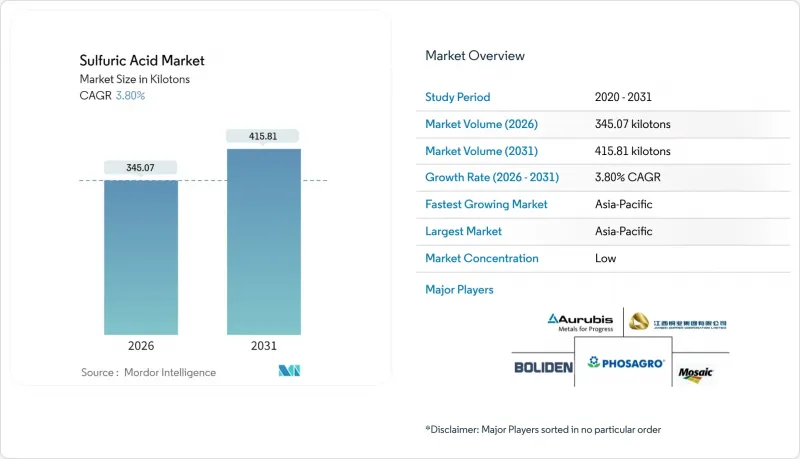
预计到 2026 年,硫酸市场规模将达到 345.07 千吨,高于 2025 年的 332.44 千吨。
预计到 2031 年产量将达到 415.81 千吨,2026 年至 2031 年的复合年增长率为 3.80%。
磷肥生产商(尤其是中国、印度和摩洛哥的生产商)的强劲需求支撑着这一成长趋势,因为各国政府都将粮食安全和作物产量稳定放在首位。非铁金属冶炼和石油炼製的垂直整合正在增加自用供应,并缩小原料所有者和下游酸消费者之间长期存在的差距。新的电池电解液要求和日益严格的超低硫燃料法规正在推动基本客群多元化和区域贸易流量的重组。由于运费波动和不断上涨的ESG合规遵循成本给利润率带来压力,营运商正在加快采用先进的製程控制和数位化绩效管理工具,以降低能源消耗和排放。
全球硫酸市场趋势及展望
扩大亚洲和非洲的磷肥生产能力
在摩洛哥,一个计划于2025年运作的硫磺燃烧计划将增加当地的硫酸供应,并加强下游磷酸盐的生产。在印度,一项与茅利塔尼亚达成的政策支持进口协议将确保磷矿石原料的稳定供应,从而支持新的磷酸反应器的运作,并刺激对硫酸日益增长的需求。美国地质调查局(USGS)预测,到2027年,全球磷酸盐产能将达到6,910万吨,巴西、哈萨克、墨西哥、摩洛哥和俄罗斯的产能扩张正在同步进行。新增供应将新的需求集中在大西洋和印度洋航线附近,促使贸易商重新调整现货货物的运输策略,并签订长期承购协议。供应链正从传统的中东至亚洲路线转向区域内分销,主要透过北非和南亚,这挤压了独立调配商和经销商的净利润空间。
收紧超低硫燃料标准促进硫回收
北美和欧洲的燃料法规(强制规定硫含量低于10 ppm)迫使炼油厂最大限度地提高克劳斯装置的硫回收率,并将更多回收的硫转化为硫酸。综合能源公司正在维修废气处理装置,以实现99.7%或更高的二氧化硫(SO2)转换率。这些升级改造直接扩大了国内化肥厂的硫源供应。虽然这些投资需要大量资金投入,但它们可以抵消排放罚款,并使炼油厂能够将曾经的处置成本中心变现。
炼油厂合理化导致硫磺供应波动
由于成熟市场炼油厂关闭产能或转向生物基原料,元素硫的产量波动难以预测。西欧营运商报告称,回收硫的供应出现长达数月的缺口,迫使化肥企业以高价进口。硫酸市场参与企业正透过采用灵活的原料策略(例如黄铁矿焙烧和酸再生)来规避这种风险,但这些方案会带来更高的能源消耗和更严格的监管审查。
细分市场分析
至2025年,元素硫将占硫酸市场78.40%的份额,并在此基础上,2031年达到3.79%的复合年增长率。从天然气加工和无污染燃料精炼中回收元素硫具有黄铁矿焙烧难以实现的成本优势。儘管Intratech Alert追踪的硫价波动有时会缩小这种差距,但整合带来的协同效应仍然有利于元素硫的回收。
炼油厂的硫化氢气流可提供可预测的原料纯度,并简化DCDA转换器的催化剂控制,使业者能够将酸雾浓度控制在250 ppm以下。当原油成分趋于酸化时,硫酸产业会调整增产幅度以平衡化肥需求的激增。同时,欧洲炼油厂的合理化改造导致硫酸供应减少,促使贸易商将硫酸从波斯湾传输到安特卫普和汉堡的码头。
预计到2025年,DCDA製程将占全球硫酸产量的89.30%,其成长速度将超过硫酸市场整体3.86%的复合年增长率。此升级製程采用五氧化二钒催化剂,并添加了专有的铯助剂,以实现快速点火和延长使用寿命。
印尼和沙乌地阿拉伯的新工厂采用全自动的通道间温度控制来最大限度地减少 SO3 洩漏,而波兰的维修则利用余热回收蒸汽产生器来减少每吨高达 25 兆焦耳的净能源消耗。
区域分析
预计到2025年,亚太地区将占全球磷酸消费量的51.20%,并在2031年之前以4.03%的复合年增长率持续扩大其领先优势。中国湖南和湖北的磷酸盐化肥生产基地正在突破现有设施的瓶颈,而印度新建的磷酸反应器在政府补贴的配合下,正在提升国内磷酸产量。浙江和四川的电池材料产业园区已签署多年承购协议,供应高纯度磷酸产品,从而锁定了额外的消费酸进口需求。
北美冶炼厂配套的回收网络拥有成熟的基本客群,但美国大西洋沿岸的产能合理化正在减少过剩产能。在欧洲,严格的环境法规仍然有效,推动了二氯化二铵(DCDA)装置的大规模维修和二次洗涤装置的安装。由于土地施用限制更加严格,对化肥级酸的需求略有成长,而德国和荷兰的特种化学品产业群聚对高纯度酸的需求正在增加。
以智利、秘鲁和巴西为首的南美洲,正经历着亚洲以外最强劲的供应成长。这些国家自给自足的铜冶炼厂正在生产自身使用的酸,取代了从美国墨西哥湾沿岸海运的货物。巴西塞拉多地区的农业中心优先考虑本地供应,以缩短前置作业时间并降低运费溢价,在运输中断期间稳定交付价格。
其他福利:
- Excel格式的市场预测(ME)表
- 3个月的分析师支持
目录
第一章 引言
- 研究假设和市场定义
- 调查范围
第二章调查方法
第三章执行摘要
第四章 市场情势
- 市场概览
- 市场驱动因素
- 扩大亚洲和非洲的磷肥生产能力
- 收紧超低硫燃料标准促进硫回收
- 电动车(铅酸电池和新兴的锌离子电池)对电池级电解的需求
- 拉丁美洲铜锌冶炼厂扩建
- 化学和製药业的需求不断增长
- 市场限制
- 炼油厂合理化导致硫磺供应波动
- 增加受环境、社会及公司治理(ESG)因素主导的废气净化设备资本投资
- 主要硫酸贸易路线的运费上涨
- 价值链分析
- 贸易分析
- 原料分析
- 各地区的生产能力
- 波特五力模型
- 供应商的议价能力
- 买方的议价能力
- 新进入者的威胁
- 替代品的威胁
- 竞争程度
第五章 市场规模与成长预测
- 依原料类型
- 硫元素
- 黄铁矿
- 其他原材料类型
- 透过製造工艺
- 单次接触流程
- 双接触双吸收(DCDA)
- 浓度
- 标准(93-98 wt%)
- 发烟硫酸
- 按最终用户行业划分
- 肥料
- 化学品和製药
- 车
- 炼油
- 其他终端用户产业(纸浆和造纸、金属加工)
- 按地区
- 亚太地区
- 中国
- 印度
- 日本
- 韩国
- 印尼
- 马来西亚
- 泰国
- 越南
- 亚太其他地区
- 北美洲
- 我们
- 加拿大
- 墨西哥
- 欧洲
- 德国
- 英国
- 法国
- 义大利
- 西班牙
- 北欧国家
- 俄罗斯
- 其他欧洲
- 南美洲
- 巴西
- 阿根廷
- 哥伦比亚
- 中东和非洲
- 沙乌地阿拉伯
- 阿拉伯聯合大公国
- 卡达
- 埃及
- 南非
- 奈及利亚
- 其他中东和非洲地区
- 亚太地区
第六章 竞争情势
- 市场集中度
- 策略趋势
- 市占率分析
- 公司简介
- Aarti Industries Ltd.
- Aluminum Corporation of China
- Aurubis AG
- BASF
- Boliden Group
- Chemtrade Logistics
- GRUPO MEXICO
- Hindustan Zinc
- Jiangxi Copper Corporation
- KANTO KAGAKU
- Mosaic
- Nouryon
- OCP
- Panoli Intermediates India Pvt. Ltd.
- PhosAgro Group
- PVS
- Sumitomo Metal Mining Co., Ltd.
- Vale
- WeylChem International GmbH
第七章 市场机会与未来展望
Sulfuric Acid market size in 2026 is estimated at 345.07 kilotons, growing from 2025 value of 332.44 kilotons with 2031 projections showing 415.81 kilotons, growing at 3.80% CAGR over 2026-2031.
Robust demand from phosphate fertilizer producers, particularly across China, India, and Morocco, anchors this trajectory as governments prioritize food security and crop-yield resilience. Vertical integration in non-ferrous smelting and petroleum refining yields incremental captive supply, narrowing the historical divide between raw-material owners and downstream acid consumers. New battery-grade electrolyte requirements and tightening ultra-low-sulfur fuel regulations are diversifying the customer base and reshaping regional trade flows. Freight-rate volatility and rising ESG-driven compliance outlays compel margins, prompting operators to accelerate process-control upgrades and digital performance tools that curb energy intensity and tail-gas emissions.
Global Sulfuric Acid Market Trends and Insights
Phosphate-Fertilizer Capacity Expansions in Asia and Africa
Morocco's sulfur-burning projects, scheduled for commissioning in 2025, will raise local acid availability and bolster downstream phosphate output. In India, policy-backed import pacts with Mauritania ensure rock-phosphate feedstock security, supporting new phosphoric-acid reactors that intensify sulfuric acid drawdown. The U.S. Geological Survey expects global phosphate capacity to reach 69.1 million tons by 2027, with Brazil, Kazakhstan, Mexico, Morocco, and Russia expanding simultaneously. These additions cluster fresh demand around Atlantic and Indian Ocean shipping lanes, prompting traders to reposition spot cargoes and sign longer-tenor off-take contracts. Supply chains are shifting from historic Middle East-to-Asia routes toward intra-regional flows centered on North Africa and South Asia, compressing netback margins for independent blenders and distributors.
Tightening Ultra-Low-Sulfur Fuel Specifications Boosting Sulfur Recovery
North American and European fuel regulations that mandate sulfur contents below 10 ppm are compelling refiners to maximize Claus-unit recovery and convert larger volumes of recovered sulfur into captive acid streams. Integrated energy companies are retrofitting tail-gas treating units to achieve more than 99.7% SO2 conversion, an upgrade that directly enlarges domestic supply pools for fertilizer complexes. These investments, while capital intensive, offset emission-penalty liabilities and allow refiners to monetize what was once a disposal cost center.
Sulfur Supply Volatility Linked to Refinery Rationalisation
As mature-market refineries shutter capacity or shift toward bio-feedstocks, elemental-sulfur output fluctuates unpredictably. Operators in Western Europe report multi-month gaps in recovered sulfur availability, compelling fertilizer complexes to secure imports at elevated prices. Sulfuric acid market participants hedge this exposure by adopting flexible feedstock strategies, including Pyrite roasting or acid regeneration, although these options carry higher energy footprints and regulatory scrutiny.
Other drivers and restraints analyzed in the detailed report include:
- Battery-Grade Electrolyte Demand from EVs
- Copper and Zinc Smelter Build-Outs in Latin America
- Rising ESG-Driven Capital Expenditure for Tail-Gas Scrubbing
For complete list of drivers and restraints, kindly check the Table Of Contents.
Segment Analysis
Elemental sulfur contributed 78.40% of the 2025 output within the sulfuric acid market size and underpinned an anticipated 3.79% CAGR to 2031. Recovery from natural-gas processing and clean-fuel refining secures cost advantages that Pyrite roasting struggles to match. Volatile sulfur benchmarks, documented by Intratec Alerts, occasionally narrow this gap, but integration synergies still favor elemental pathways.
Refinery hydrogen-sulfide streams deliver predictable feedstock purity that simplifies catalyst control in DCDA converters, helping operators meet sub-250 ppm acid-mist targets. When crude slates swing toward higher sourness, the sulfuric acid industry calibrates output upswings, balancing fertilizer demand spikes. Conversely, refinery rationalisation in Europe removes supply, prompting traders to redirect Persian Gulf tonnage toward Antwerp and Hamburg terminals.
The DCDA route accounted for 89.30% of global output in 2025 and is poised to outpace headline sulfuric acid market growth with a 3.86% CAGR. Replacement cycles favor vanadium-pentoxide catalysts with proprietary cesium promoters that deliver fast ignition and extended life.
Emerging plants in Indonesia and Saudi Arabia are specifying fully automated inter-pass temperature controls to minimize SO3 slip, while retrofits in Poland exploit heat-recovery steam generators that trim net energy use by up to 25 MJ per tonne.
The Sulfuric Acid Market Report Segments the Industry by Raw Material Type (Elemental Sulfur, Pyrite Ore, and Other Raw Material Types), Production Process (Single Contact Process and Double Contact Double Absorption (DCDA)), Concentration (Standard (93-98 Wt%) and Oleum/Fuming Acid), End-User Industry (Fertilizer, Chemical and Pharmaceutical, and More), and Geography (Asia-Pacific, North America, Europe, and More).
Geography Analysis
Asia Pacific commanded 51.20% of global consumption in 2025, and is projected to widen its lead at a 4.03% CAGR to 2031. China's phosphate-fertilizer complexes in Yunnan and Hubei continue brownfield debottlenecking, while India's new phosphoric-acid reactors align with government subsidy schemes that reward local production. Battery-material parks in Zhejiang and Sichuan are contracting high-purity supply under multi-year offtakes, anchoring additional merchant-acid import needs.
North America's refinery-linked recovery network supplies a mature customer base, yet capacity rationalisation in the U.S. Atlantic seaboard trims surplus. Europe maintains stringent environmental compliance, driving widespread DCDA retrofits and secondary scrubber installations. Fertilizer-grade demand grows modestly as land-application caps tighten, yet high-purity acid consumption rises within specialty chemical corridors in Germany and the Netherlands.
South America, led by Chile, Peru, and Brazil, records the strongest incremental supply growth outside Asia. Autogenous copper smelters generate captive acid that displaces seaborne cargoes from the U.S. Gulf. Agricultural hubs in Brazil's Cerrado prefer regional supply due to shorter lead times and reduced freight premiums, stabilizing delivered prices during shipping upsets.
- Aarti Industries Ltd.
- Aluminum Corporation of China
- Aurubis AG
- BASF
- Boliden Group
- Chemtrade Logistics
- GRUPO MEXICO
- Hindustan Zinc
- Jiangxi Copper Corporation
- KANTO KAGAKU
- Mosaic
- Nouryon
- OCP
- Panoli Intermediates India Pvt. Ltd.
- PhosAgro Group
- PVS
- Sumitomo Metal Mining Co., Ltd.
- Vale
- WeylChem International GmbH
Additional Benefits:
- The market estimate (ME) sheet in Excel format
- 3 months of analyst support
TABLE OF CONTENTS
1 Introduction
- 1.1 Study Assumptions and Market Definition
- 1.2 Scope of the Study
2 Research Methodology
3 Executive Summary
4 Market Landscape
- 4.1 Market Overview
- 4.2 Market Drivers
- 4.2.1 Phosphate-fertilizer Capacity Expansions in Asia and Africa
- 4.2.2 Tightening Ultra-Low-Sulfur Fuel Specs Boosting Sulfur Recovery
- 4.2.3 Battery-grade Electrolyte Demand from EVs (Lead-acid and Emerging Zn-ion)
- 4.2.4 Copper and Zinc Smelter Build-outs in Latin America
- 4.2.5 Growing Demand from Chemical and Pharmaceutical Industries
- 4.3 Market Restraints
- 4.3.1 Sulfur Supply Volatility Linked to Refinery Rationalisation
- 4.3.2 Rising ESG-Driven Cap-ex for Tail-Gas Scrubbing
- 4.3.3 Freight Rate Spikes on Key Sulfuric Acid Trade Routes
- 4.4 Value Chain Analysis
- 4.5 Trade Analysis
- 4.6 Feedstock Analysis
- 4.7 Regional Propduction Capacity
- 4.8 Porter's Five Forces
- 4.8.1 Bargaining Power of Suppliers
- 4.8.2 Bargaining Power of Buyers
- 4.8.3 Threat of New Entrants
- 4.8.4 Threat of Substitutes
- 4.8.5 Degree of Competition
5 Market Size and Growth Forecasts (Volume)
- 5.1 By Raw Material Type
- 5.1.1 Elemental Sulfur
- 5.1.2 Pyrite Ore
- 5.1.3 Other Raw Material Types
- 5.2 By Production Process
- 5.2.1 Single Contact Process
- 5.2.2 Double Contact Double Absorption (DCDA)
- 5.3 By Concentration
- 5.3.1 Standard (93-98 wt%)
- 5.3.2 Oleum/Fuming Acid
- 5.4 By End-user Industry
- 5.4.1 Fertilizer
- 5.4.2 Chemical and Pharmaceutical
- 5.4.3 Automotive
- 5.4.4 Petroleum Refining
- 5.4.5 Other End-user Industries (Pulp and Paper, Metal Processing)
- 5.5 By Geography
- 5.5.1 Asia-Pacific
- 5.5.1.1 China
- 5.5.1.2 India
- 5.5.1.3 Japan
- 5.5.1.4 South Korea
- 5.5.1.5 Indonesia
- 5.5.1.6 Malaysia
- 5.5.1.7 Thailand
- 5.5.1.8 Vietnam
- 5.5.1.9 Rest of Asia-Pacific
- 5.5.2 North America
- 5.5.2.1 United States
- 5.5.2.2 Canada
- 5.5.2.3 Mexico
- 5.5.3 Europe
- 5.5.3.1 Germany
- 5.5.3.2 United Kingdom
- 5.5.3.3 France
- 5.5.3.4 Italy
- 5.5.3.5 Spain
- 5.5.3.6 Nordics
- 5.5.3.7 Russia
- 5.5.3.8 Rest of Europe
- 5.5.4 South America
- 5.5.4.1 Brazil
- 5.5.4.2 Argentina
- 5.5.4.3 Colombia
- 5.5.5 Middle-East and Africa
- 5.5.5.1 Saudi Arabia
- 5.5.5.2 United Arab Emirates
- 5.5.5.3 Qatar
- 5.5.5.4 Egypt
- 5.5.5.5 South Africa
- 5.5.5.6 Nigeria
- 5.5.5.7 Rest of Middle-East and Africa
- 5.5.1 Asia-Pacific
6 Competitive Landscape
- 6.1 Market Concentration
- 6.2 Strategic Moves
- 6.3 Market Share Analysis
- 6.4 Company Profiles (includes Global level Overview, Market level overview, Core Segments, Financials as available, Strategic Information, Market Rank/Share for key companies, Products and Services, and Recent Developments)
- 6.4.1 Aarti Industries Ltd.
- 6.4.2 Aluminum Corporation of China
- 6.4.3 Aurubis AG
- 6.4.4 BASF
- 6.4.5 Boliden Group
- 6.4.6 Chemtrade Logistics
- 6.4.7 GRUPO MEXICO
- 6.4.8 Hindustan Zinc
- 6.4.9 Jiangxi Copper Corporation
- 6.4.10 KANTO KAGAKU
- 6.4.11 Mosaic
- 6.4.12 Nouryon
- 6.4.13 OCP
- 6.4.14 Panoli Intermediates India Pvt. Ltd.
- 6.4.15 PhosAgro Group
- 6.4.16 PVS
- 6.4.17 Sumitomo Metal Mining Co., Ltd.
- 6.4.18 Vale
- 6.4.19 WeylChem International GmbH
7 Market Opportunities and Future Outlook
- 7.1 White-space and Unmet-need Assessment
- 7.2 Growing Use of Oleum in Medical and Other Industries
 恩康唑硫酸盐市场:2026-2032年全球市场预测(依作物类型、剂型、应用、最终用户和销售管道)
 硫酸市场规模、份额和成长分析:按原料、应用、纯度、等级和地区划分-2026-2033年产业预测
 全球硫酸市场规模、份额、趋势和成长分析报告(2026-2034)
 2026年全球硫酸市场报告
 硫酸市场-全球产业规模、份额、趋势、机会、预测:等级、终端用途产业、销售管道、区域及竞争格局,2021-2031年
 硫酸市场规模、份额和趋势分析报告:按原料、应用、地区和细分市场预测,2026-2033年超纯硫酸市场依纯度等级、形态、包装、销售管道及最终用途产业划分-2026-2032年全球预测超纯硫酸市场依纯度等级、形态、应用、终端用户产业及通路划分-2026年至2032年全球预测
 按产品类型、应用和地区分類的发烟硫酸市场规模、份额和成长分析 - 2026-2033 年产业预测
 硫酸催化剂:全球市占率及排名、总收入及需求预测(2025-2031年)