


 |
市场调查报告书
商品编码
1937378
苯、甲苯和二甲苯(BTX):市场份额分析、行业趋势和统计数据、成长预测(2026-2031)Benzene-Toluene-Xylene (BTX) - Market Share Analysis, Industry Trends & Statistics, Growth Forecasts (2026 - 2031) |
||||||
※ 本网页内容可能与最新版本有所差异。详细情况请与我们联繫。
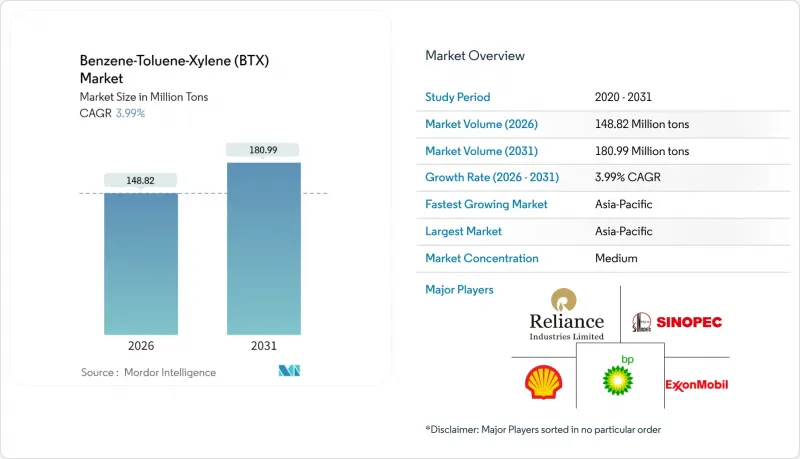
预计到 2026 年,苯、甲苯和二甲苯 (BTX) 的市场规模将达到 1.4882 亿吨。
这意味着产量将从 2025 年的 1.4311 亿吨增长到 2031 年的 1.8099 亿吨,2026 年至 2031 年的复合年增长率为 3.99%。
下游对塑胶、合成纤维和特种化学品的强劲需求支撑着全球芳烃联合装置的高运转率。同时,亚太地区新增产能正在改变贸易格局,加剧竞争压力。对PET生产所需的对二甲苯需求不断增长,聚氨酯泡棉生产中甲苯二异氰酸酯需求復苏,以及生物质和热塑製程的商业化,都推动了BTX市场规模的稳定扩张。区域发展不平衡显而易见:亚太地区利用成本优势的原料和一体化工厂;北美地区则面临生产成本上升和进口增加的双重挑战;而欧洲则为应对日益严格的环境法规而精简生产。高成本企业在价格波动的环境下寻求抗风险能力,推动竞争朝向原料整合、技术现代化和选择性整合的方向发展。
全球苯、甲苯和二甲苯 (BTX) 市场趋势及洞察
亚洲和中东新建芳烃联合装置的资本投资激增
亚太地区计划在2030年新增545万吨苯产能,其中329万吨将位于印度。这得归功于炼油厂的升级改造和麵向出口贸易的新计画。沙乌地阿拉伯的下游一体化发展也遵循着类似的轨迹。沙特阿美、中石化和亚斯瑞夫三方合作架构计画建造一座年产150万吨芳烃联合装置和一座年产180万吨混合原料裂解装置,以最大限度地发挥原料协同效应。这项投资热潮的驱动因素包括规模经济、有利的石脑油和冷凝油供应以及接近性不断增长的亚洲需求。产能扩张虽然提高了该地区的自给自足能力,但也增加了欧洲和北美生产的商品苯和混合二甲苯供应过剩的风险。这种成本曲线的变化有利于拥有原料优势的一体化企业,并给高成本的独立炼油厂带来压力。
由于PET需求快速成长,对二甲苯的供需仍紧张。
2023年,全球对二甲苯产量将超过5,700万吨,这主要得益于中国宝特瓶树脂和纤维用对二甲苯产能的快速扩张。儘管永续性法规正在推动成熟市场采用再生PET,但在人口稠密、回收基础设施有限的经济体中,对二甲苯的新需求仍在持续成长。供需紧张使得对二甲苯的价格高于混合二甲苯原料,从而抵消了苯和甲苯行业利润率的下降。对二甲苯与PET之间的关联性有利于生产商的经济效益,并有助于炼油厂和一体化聚酯产业链之间签订长期合约。
基于致癌性的职业接触法规
苯被列为1类致癌性,导致职场暴露限值提高,例如欧盟某些表面处理工艺中的限值已降至20 mg/m³。为符合相关规定,企业需要实施连续监测、蒸气回收设备和活性碳吸附系统,增加了生产、储存和运输等各环节的营运成本。石化企业正在投资建造封闭式装卸臂、氮气惰性气体保护装置和先进的个人防护设备,以确保工人安全。虽然这些措施需要大量资金投入,但它们可以降低事故风险和潜在的法律责任,因此是参与BTX市场运作的必要前提。
细分市场分析
由于苯深度融入苯乙烯、尼龙和酚等价值链,支撑了包装、汽车和建筑行业的需求,预计到2025年,苯在BTX市场仍将占据38.21%的份额。儘管选择性甲苯歧化、甲醇烷基化和催化重整等製程确保了苯的稳定供应,但其成本结构仍容易受到轻石脑油裂解价格和区域采购差异的影响。预计2024年北美运转率将徘徊在72%左右,并可能因利润率预期下降而在2025年降至70%以下。截至2024年10月,受暂时套利机会的驱动,来自亚洲的进口占美国苯流入量的60%以上。然而,随着价格差异的缩小,预计这些进口量将会下降。转换柔软性允许炼油厂在苯和对二甲苯生产之间切换,但重整装置产品品质的物理限制制约了这种切换。
儘管甲苯产量较低,但预计到2031年,其复合年增长率将达到4.44%,成为成长最快的化学品之一,这主要得益于TDI的復苏和溶剂需求的不断增长。诸如UOP的Tatoray和中石化的MST等歧化技术旨在利用苯与甲苯有利的价差,将过量的甲苯转化为高价值的苯和对二甲苯。催化剂寿命的延长和氢气消耗量的降低提高了製程的经济性,刺激了中东地区炼油厂改造现有设施的兴趣,以确保其下游扩建所需的苯供应来源。二甲苯异构体是连接苯和甲苯的重要纽带。对二甲苯满足了PET日益增长的需求,邻二甲苯是PVC增塑剂邻邻苯二甲酐的原料,而间二甲苯则满足了间苯二甲酸树脂的需求。二甲苯的供应取决于重整装置的产量和重整装置的馏分收率,但缺口正透过机会主义进口来弥补,这表明BTX市场日益全球化。
苯、甲苯和二甲苯 (BTX) 市场报告按类型(苯、甲苯、二甲苯)、应用(乙苯、环己烷、烷基苯、异丙苯、硝基苯、油漆和涂料、黏合剂、化学中间体、溶剂、单体)和地区(北美、南美、欧洲、亚太、中东和非洲)进行细分。市场预测以吨为单位。
区域分析
亚太地区在2025年占据了BTX市场62.35%的主导份额,并在2031年之前保持4.12%的最快复合年增长率,这主要得益于中国、印度和韩国的炼油和石化一体化中心的发展。光是中国就计划在2025年下半年运作308.8万吨新的二甲苯产能,主要用于生产对二甲苯,以满足其PET生产线的需求。印度已宣布到2030年将运作329万吨的苯产能,使其成为通用级苯产品的出口国。儘管亚太地区拥有规模优势,但由于多个新计画同时运作,该地区仍面临供应过剩的风险。 HD Hyundai Cosmo在持续遭受中国竞争对手的亏损后,以1.04亿美元收购该公司便印证了这一点。然而,电子商务主导的包装需求成长、强劲的汽车生产以及基础设施项目将支撑稳定的市场需求吸收。
由于萨尼亚和俄亥俄州的单辛烯生产设施关闭,北美BTX(苯、甲苯、甲苯、二甲苯)供应结构正在萎缩。这降低了该地区的苯自给率,并增加了对亚洲和中东进口的依赖。天然气基乙烷裂解製取的重整芳烃产量不断增加,在下游需求疲软的市场环境下,苯供应面临压力。欧洲正在进行持续的合理化调整,计画从2023年起削减1,400万吨芳烃和裂解产能。由于被迫升级改造以符合碳定价和VOC(挥发性有机化合物)指令,营运商的盈利正在下降。政策主导的能源成本上涨进一步削弱了竞争力,导致资产转换和关闭。
中东地区拥有丰富的石脑油和冷凝油供应,这使得该地区能够以较低的现金成本生产苯并噻吩(BTX),并与延布等地新建的混合原料裂解装置相结合。中东的出口导向使其能够很好地满足非洲和南亚的需求缺口,同时其与亚洲的地理位置接近性也使其拥有广泛的运输选择。南美和非洲的需求规模小规模,但随着汽车组装产能的提升和因疫情而延误的建设计划逐步恢復,它们的重要性日益凸显。将苯并噻吩的生产重新布局到有利地区可能会重塑贸易格局,并减少历史上平衡全球供需缺口的套利机会。
其他福利:
- Excel格式的市场预测(ME)表
- 分析师支持(3个月)
目录
第一章 引言
- 研究假设和市场定义
- 调查范围
第二章调查方法
第三章执行摘要
第四章 市场情势
- 市场概览
- 市场驱动因素
- 亚洲和中东新建芳烃联合装置的资本投资激增
- 由于PET需求快速成长,对二甲苯的供需平衡仍然紧张。
- 汽车和建设业的復苏将提振对TDI和油漆溶剂的需求。
- 透过炼油和石化一体化实现BTX内部萃取
- 透过热解塑胶和生物质途径实现直接替代BTX的商业化
- 市场限制
- 基于致癌性的职业接触法规
- 涂料和黏合剂中的挥发性有机化合物(VOC)法规推动了低芳香族混合物的使用。
- E10 引入后,汽油市场中辛烷值和芳烃含量之间存在权衡关係。
- 价值链分析
- 波特五力模型
- 供应商的议价能力
- 买方的议价能力
- 新进入者的威胁
- 替代品的威胁
- 竞争程度
第五章 市场规模与成长预测
- 按类型
- 苯
- 甲苯
- 二甲苯
- 邻二甲苯
- 间二甲苯
- 对二甲苯
- 透过使用
- 苯
- 乙苯
- 环己烷
- 烷基苯
- 异丙苯
- 硝基苯
- 其他用途
- 甲苯
- 油漆和涂料
- 黏合剂和油墨
- 霹雳
- 化学中间体
- 二甲苯
- 溶剂
- 单体
- 其他用途
- 苯
- 按地区
- 亚太地区
- 中国
- 印度
- 日本
- 韩国
- 亚太其他地区
- 北美洲
- 我们
- 加拿大
- 墨西哥
- 欧洲
- 德国
- 英国
- 义大利
- 法国
- 其他欧洲地区
- 南美洲
- 巴西
- 阿根廷
- 其他南美洲
- 中东和非洲
- 沙乌地阿拉伯
- 南非
- 其他中东和非洲地区
- 亚太地区
第六章 竞争情势
- 市场集中度
- 策略趋势
- 市占率(%)/排名分析
- 公司简介
- BASF
- BP plc
- Chevron Phillips Chemical Company LLC
- China Petrochemical Corporation
- China National offshore Oil Corporation(CNOOC)
- Dow
- ENEOS Corporation
- Exxon Mobil Corporation
- Formosa Plastics Group.
- GS Caltex Corporation
- INEOS
- IRPC Public Company Limited
- JFE Chemical Corporation
- JX Nippon Oil & Gas Exploration Corporation(ENEOS)
- Mitsubishi Gas Chemical Trading, Inc.
- MOLGROUP
- OCI COMPANY Ltd.
- Reliance Industries Limited
- SABIC
- Shell plc
- S-OIL CORPORATION
- TotalEnergies
- YEOCHUN NCC CO., LTD.
第七章 市场机会与未来展望
Benzene-Toluene-Xylene (BTX) market size in 2026 is estimated at 148.82 Million tons, growing from 2025 value of 143.11 Million tons with 2031 projections showing 180.99 Million tons, growing at 3.99% CAGR over 2026-2031.
Robust downstream demand for plastics, synthetic fibers and specialty chemicals keeps global aromatics complexes operating at high utilization rates, while new capacity in Asia-Pacific shifts trade flows and intensifies competitive pressure. Accelerating para-xylene off-take for PET, resurging toluene di-isocyanate demand from polyurethane foam, and the commercialization of biomass- and pyro-plastic routes collectively reinforce a steady, volume-based expansion of the BTX market. Regional imbalances are pronounced: Asia-Pacific secures cost-advantaged feedstocks and leverages integrated complexes, North America wrestles with elevated production costs and rising imports, and Europe undergoes rationalization in response to tightening environmental regulation. Competitive behavior gravitates toward feedstock integration, technology modernization and selective consolidation as high-cost players seek resilience in a cyclical pricing environment.
Global Benzene-Toluene-Xylene (BTX) Market Trends and Insights
CAPEX boom in new aromatics complexes (Asia and Middle-East)
The Asia-Pacific plans to add 5.45 million tons of additional benzene capacity by 2030, including 3.29 million tons in India, underpinned by refinery upgrades and grassroots projects tailored for export-oriented trade. Saudi downstream integration follows a similar trajectory: the Aramco-Sinopec-Yasref framework targets a 1.5 million-ton aromatics complex colocated with a 1.8 million-ton mixed-feed cracker to maximize feedstock synergy. Economies of scale, advantaged naphtha and condensate streams, and proximity to rising Asian demand underpin this investment wave. While the capacity infusion will deepen regional self-sufficiency, it raises the risk of oversupply for commodity benzene and mixed xylene grades produced in Europe and North America. Cost-curve displacement, therefore, favors integrated, feedstock-advantaged operators and pressures independent, higher-cost refiners.
Surging PET demand keeps para-xylene balances tight
Global para-xylene output topped 57 million tons in 2023 on the back of China's rapid capacity build-out devoted to PET bottle resin and textile filament. Sustainability legislation drives the adoption of recycled PET in mature markets, yet virgin para-xylene volumes continue to rise in populous economies with limited collection infrastructure. Tight balances have sustained para-xylene premiums over mixed xylene feedstocks, offsetting margin weakness in benzene and toluene pools. Producer economics benefit from the para-xylene-PET linkage, and the dynamic supports long-range contracts between refineries and integrated polyester chains.
Carcinogenicity-driven occupational exposure curbs
Benzene's classification as a Group 1 carcinogen underpins workplace exposure limits that tighten to as low as 20 mg/m3 for certain surface-treatment operations in the European Union. Compliance requires continuous monitoring, vapor recovery units, and active-carbon adsorption systems, adding operating costs across production, storage, and transport. Petrochemical sites invest in hermetic loading arms, nitrogen inerting, and advanced personal protective equipment to safeguard workers. Although capital-intensive, these measures reduce incident risk and potential liabilities, making compliance an essential prerequisite for operating in the BTX market.
Other drivers and restraints analyzed in the detailed report include:
- Automotive and construction rebound lifts TDI/paints solvent demand
- Refinery-petchem integration unlocking captive BTX extraction
- Paints/adhesives VOC regulations favor low-aromatic blends
For complete list of drivers and restraints, kindly check the Table Of Contents.
Segment Analysis
Benzene retained a 38.21% BTX market share in 2025, supported by deep integration into styrenics, nylon, and phenolics value chains that anchor demand across packaging, automotive, and construction. Selective toluene disproportionation, hydrodealkylation, and catalytic reforming ensure a steady supply, yet benzene's cost structure remains vulnerable to light-naphtha cracks and regional sourcing disparities. North American operating rates drifted near 72% in 2024, and forecast margin compression could push utilization below 70% in 2025. Imports from Asia supplied more than 60% of U.S. benzene inflows through October 2024 as arbitrage windows briefly opened; parity pricing is expected to narrow those inflows. Conversion flexibility allows refiners to swing between benzene and para-xylene, but physical constraints on reformate quality impose limits.
Toluene, although representing a smaller volume base, exhibits the fastest 4.44% CAGR through 2031, driven by the recovery of TDI and the evolution of solvent demand. Disproportionation technologies such as UOP's Tatoray and Sinopec's MST aim to exploit favorable benzene-toluene spreads by converting surplus toluene into high-value benzene and para-xylene. Improved catalyst lifetimes and lower hydrogen consumption enhance process economics, prompting retrofit interest among Middle Eastern complexes targeting captive benzene supply for downstream expansions. Xylene isomers collectively bridge the benzene and toluene pools: para-xylene captures PET growth, ortho-xylene feeds phthalic anhydride for PVC plasticizers, and meta-xylene underpins isophthalic resin demand. Although xylene availability follows reformer severity and reformate fractionation yields, opportunistic imports accommodate shortfalls, underscoring the increasingly globalized BTX market.
The Benzene-Toluene-Xylene (BTX) Market Report is Segmented by Type (Benzene, Toluene, and Xylene), Application (Ethylbenzene, Cyclohexane, Alkylbenzene, Cumene, Nitrobenzene, Paints and Coatings, Adhesives and Inks, Explosives, Chemical Intermediates, Solvents, Monomer), and Geography (North America, South America, Europe, Asia-Pacific, and Middle East and Africa). The Market Forecasts are Provided in Terms of Volume (Tons).
Geography Analysis
The Asia-Pacific region held a commanding 62.35% BTX market share in 2025 and sustained the fastest 4.12% CAGR to 2031, driven by integrated refinery-petrochemical hubs in China, India, and South Korea. China alone plans to schedule 3.088 million tons of new xylene capacity for H2 2025, primarily targeting para-xylene for captive PET lines. India's 3.29 million tons of benzene capacity announced for start-up by 2030 positions the country as a rising exporter of merchant grades. Despite its scale advantages, the region faces an oversupply risk as multiple grassroots projects come online concurrently, as evidenced by HD Hyundai Cosmo's acquisition for USD 104 million, following sustained losses attributed to Chinese competition. Nonetheless, e-commerce-led packaging growth, resilient automotive output, and infrastructure programs underpin steady volume absorption.
North America's BTX supply landscape contracts as styrene monomer units in Sarnia and Ohio shut down, lowering regional benzene self-sufficiency and increasing import reliance from Asia and the Middle East. Elevated natural-gas-based ethane cracking caps reformate aromatics output, squeezing benzene supply in a market already challenged by flat downstream demand. Europe continues a rationalization pathway that removed 14 million tons of aromatics and cracker capacity since 2023; operators confront carbon-pricing schemes and VOC directives requiring plant upgrades that strain return profiles. Policy-driven energy costs further erode competitiveness, prompting asset swaps or closures.
The Middle East rests on advantaged naphtha and condensate streams, enabling low cash-cost BTX production integrated with new mixed-feed crackers at sites such as Yanbu. Export orientation suits emerging deficits in Africa and South Asia, while proximity to Asia keeps freight optionality wide open. South America and Africa comprise smaller demand centers but gain relevance as automotive assembly lines ramp up and building projects resume following pandemic-delayed timelines. The geographic restructuring of BTX production toward advantaged regions reshapes trade patterns and might compress arbitrage windows that historically balanced global deficits.
- BASF
- BP p.l.c.
- Chevron Phillips Chemical Company LLC
- China Petrochemical Corporation
- China National offshore Oil Corporation (CNOOC)
- Dow
- ENEOS Corporation
- Exxon Mobil Corporation
- Formosa Plastics Group.
- GS Caltex Corporation
- INEOS
- IRPC Public Company Limited
- JFE Chemical Corporation
- JX Nippon Oil & Gas Exploration Corporation (ENEOS)
- Mitsubishi Gas Chemical Trading, Inc.
- MOLGROUP
- OCI COMPANY Ltd.
- Reliance Industries Limited
- SABIC
- Shell plc
- S-OIL CORPORATION
- TotalEnergies
- YEOCHUN NCC CO., LTD.
Additional Benefits:
- The market estimate (ME) sheet in Excel format
- 3 months of analyst support
TABLE OF CONTENTS
1 Introduction
- 1.1 Study Assumptions and Market Definition
- 1.2 Scope of the Study
2 Research Methodology
3 Executive Summary
4 Market Landscape
- 4.1 Market Overview
- 4.2 Market Drivers
- 4.2.1 CAPEX boom in new aromatics complexes (Asia and Middle-East)
- 4.2.2 Surging PET demand keeps para-xylene balances tight
- 4.2.3 Automotive and construction rebound lifts TDI/paints solvent demand
- 4.2.4 Refinery-petchem integration unlocking captive BTX extraction
- 4.2.5 Pyro-plastic and biomass routes commercialising drop-in BTX
- 4.3 Market Restraints
- 4.3.1 Carcinogenicity-driven occupational exposure curbs
- 4.3.2 Paints/adhesives VOC regulations favour low-aromatic blends
- 4.3.3 Octane-for-aromatics trade-off in gasoline pool after E10 rollout
- 4.4 Value Chain Analysis
- 4.5 Porter's Five Forces
- 4.5.1 Bargaining Power of Suppliers
- 4.5.2 Bargaining Power of Buyers
- 4.5.3 Threat of New Entrants
- 4.5.4 Threat of Substitutes
- 4.5.5 Degree of Competition
5 Market Size and Growth Forecasts (Volume)
- 5.1 By Type
- 5.1.1 Benzene
- 5.1.2 Toluene
- 5.1.3 Xylene
- 5.1.3.1 Ortho-xylene
- 5.1.3.2 Meta-xylene
- 5.1.3.3 Para-xylene
- 5.2 By Application
- 5.2.1 Benzene
- 5.2.1.1 Ethylbenzene
- 5.2.1.2 Cyclohexane
- 5.2.1.3 Alkylbenzene
- 5.2.1.4 Cumene
- 5.2.1.5 Nitrobenzene
- 5.2.1.6 Other Applications
- 5.2.2 Toluene
- 5.2.2.1 Paints and Coatings
- 5.2.2.2 Adhesives and Inks
- 5.2.2.3 Explosives
- 5.2.2.4 Chemical Intermediates
- 5.2.3 Xylenes
- 5.2.3.1 Solvents
- 5.2.3.2 Monomer
- 5.2.3.3 Other Applications
- 5.2.1 Benzene
- 5.3 By Geography
- 5.3.1 Asia-Pacific
- 5.3.1.1 China
- 5.3.1.2 India
- 5.3.1.3 Japan
- 5.3.1.4 South Korea
- 5.3.1.5 Rest of Asia-Pacific
- 5.3.2 North America
- 5.3.2.1 United States
- 5.3.2.2 Canada
- 5.3.2.3 Mexico
- 5.3.3 Europe
- 5.3.3.1 Germany
- 5.3.3.2 United Kingdom
- 5.3.3.3 Italy
- 5.3.3.4 France
- 5.3.3.5 Rest of Europe
- 5.3.4 South America
- 5.3.4.1 Brazil
- 5.3.4.2 Argentina
- 5.3.4.3 Rest of South America
- 5.3.5 Middle East and Africa
- 5.3.5.1 Saudi Arabia
- 5.3.5.2 South Africa
- 5.3.5.3 Rest of Middle East and Africa
- 5.3.1 Asia-Pacific
6 Competitive Landscape
- 6.1 Market Concentration
- 6.2 Strategic Moves
- 6.3 Market Share (%)/Ranking Analysis
- 6.4 Company Profiles (includes Global level Overview, Market level overview, Core Segments, Financials as available, Strategic Information, Market Rank/Share, Products and Services, Recent Developments)
- 6.4.1 BASF
- 6.4.2 BP p.l.c.
- 6.4.3 Chevron Phillips Chemical Company LLC
- 6.4.4 China Petrochemical Corporation
- 6.4.5 China National offshore Oil Corporation (CNOOC)
- 6.4.6 Dow
- 6.4.7 ENEOS Corporation
- 6.4.8 Exxon Mobil Corporation
- 6.4.9 Formosa Plastics Group.
- 6.4.10 GS Caltex Corporation
- 6.4.11 INEOS
- 6.4.12 IRPC Public Company Limited
- 6.4.13 JFE Chemical Corporation
- 6.4.14 JX Nippon Oil & Gas Exploration Corporation (ENEOS)
- 6.4.15 Mitsubishi Gas Chemical Trading, Inc.
- 6.4.16 MOLGROUP
- 6.4.17 OCI COMPANY Ltd.
- 6.4.18 Reliance Industries Limited
- 6.4.19 SABIC
- 6.4.20 Shell plc
- 6.4.21 S-OIL CORPORATION
- 6.4.22 TotalEnergies
- 6.4.23 YEOCHUN NCC CO., LTD.
7 Market Opportunities and Future Outlook
- 7.1 White-space and Unmet-need Assessment
 石油化学泵浦市场:按泵浦类型、材质、流量、压力范围、应用和最终用户划分,全球预测(2026-2032年)
 基础石油化学产品市场分析及预测(至2035年):类型、产品、应用、技术、终端用户、製程、材料类型、组件和功能石油化学市场分析及预测(至2035年):依类型、产品类型、应用、技术、最终用户、组件、製程、材料类型、安装类型划分
 石油化学市场报告:按类型、应用、最终用途行业和地区划分(2026-2034年)
 2026年全球石化市场报告
 石油化学市场-全球产业规模、份额、趋势、机会及预测(依产品、应用、区域及竞争格局划分,2021-2031年)
 基础石化产品市场规模、份额及成长分析(按类型、生产平台、终端用户产业、应用、永续和地区划分)-2026-2033年产业预测日本石化市场报告(按类型、应用、最终用途行业和地区划分,2026-2034年)
 直接石油化学产品(OTC)市场规模、份额和成长分析(按产品类型、技术、最终用户和地区划分)—产业预测(2026-2033 年)
 石化市场-2025-2030年预测