


 |
市场调查报告书
商品编码
1937425
亚太地区绿建筑:市场占有率分析、产业趋势与统计、成长预测(2026-2031年)Asia-Pacific Green Buildings - Market Share Analysis, Industry Trends & Statistics, Growth Forecasts (2026 - 2031) |
||||||
※ 本网页内容可能与最新版本有所差异。详细情况请与我们联繫。
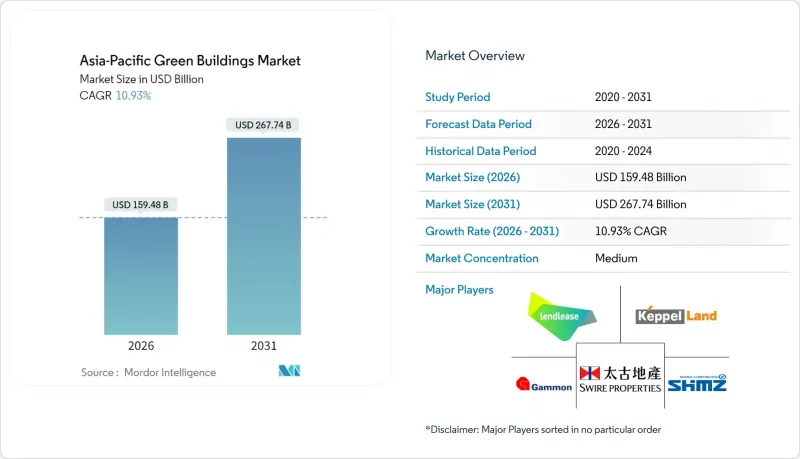
亚太地区绿建筑市场在 2025 年的价值为 1,437.7 亿美元,预计到 2031 年将达到 2,677.4 亿美元,而 2026 年为 1,594.8 亿美元。
预计在预测期(2026-2031 年)内,复合年增长率将达到 10.93%。
政策趋紧、企业持续推动净零排放目标以及能源价格波动带来的实际成本,正将绿色特性从附加的额外功能转变为核心计划要求。中国在规模方面保持主导,而印度13.02%的年复合成长率加速成长,凸显了市场重心转移到快速成长的南亚需求中心的趋势。楼宇系统整合、智慧暖通空调系统的普及以及日趋成熟的绿色金融,正在支撑着强大的供应商体系,并缓解短期供应链摩擦的影响。由于认证障碍有利于现有企业,市场竞争强度适中,但数位化颠覆者正透过「性能即服务」模式重塑价值获取方式。
亚太绿建筑市场趋势与洞察
日益严格的建筑节能规范推动合规主导型成长
诸如中国的GB 55015-2021、日本修订的《建筑节能法》以及印度的2024年节能建筑规范等强制性标准,正在扩大法规要求采用绿色技术的计划范围。开发人员现在在概念设计阶段就引入效能建模,因为不符合标准可能会导致计划核准延迟和转售受限。因此,预製建筑外墙板製造商和智慧空调系统供应商的订单稳定成长,产能不断扩大,单位成本压力也随之缓解。此外,中国地方政府正在补贴入住后的能源审核,支持从施工阶段标准转向使用中性能指标。这些协同效应正在建构一个相互促进的监管、检验和采购标准生态系统,加速亚太绿建筑市场从自愿采用阶段走向规范化。
企业ESG政策转变投资组合策略
凯德集团的净零碳排放承诺和太古地产12亿美元的可持续发展挂钩贷款,充分体现了资金筹措条款如今如何与可衡量的建筑性能挂钩。亚洲主要开发人员的负责人薪酬与科学碳目标倡议的里程碑挂钩,脱碳目标也已纳入企业管治。大型跨国公司正在利用标准化的建筑评估模板,并将其推广至本地供应链,迫使分包商提升自身能力,否则将面临关闭的风险。在整个专案组合中采购高效能冷却器和智慧感测器,可以享受批量折扣,降低小规模计划的准入门槛。这些网路效应正在将亚太绿色建筑产业的潜在市场远远扩展到旗舰计划之外。
高昂的资本成本溢价限制了次市场的采用。
在印尼,由于建筑幕墙构件依赖进口且缺乏本地检测设施,成本溢价高达30%。小型银行因主要城市以外地区认证建筑的转售情况不佳,在其建筑贷款中加入了高风险溢价。开发商为了确保预期收益,降低了建筑规格,从而减少了对环境的影响并影响了市场估值。缺乏可靠的次市场数据迫使估值专家采用保守的估值假设,导致资金筹措持续面临挑战。这种情况很可能在短期内限制亚太地区绿建筑市场在价格敏感型地区的渗透。
细分市场分析
预计到2025年,建筑系统领域将占亚太绿建筑市场份额的40.85%,并在2031年之前以11.73%的复合年增长率持续成长。这一成长主要归功于智慧暖通空调平台,该平台应用人工智慧演算法进行预测性维护和即时负载平衡,从而显着降低能源消耗强度。供应商正在整合现场太阳能发电、电池储能和需量反应功能,使建筑物能够作为灵活的电网参与者而非静态的消费者发挥作用。外墙产品也紧跟着,建筑围护结构的创新兼顾了隔热性和美观性,适用于不同的气候带。室内产品则着重提升居住者的健康,例如采用低挥发性有机化合物(VOC)材料和昼夜节律照明,以符合后疫情时代人们对健康生活的期望。新兴的「其他」类别,包括建筑整合光伏(BIPV),凸显了一系列创新材料的涌现,这些材料将继续重塑亚太绿色建筑市场。
整合平台透过将控制功能整合到统一的控制面板中,降低了试运行的复杂性。对于肩负日益增长的报告义务的设施管理团队而言,这项特性越来越受到重视。标准化的数位双胞胎支援远端效能审核,从而提升了系统供应商的业务收益。随着碳定价机制的日益普及,速率优化控制演算法已成为采购竞标中的关键差异化因素,进一步增强了整合建筑系统供应商的竞争优势。儘管外墙和内墙产品保持成长势头,但其年增长率仍落后于领先的系统类别,而係统类别目前已成为亚太绿建筑市场的核心收入驱动力。
其他福利:
- Excel格式的市场预测(ME)表
- 分析师支持(3个月)
目录
第一章 引言
- 研究假设和市场定义
- 调查范围
第二章调查方法
第三章执行摘要
第四章 市场洞察与动态
- 市场概览
- 市场驱动因素
- 加强建筑节能规范、绿色标准及长期脱碳目标
- 企业环境、社会及公司治理/净零排放目标推动投资组合整体评等上调
- 能源价格波动以及对降低生命週期营运成本的日益重视
- 扩大绿色金融(税收优惠、绿色债券、永续发展挂钩贷款)
- 支持市场对认证资产的偏好以及相关的租金和估值溢价
- 市场限制
- 次市场初始资本成本高,且投资回收期不确定性。
- 认证材料和技术方面的技能短缺和供需失衡
- 各司法管辖区法规碎片化、奖励不统一、评估方法不一致。
- 价值/供应链分析
- 监管环境
- 技术展望
- 波特五力模型
- 供应商的议价能力
- 买方的议价能力
- 新进入者的威胁
- 替代品的威胁
- 竞争对手之间的竞争
第五章 市场规模与成长预测
- 依产品类型
- 外饰商品
- 室内产品
- 建筑系统
- 其他的
- 最终用户
- 住宅
- 公寓和住宅
- 别墅及独户房屋住宅
- 商业
- 办公室
- 零售
- 后勤
- 公共利益组织
- 其他(工业地产、饭店地产等)
- 住宅
- 施工阶段
- 新建工程
- 维修
- 按国家/地区
- 中国
- 印度
- 日本
- 韩国
- 澳洲
- 印尼
- 亚太其他地区
第六章 竞争情势
- 市场集中度
- 策略趋势
- 市占率分析
- 公司简介
- Lendlease
- Keppel Land
- Shimizu Corporation
- Swire Properties
- Gammon Construction
- CapitaLand
- Sino Group
- WSP
- Obayashi Corporation
- Sun Hung Kai Properties
- Mitsubishi Estate
- Daiwa House
- China State Construction Eng. Corp.
- CSCEC Green Building
- SK Ecoplant
- LIXIL Group
- Kingspan Group
- Tata Projects
- Gensler
- GreenA Consultants
第七章 市场机会与未来展望
The Asia-Pacific Green Buildings Market was valued at USD 143.77 billion in 2025 and estimated to grow from USD 159.48 billion in 2026 to reach USD 267.74 billion by 2031, at a CAGR of 10.93% during the forecast period (2026-2031).
Heightened policy stringency, sustained corporate net-zero pledges, and the tangible cost of energy volatility now position green specifications as baseline project requirements rather than premium add-ons. China retains scale leadership, while India's accelerating 13.02% CAGR underscores a geographic pivot toward fast-growing South Asian demand centers. Building systems integration, smart-HVAC adoption, and maturing green finance underpin robust supplier pipelines that dilute the impact of short-term supply chain friction. Competitive intensity remains moderate as certification hurdles favor incumbents, yet digital disruptors are reshaping value capture through performance-as-a-service models.
Asia-Pacific Green Buildings Market Trends and Insights
Strengthening Building-Energy Codes Drive Compliance-Led Growth
Mandatory codes such as China's GB 55015-2021, Japan's revised Building Energy Efficiency Act, and India's 2024 Energy Conservation Building Code enlarge the addressable pool of projects that must integrate green technologies by statute. Developers now incorporate performance modeling during concept design because non-compliance risks project approval delays, and resale limitations. Prefabricated facade makers and smart-HVAC suppliers consequently enjoy more stable order books, prompting capacity expansions that ease unit-cost pressures. Provincial authorities in China further subsidize post-occupancy energy audits, reinforcing the shift from construction-stage criteria to in-use performance metrics. The cumulative effect is a self-reinforcing ecosystem in which regulation, verification, and procurement standards accelerate the APAC Green Buildings market beyond voluntary adoption.
Corporate ESG Mandates Transform Portfolio Strategies
CapitaLand's net-zero carbon pledge and Swire Properties' USD 1.2 billion sustainability-linked loan exemplify how financing terms now hinge on measurable building performance. Executive compensation at leading Asian developers is tied to the Science Based Targets initiative milestones, embedding decarbonization goals in corporate governance. Large multinationals leverage standardized building assessment templates that cascade to local supply chains, forcing subcontractors to upgrade capabilities or face disqualification. Cross-portfolio procurement of high-efficiency chillers and smart sensors yields volume discounts, lowering adoption thresholds for smaller projects. The resulting network effects expand the APAC Green Buildings industry's serviceable obtainable market well beyond marquee flagship developments.
Capital Cost Premiums Constrain Secondary-Market Adoption
In Indonesia, cost premiums of up to 30% persist due to imported facade components and limited local testing facilities. Smaller banks price higher risk premiums into construction loans because resale benchmarks for certified buildings remain thin outside capital cities. Developers compromise on specification depth to preserve pro-forma returns, diluting environmental outcomes and market perception. Absent robust secondary-market data, valuation professionals default to conservative appraisal assumptions, perpetuating financing challenges. This dynamic tempers near-term APAC Green Buildings market penetration in price-sensitive locales.
Other drivers and restraints analyzed in the detailed report include:
- Energy Cost Volatility Accelerates Lifecycle Value Recognition
- Green Finance Mechanisms Enable Capital Formation
- Skills Gaps and Supply Chain Constraints Limit Execution Capacity
For complete list of drivers and restraints, kindly check the Table Of Contents.
Segment Analysis
Building Systems commanded 40.85% of the APAC Green Buildings market share in 2025, and the segment is expected to escalate at an 11.73% CAGR through 2031. This growth stems from intelligent HVAC platforms that apply artificial-intelligence algorithms for predictive maintenance and real-time load balancing, delivering measurable reductions in energy intensity. Suppliers integrate on-site solar, battery storage, and demand-response capabilities, enabling buildings to act as flexible grid participants rather than static consumers. Exterior Products follow in scale as building-envelope innovations combine thermal resistance with aesthetic versatility suited to diverse climatic zones. Interior Products advance occupant-wellness attributes, such as low-VOC materials and circadian lighting, aligning with post-pandemic health expectations. An emergent "Others" cluster, including building-integrated photovoltaics, underscores a pipeline of disruptive materials that will continue to reshape the APAC Green Buildings market.
Integrated platforms also lower commissioning complexity by consolidating controls under unified dashboards, a feature increasingly valued by facilities-management teams tasked with meeting escalating reporting obligations. Standardized digital twins facilitate remote performance auditing, strengthening post-handover service revenues for system vendors. As carbon-pricing schemes spread, tariff-optimized control algorithms become critical differentiators in procurement tenders, amplifying the competitive moat around integrated Building Systems providers. Although Exterior and Interior Products maintain momentum, their annual gains trail the flagship Systems category, which now represents the core revenue engine of the APAC Green Buildings market.
The Asia-Pacific Green Buildings Market Report is Segmented by Product Type (Exterior Products, Interior Products, Building Systems, Others), by End User (Residential - Apartments & Condominiums, Villas & Landed Houses; Commercial - Office, and More), by Construction Stage (New Construction, Renovation), and by Country (China, India, Japan, South Korea, and More). The Market Forecasts are Provided in Terms of Value (USD).
List of Companies Covered in this Report:
- Lendlease
- Keppel Land
- Shimizu Corporation
- Swire Properties
- Gammon Construction
- CapitaLand
- Sino Group
- WSP
- Obayashi Corporation
- Sun Hung Kai Properties
- Mitsubishi Estate
- Daiwa House
- China State Construction Eng. Corp.
- CSCEC Green Building
- SK Ecoplant
- LIXIL Group
- Kingspan Group
- Tata Projects
- Gensler
- GreenA Consultants
Additional Benefits:
- The market estimate (ME) sheet in Excel format
- 3 months of analyst support
TABLE OF CONTENTS
1 Introduction
- 1.1 Study Assumptions & Market Definition
- 1.2 Scope of the Study
2 Research Methodology
3 Executive Summary
4 Market Insights and Dynamics
- 4.1 Market Overview
- 4.2 Market Drivers
- 4.2.1 Strengthening building-energy codes, green standards, and long-term decarbonization targets
- 4.2.2 Corporate ESG/net-zero commitments driving portfolio-wide upgrades
- 4.2.3 Energy price volatility and emphasis on lifecycle operating cost reductions
- 4.2.4 Expanding green finance (tax incentives, green bonds, sustainability-linked loans)
- 4.2.5 Market preference for certified assets, supporting rent and valuation premiums
- 4.3 Market Restraints
- 4.3.1 Higher upfront capital costs and uncertain payback in secondary markets
- 4.3.2 Skills shortages and uneven availability of certified materials/technologies
- 4.3.3 Fragmented regulations, split incentives, and inconsistent valuation practices across jurisdictions
- 4.4 Value / Supply-Chain Analysis
- 4.5 Regulatory Landscape
- 4.6 Technological Outlook
- 4.7 Porter's Five Forces
- 4.7.1 Bargaining Power of Suppliers
- 4.7.2 Bargaining Power of Buyers
- 4.7.3 Threat of New Entrants
- 4.7.4 Threat of Substitutes
- 4.7.5 Competitive Rivalry
5 Market Size & Growth Forecasts (Value, USD)
- 5.1 By Product Type
- 5.1.1 Exterior Products
- 5.1.2 Interior Products
- 5.1.3 Building Systems
- 5.1.4 Others
- 5.2 By End User
- 5.2.1 Residential
- 5.2.1.1 Apartments & Condominiums
- 5.2.1.2 Villas & Landed Houses
- 5.2.2 Commercial
- 5.2.2.1 Office
- 5.2.2.2 Retail
- 5.2.2.3 Logistics
- 5.2.2.4 Institutional
- 5.2.2.5 Others (industrial real estate, hospitality real estate, etc.)
- 5.2.1 Residential
- 5.3 By Construction Stage
- 5.3.1 New Construction
- 5.3.2 Renovation
- 5.4 By Country
- 5.4.1 China
- 5.4.2 India
- 5.4.3 Japan
- 5.4.4 South Korea
- 5.4.5 Australia
- 5.4.6 Indonesia
- 5.4.7 Rest of Asia-Pacific
6 Competitive Landscape
- 6.1 Market Concentration
- 6.2 Strategic Moves
- 6.3 Market Share Analysis
- 6.4 Company Profiles (includes Global level Overview, Market level overview, Core Segments, Financials as available, Strategic Information, Products & Services, and Recent Developments)
- 6.4.1 Lendlease
- 6.4.2 Keppel Land
- 6.4.3 Shimizu Corporation
- 6.4.4 Swire Properties
- 6.4.5 Gammon Construction
- 6.4.6 CapitaLand
- 6.4.7 Sino Group
- 6.4.8 WSP
- 6.4.9 Obayashi Corporation
- 6.4.10 Sun Hung Kai Properties
- 6.4.11 Mitsubishi Estate
- 6.4.12 Daiwa House
- 6.4.13 China State Construction Eng. Corp.
- 6.4.14 CSCEC Green Building
- 6.4.15 SK Ecoplant
- 6.4.16 LIXIL Group
- 6.4.17 Kingspan Group
- 6.4.18 Tata Projects
- 6.4.19 Gensler
- 6.4.20 GreenA Consultants
7 Market Opportunities & Future Outlook
 2026年全球单户住宅绿建筑市场报告2026年全球多户住宅绿建筑市场报告2026年全球绿建筑市场报告2026年全球非住宅绿建筑市场报告2026年全球绿建筑LEED咨询市场报告
 简易包装市场规模、份额、成长及全球产业分析:按类型、应用和地区分類的洞察,2026-2034 年预测
 绿色建筑市场-全球产业规模、份额、趋势、机会和预测:按产品类型、应用、地区和竞争格局划分,2021-2031年
 绿色建筑幕墙市场:按类型、植被类型、应用和区域划分
 绿建筑市场机会、成长驱动因素、产业趋势分析及预测(2025-2034年)
 客製化包装市场(按包装类型、材料、印刷技术和应用)—2025-2030 年全球预测