


 |
市场调查报告书
商品编码
1938979
美国LED照明:市场占有率分析、产业趋势与统计、成长预测(2026-2031年)US LED Lighting - Market Share Analysis, Industry Trends & Statistics, Growth Forecasts (2026 - 2031) |
||||||
※ 本网页内容可能与最新版本有所差异。详细情况请与我们联繫。
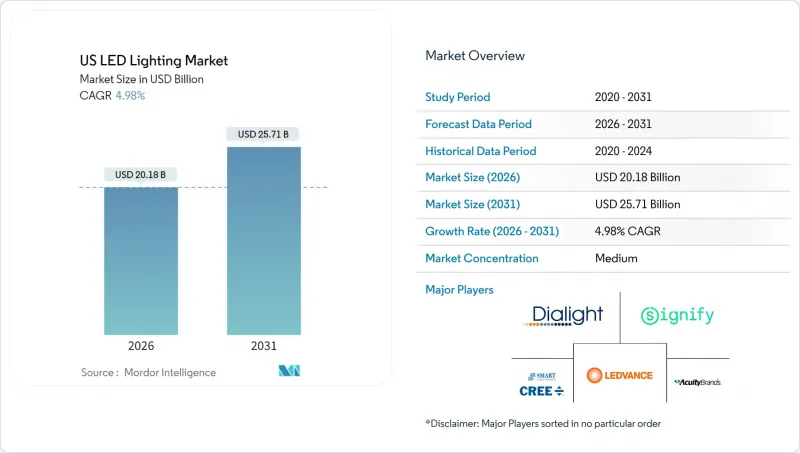
据估计,美国 LED 照明市场在 2026 年的价值将达到 201.8 亿美元,高于 2025 年的 192.2 亿美元,预计到 2031 年将达到 257.1 亿美元。
预计从 2026 年到 2031 年,其复合年增长率将达到 4.98%。
联邦政府将于2023年逐步淘汰白炽灯和卤素灯,随后加州、佛蒙特州和华盛顿州也相继禁止使用大多数萤光管,这些措施透过创造替代需求,持续推动灯具销量成长。市政建筑规范如今更加重视可控灯具而非简单的能源效率提升,鼓励建筑师指定使用配备感测器和连网驱动器的灯具。财富500强企业正在加速更换传统照明设备,以达到碳排放目标,即使投资回报并不理想,他们也已将采购重点转向已被证实有效的排放方案。同时,对加拿大和墨西哥进口产品征收25%的关税,以及对中国製造的零件额外附加税10%的关税,正在重塑市场竞争格局,促使製造商实现供应商多元化并将零件生产迁回国内。
美国LED照明市场趋势与洞察
加速淘汰传统照明标准
联邦法规禁止使用光效低于每瓦45流明的灯具,促使消费者和企业转向光效为每瓦80-100流明的LED灯。加州将于2024年生效的萤光管禁令,鼓励办公室和零售商店提前更换灯具,进一步巩固了美国LED照明市场维修需求的主导地位。由于无论灯具使用年限长短,都必须遵守该规定,折旧免税额週期脱钩。关税提高了进口灯具的成本,使供应链更短的国内製造商获得了价格优势。
联邦和州政府的能源效率奖励计划
《通膨控制法案》拨款88亿美元用于住宅能源补贴,符合资格的LED产品每户最高可获得200美元补贴。商业不动产所有者如果其安装的照明系统能源效率超过标准规定的水平,则可根据第179D条规定,每平方英尺最高可扣除5美元,该条款有利于联网照明设备。加州第24号法规2025年版强制要求采用日间行车灯采集和先进控制技术,从而加速推广内建感测器和无线驱动器的照明设备。
重要基板供应链的波动
2025年3月生效的关税政策将加拿大和墨西哥的进口关税提高至25%,动摇了跨国加工经济的根基。同时,中国製造的LED驱动器关税也提高至20%,导緻美国组装的零件成本上升10%至15%。目前,各公司正竞相寻找越南和印度的合格供应商,但通常需要18个月的搬迁週期,这使得它们极易受到价格波动和库存短缺的影响。
细分市场分析
到2025年,灯具类产品将占据美国LED照明市场62.95%的主导份额,因为建筑师和工程师会指定使用内建感测器的灯具来侦测人员活动并符合日光法规。整合系统简化了试运行和保固流程,因此灯具类产品的成长将保持稳定。同时,由于白炽灯和萤光被禁用,灯具类产品满足了市场即时需求,其复合年增长率将更高,达到6.72%。由于美国LED照明市场主要由维修需求主导,儘管平均售价有所下降,但灯具的销售量依然强劲。
随着建筑业主对详细能耗数据的需求日益增长,板载晶片阵列和无线控制模组的创新使照明灯具更有价值。灯具供应商正瞄准学校和医疗机构,透过通用调光相容性和抗衝击涂层来捍卫市场份额。在这两个细分市场中,随着能源效率提升空间逐渐缩小,以及园艺照明和人性化的照明等特殊领域的应用日益广泛,预计美国LED照明市场规模将持续成长。
到2025年,批发和零售将占销售额的54.85%,但随着承包商采用直接出货模式,电子商务将以5.21%的复合年增长率成长。这种转变在住宅DIY市场和小规模商业设施中最为显着,因为标准化SKU非常适合规模较小的经销网络。对于需要光度设计和申请补助金的大型计划而言,直接销售仍然很重要,但日常维护库存的订购越来越多地透过入口网站完成。拥有强大的线上配置工具和即时库存数据的製造商将在美国LED照明市场占据更大的份额。
传统经销商正透过提供打包服务来应对这项挑战,例如设计协助、补贴申请协助和现场启动服务。一些经销商也收购了负责资产帐簿管理和预测性维护的软体公司,以建立结合实体价值和数位价值的混合提案。随着关税成本的波动,线上平台透过提供透明的价格来影响消费者的购买行为,而对于复杂的安装项目而言,现场服务仍然是首要考虑因素。
其他福利:
- Excel格式的市场预测(ME)表
- 分析师支持(3个月)
目录
第一章 引言
- 研究假设和市场定义
- 调查范围
第二章调查方法
第三章执行摘要
第四章 市场情势
- 市场概览
- 市场驱动因素
- 加速淘汰传统照明标准
- 联邦和州节能奖励计划
- LED价格下降和发光效率提高
- 公司必须进行以ESG主导维修
- 微型LED试生产的技术进展
- 地方政府层级应制定更严格的建筑能源标准
- 市场限制
- 关键基板供应链波动性
- 特殊用途的初始成本较高
- 中国製造的LED组件关税存在不确定性
- 对过度照明的担忧促成了「暗夜星空」条例的出台
- 产业价值链分析
- 宏观经济因素的影响
- 监管环境
- 技术展望
- 波特五力分析
- 新进入者的威胁
- 供应商的议价能力
- 买方的议价能力
- 替代品的威胁
- 竞争对手之间的竞争
第五章 市场规模与成长预测
- 依产品类型
- 灯
- 照明灯具/照明设备
- 透过分销管道
- 直销
- 批发和零售
- 电子商务
- 按安装类型
- 新安装
- 维修和安装
- 透过使用
- 商业办公
- 零售店
- 饭店业
- 工业的
- 高速公路/普通道路
- 大楼
- 公共设施
- 医院
- 园艺和花园
- 住宅
- 车
- 其他(化工、石油天然气、农业)
- 最终用户
- 室内的
- 户外
- 车
第六章 竞争情势
- 市场集中度
- 策略趋势
- 市占率分析
- 公司简介
- Acuity Brands Lighting Inc.
- Signify North America Corp.
- Cree LED Inc.
- GE Current, a Daintree company
- Hubbell Lighting Inc.
- Cooper Lighting Solutions LLC
- LSI Industries Inc.
- RAB Lighting Inc.
- MaxLite Inc.
- LEDVANCE LLC
- Revolution Lighting Technologies Inc.
- Dialight PLC(US operations)
- Orion Energy Systems Inc.
- Energy Focus Inc.
- Musco Sports Lighting LLC
- Lithonia Lighting(Acuity Brands)
- NICOR Inc.
- Gillux Lighting LLC
- Lighting Science Group Corp.
- Growlite(Barron Lighting Group)
- Albeo Technologies Inc.
- Flex Lighting Solutions Inc.
- Sunoptics(Signify)
- Nora Lighting LLC
第七章 市场机会与未来展望
The United States LED lighting market size in 2026 is estimated at USD 20.18 billion, growing from 2025 value of USD 19.22 billion with 2031 projections showing USD 25.71 billion, growing at 4.98% CAGR over 2026-2031.
Federal rules that eliminated incandescent and halogen lamps in 2023, followed by bans on most fluorescent tubes in California, Vermont, and Washington, created replacement demand that continues to lift unit volumes. Municipal building codes now give more credit for controllable fixtures than for bare efficacy gains, pushing architects to specify luminaires that include sensors and networked drivers. Fortune 500 companies are increasingly replacing legacy lighting to meet their carbon targets, even when payback calculations are unfavorable, redirecting procurement priorities toward verified emission reductions. At the same time, tariffs of 25% on Canadian and Mexican imports, along with an additional 10% surcharge on Chinese sub-components, are nudging manufacturers to diversify their suppliers or reshore sub-assembly, reshaping the competitive landscape.
US LED Lighting Market Trends and Insights
Accelerated Phase-Out of Legacy Lighting Standards
Federal rules that prohibit lamps delivering fewer than 45 lumens per watt have prompted consumers and businesses to shift toward LEDs that deliver 80-100 lumens per watt. California's fluorescent tube ban, effective in 2024, triggered early replacements in offices and retail spaces, reinforcing the dominance of retrofitting in the United States' LED lighting market. Because compliance is mandatory regardless of fixture age, the rule decouples upgrade timing from depreciation schedules. Domestic producers with shorter supply lines gained price leverage as tariffs inflated the costs of imported lamps.
Federal and State Incentive Programs for Energy Efficiency
The Inflation Reduction Act allocates USD 8.8 billion for Home Energy Rebates, which include up to USD 200 per household for qualified LED products. Commercial property owners can deduct up to USD 5.00 per square foot under Section 179D when installed systems surpass code-mandated efficiency, a provision that favors networked luminaires. Title 24 2025 in California will require daylight harvesting and advanced controls, accelerating the uptake of fixtures that ship with embedded sensors and wireless drivers.
Supply-Chain Volatility for Critical Substrates
Tariffs introduced in March 2025 raised duties on Canadian and Mexican imports to 25%, undermining cross-border maquiladora economics. Simultaneously, the surcharge on Chinese LED drivers increased to 20%, raising component costs by 10-15% for U.S. assemblers. Firms now rush to qualify suppliers in Vietnam and India, but the typical 18-month relocation timeline leaves them vulnerable to price fluctuations and inventory shortages.
Other drivers and restraints analyzed in the detailed report include:
- Corporate ESG-Driven Retrofitting Mandates
- Stricter Building-Energy Codes at Municipality Level
- Tariff Uncertainty on Chinese LED Components
For complete list of drivers and restraints, kindly check the Table Of Contents.
Segment Analysis
The luminaires category accounted for a dominant 62.95% share of the United States' LED lighting market in 2025, as architects and engineers specified fixtures with onboard sensors that meet occupancy and daylighting mandates. Growth continues steadily because integrated systems simplify commissioning and warranty. By contrast, lamps post a faster 6.72% CAGR, as they satisfy the immediate needs arising from the bans on incandescent and fluorescent bulbs. The retrofit-heavy nature of the United States LED lighting market keeps lamp volumes buoyant even though average selling prices trend downward.
Innovation in chip-on-board arrays and wireless control modules positions luminaires to capture incremental value as building owners seek granular energy data. Lamp vendors defend their market share through universal dimming compatibility and shatter-resistant coatings, targeting schools and healthcare facilities. Across both sub-segments, the United States LED lighting market size will expand as efficacy gains become increasingly thin, but adoption widens in specialty niches such as grow lights and human-centric lighting.
Wholesale retail retained 54.85% of sales in 2025, yet e-commerce is advancing at a 5.21% CAGR as contractors embrace direct-ship models. The shift is most evident in the residential DIY and small commercial space, where standardized SKUs fit parcel networks. Direct sales remain critical for large projects that require photometric design and rebate paperwork, but web portals are increasingly handling repeat orders for maintenance stock. Manufacturers with robust online configurators and live inventory data are capturing a larger share of the United States' LED lighting market.
Traditional distributors respond by bundling design-assist, rebate administration, and on-site startup services. Some have acquired software firms that manage asset registers and predictive maintenance, creating hybrid physical-digital value propositions. As tariff costs fluctuate, online platforms provide transparent pricing, influencing buyer behavior in a market that still values local service for complex builds.
The United States LED Lighting Market Report is Segmented by Product Type (Lamps, and Luminaires/Fixtures), Distribution Channel (Direct Sales, Wholesale/Retail, and E-Commerce), Installation Type (New Installation, and Retrofit Installation), Application (Commercial Offices, Retail Stores, and More), and End User (Indoor, Outdoor, and Automotive). The Market Forecasts are Provided in Terms of Value (USD).
List of Companies Covered in this Report:
- Acuity Brands Lighting Inc.
- Signify North America Corp.
- Cree LED Inc.
- GE Current, a Daintree company
- Hubbell Lighting Inc.
- Cooper Lighting Solutions LLC
- LSI Industries Inc.
- RAB Lighting Inc.
- MaxLite Inc.
- LEDVANCE LLC
- Revolution Lighting Technologies Inc.
- Dialight PLC (U.S. operations)
- Orion Energy Systems Inc.
- Energy Focus Inc.
- Musco Sports Lighting LLC
- Lithonia Lighting (Acuity Brands)
- NICOR Inc.
- Gillux Lighting LLC
- Lighting Science Group Corp.
- Growlite (Barron Lighting Group)
- Albeo Technologies Inc.
- Flex Lighting Solutions Inc.
- Sunoptics (Signify)
- Nora Lighting LLC
Additional Benefits:
- The market estimate (ME) sheet in Excel format
- 3 months of analyst support
TABLE OF CONTENTS
1 INTRODUCTION
- 1.1 Study Assumptions and Market Definition
- 1.2 Scope of the Study
2 RESEARCH METHODOLOGY
3 EXECUTIVE SUMMARY
4 MARKET LANDSCAPE
- 4.1 Market Overview
- 4.2 Market Drivers
- 4.2.1 Accelerated phase-out of legacy lighting standards
- 4.2.2 Federal and state incentive programs for energy efficiency
- 4.2.3 Declining LED prices and higher luminous efficacy
- 4.2.4 Corporate ESG-driven retrofitting mandates
- 4.2.5 Micro-LED pilot production breakthroughs
- 4.2.6 Stricter building-energy codes at municipality level
- 4.3 Market Restraints
- 4.3.1 Supply-chain volatility for critical substrates
- 4.3.2 High upfront cost for specialty applications
- 4.3.3 Tariff uncertainty on Chinese LED components
- 4.3.4 Over-illumination concerns driving "dark-sky" ordinances
- 4.4 Industry Value Chain Analysis
- 4.5 Impact of Macroeconomic Factors
- 4.6 Regulatory Landscape
- 4.7 Technological Outlook
- 4.8 Porter's Five Forces Analysis
- 4.8.1 Threat of New Entrants
- 4.8.2 Bargaining Power of Suppliers
- 4.8.3 Bargaining Power of Buyers
- 4.8.4 Threat of Substitutes
- 4.8.5 Competitive Rivalry
5 MARKET SIZE AND GROWTH FORECASTS (VALUE)
- 5.1 By Product Type
- 5.1.1 Lamps
- 5.1.2 Luminaires / Fixtures
- 5.2 By Distribution Channel
- 5.2.1 Direct Sales
- 5.2.2 Wholesale Retail
- 5.2.3 E-commerce
- 5.3 By Installation Type
- 5.3.1 New Installation
- 5.3.2 Retrofit Installation
- 5.4 By Application
- 5.4.1 Commercial Offices
- 5.4.2 Retail Stores
- 5.4.3 Hospitality
- 5.4.4 Industrial
- 5.4.5 Highway and Roadway
- 5.4.6 Architectural
- 5.4.7 Public Places
- 5.4.8 Hospitals
- 5.4.9 Horticulture Gardens
- 5.4.10 Residential
- 5.4.11 Automotive
- 5.4.12 Others (Chemicals, Oil and Gas, Agriculture)
- 5.5 By End User
- 5.5.1 Indoor
- 5.5.2 Outdoor
- 5.5.3 Automotive
6 COMPETITIVE LANDSCAPE
- 6.1 Market Concentration
- 6.2 Strategic Moves
- 6.3 Market Share Analysis
- 6.4 Company Profiles (includes Global level Overview, Market level overview, Core Segments, Financials as available, Strategic Information, Market Rank/Share for key companies, Products and Services, and Recent Developments)
- 6.4.1 Acuity Brands Lighting Inc.
- 6.4.2 Signify North America Corp.
- 6.4.3 Cree LED Inc.
- 6.4.4 GE Current, a Daintree company
- 6.4.5 Hubbell Lighting Inc.
- 6.4.6 Cooper Lighting Solutions LLC
- 6.4.7 LSI Industries Inc.
- 6.4.8 RAB Lighting Inc.
- 6.4.9 MaxLite Inc.
- 6.4.10 LEDVANCE LLC
- 6.4.11 Revolution Lighting Technologies Inc.
- 6.4.12 Dialight PLC (U.S. operations)
- 6.4.13 Orion Energy Systems Inc.
- 6.4.14 Energy Focus Inc.
- 6.4.15 Musco Sports Lighting LLC
- 6.4.16 Lithonia Lighting (Acuity Brands)
- 6.4.17 NICOR Inc.
- 6.4.18 Gillux Lighting LLC
- 6.4.19 Lighting Science Group Corp.
- 6.4.20 Growlite (Barron Lighting Group)
- 6.4.21 Albeo Technologies Inc.
- 6.4.22 Flex Lighting Solutions Inc.
- 6.4.23 Sunoptics (Signify)
- 6.4.24 Nora Lighting LLC
7 MARKET OPPORTUNITIES AND FUTURE OUTLOOK
- 7.1 White-space and Unmet-Need Assessment
 LED 照明和 OLED 照明:市场分析和製造趋势
 LED嵌灯市场报告:按应用和地区划分(2026-2034年)
 LED照明市场:2026-2032年全球市场预测(依产品类型、安装方式、技术、应用、最终用户及通路划分)相机LED照明市场:2026-2032年全球市场预测(依产品类型、照明类型、应用、最终用户及通路划分)
 2026-2030年全球LED照明市场LED面板灯市场:按安装方式、面板尺寸、产品类型、色温、应用和分销管道划分-全球预测,2026-2032年橱柜LED照明市场:依产品类型、安装类型、安装方式、应用、通路和最终用途划分-2026-2032年全球预测LED灯带控制器市场按应用、颜色类型、控制技术、分销管道、控制方式、安装方式和电压类型划分,全球预测(2026-2032年)
 柔性照明箔市场规模、份额和成长分析:按产品类型、材料类型、应用、最终用户、分销管道、地区和行业预测,2026-2033年
 LED照明市场分析及预测(至2035年):按类型、产品类型、服务、技术、组件、应用、形状、材质、最终用户和功能划分