


 |
市场调查报告书
商品编码
1938990
3D地图绘製和3D建模:市场份额分析、行业趋势和统计数据、成长预测(2026-2031年)3D Mapping And 3D Modelling - Market Share Analysis, Industry Trends & Statistics, Growth Forecasts (2026 - 2031) |
||||||
※ 本网页内容可能与最新版本有所差异。详细情况请与我们联繫。
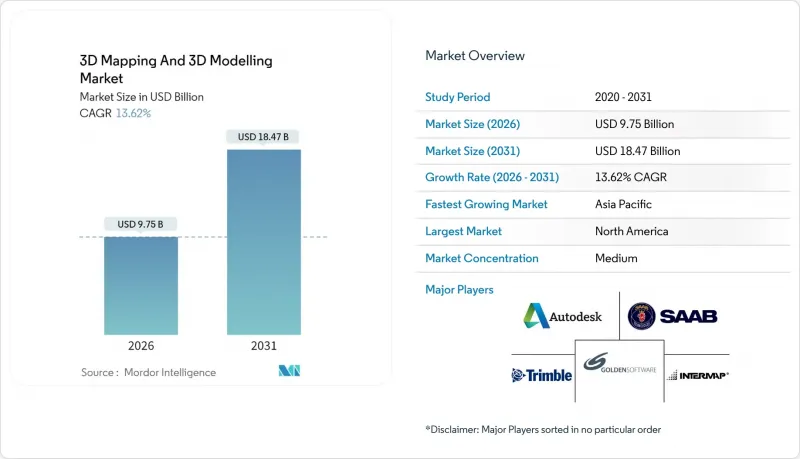
2025年,3D测绘和3D建模市场价值为85.8亿美元,预计到2031年将达到184.7亿美元,高于2026年的97.5亿美元。
预测期(2026-2031 年)的复合年增长率预计为 13.62%。
这一成长趋势主要受以下因素驱动:智慧型手机消费级雷射雷达的普及、生成式人工智慧在设计软体中的应用、政府对基础设施数位双胞胎的强制性要求,以及零售和媒体行业对扩展现实(XR)内容日益增长的需求。此外,为降低中小企业整体拥有成本而大力推广的云端原生渲染技术,以及为自动驾驶汽车提供高清地图的需求,将进一步扩大3D地图和3D建模市场。随着供应商寻求垂直整合以确保关键感测器和GPU的供应,同时向合作伙伴生态系统开放平台以实现规模化发展,预计市场竞争将更加激烈。
全球三维地图绘製与三维建模市场趋势及洞察
智慧型手机搭载的光达让即时3D采集变得大众化
主流智慧型手机内建的光达感测器消除了传统专业空间资料收集所需的高昂成本和技术门槛。苹果公司基于垂直腔面发射雷射(VCSEL)的飞行时间(TOF)阵列现已应用于数百万部iPhone和iPad中,能够产生毫米级精度的点云,而此前这需要工业扫描仪才能实现。中小企业正在利用这些携带式感测器,以经济实惠的方式进行场地扫描、房间文件记录和身临其境型(AR)商品展示,而无需购买测量级硬体。开发者也正在利用苹果的ARKit实现即时遮挡处理,从而实现室内设计预览和设施漫游,丰富了3D地图和3D建模市场。持续的微型化技术使得雷射雷达模组更加轻薄,而FCC和CE认证则确保了其跨区域部署的合规性。
将3D地理空间图层整合到生成式AI设计套件中
如今,设计软体利用三维地理空间资讯实现概念创建的自动化。 Esri 在 ArcGIS Pro 中加入了 AI 特征提取功能,可将原始点云转换为语意元件,从而减少 70% 的人工分类工作。 SketchUp 的生成引擎可在数秒内产生数千个迭代式楼层平面图,并充分考虑日照、风向和分区法规。这种 AI 辅助的工作流程非常适合寻求生态高效布局的城市规划师和寻求快速核准的建筑师。开放的 IFC 和 ISO 19650 资料标准使得 AI 产生的概念无需返工即可直接导入 BIM 流程,从而扩展了三维测绘和三维建模市场在整个建筑生命週期中的应用范围。
GPU和感测器供应链的高度波动性
半导体短缺导致GPU价格飙升,前置作业时间延长至九个月以上,严重限制了支撑3D地图和建模市场的即时渲染和深度学习流程。汽车光达製造商也在争相采购稀缺的VCSEL和光电二极管,迫使大型企业签订多年供货合同,而小型整合商则不得不推迟计划或接受高价。一些公司转向云端渲染集群来缓解硬体短缺,但这些服务也依赖数量有限的H100丛集,在等待新的晶圆代工厂产能成熟期间,系统性漏洞暴露无遗。
细分市场分析
到2025年,软体收入将占总收入的44.96%,这巩固了其在自动化特征提取、生成式建模和协作工作流程中的重要作用。服务板块虽然规模较小,但将成为成长最快的板块,到2031年复合年增长率将达到14.02%,这主要得益于企业倾向于将摄影测量、合规性和云端优化活动外包。硬体板块虽然占比较小,但其成长将主要由单光子雷射雷达模组驱动,这些模组可将资料撷取速度提高五倍,同时降低维护成本。
诸如Trimble Business Center v2024.10等软体进步使人工智慧演算法能够将分类时间缩短60%,从而使工程师能够专注于高价值设计,而非手动标註。随着工作流程转向订阅式定价,企业按专案或设备收费,不仅便于预算控制,也拓展了3D测绘和建模市场。对服务的需求正在增长,尤其是在监管严格的国防和基础设施计划中,这些计划往往缺乏内部摄影测量和数据管治的专业知识。硬体创新不断推动小型化和低耗电量,为现场工作人员和紧急应变提供行动扫描环境。
到2025年,随着娱乐工作室、产品设计师和建筑师将几何细节和视觉叙事放在首位,3D建模将占据57.74%的市场。同时,受基础设施数位化和自动驾驶汽车对厘米级精度需求的推动,3D测绘将实现14.78%的强劲复合年增长率。结合几何丰富性和空间精度的数位双胞胎孪生解决方案正在扩大计划级3D测绘和3D建模的市场规模。
成熟的建模流程采用程式化生成技术,并利用了 Autodesk 和 Maxon 的工具集;而新兴的人工智慧技术则实现了角色自动绑定和物理模拟,无需手动绘製关键影格。同时,供应商正在改进用于自动驾驶导航的高清道路模型,并整合了车道封闭和行人等动态物件。像 Bentley iTwin 这样的混合平台将工程图与纹理网格整合在一起,使资产所有者能够在单一视窗中进行腐蚀检测、交通流量监控和维护规划。互通性依赖开放的 3D 切片和 CityGML 模式,这些模式可在 GIS 和 CAD 领域之间无缝交换资料。
区域分析
到2025年,北美将占全球收入的37.14%,这主要得益于硅谷的创新、联邦政府的基础设施投资以及强调高精度地理空间资讯的国防合约。联邦机构正在委託製作用于自动驾驶汽车道路网路的高精度地图,而製造商们正在底特律和奥斯汀等地采用数位双胞胎来提高生产效率。智慧型手机中雷射雷达技术的早期应用以及5G的快速部署将维持庞大的用户群体,使3D地图和3D建模市场在该地区的创新领域保持领先地位。
预计到2031年,亚太地区将实现14.12%的复合年增长率,这主要得益于大规模的都市化、对智慧工厂的投资以及政府对数位化城市规划的强制性要求。中国3D工业相机收入预计将在2023年达到23.62亿元人民币(3.2亿美元),显示测绘供应商拥有坚实的硬体基础。日本的精密加工出口正在采用计量级雷射雷达进行公差检验。印度的智慧城市计画正在为100多个市政当局提供无人机测绘和BIM交付成果。这些多元化的需求正在汇聚,共同推动亚太地区3D测绘和3D建模市场的发展。
在欧洲,严格的法规要求对公共资产进行详细的三维记录,这有助于维持强大的市场份额。欧盟的数位单一市场和绿色交易策略推动了利用数位双胞胎进行碳减排分析,促进了营业单位和交通运输公用事业领域三维地图和建模市场的扩张。德国的工业4.0计画、法国的自动驾驶车道以及英国的国家数位双胞胎都是稳定需求的根本驱动因素。虽然GDPR带来了合规负担,但它也筛选了具备成熟资料管治能力的供应商,并鼓励供应商在欧洲建立云端伺服器。
其他福利:
- Excel格式的市场预测(ME)表
- 3个月的分析师支持
目录
第一章 引言
- 研究假设和市场定义
- 调查范围
第二章调查方法
第三章执行摘要
第四章 市场情势
- 市场驱动因素
- 利用智慧型手机搭载的光达实现即时3D测量的商业化
- 产生三维地理空间图层并将其整合到人工智慧设计套件中
- 公共基础设施计划强制采用数位双胞胎技术
- XR赋能的3D内容在媒体与零售业的快速成长
- 云端原生3D渲染技术显着降低了中小企业的整体拥有成本。
- 自动驾驶汽车高清地图的发展
- 市场限制
- GPU和感测器供应链的高度波动性
- 海量资料主权合规成本
- 摄影测量后处理技能短缺
- 碎片化的三维资料标准阻碍了互通性
- 产业生态系分析
- 监管环境
- 技术展望
- 宏观经济因素的影响
- 波特五力分析
- 供应商的议价能力
- 买方的议价能力
- 新进入者的威胁
- 替代品的威胁
- 竞争对手之间的竞争
第五章 市场规模与成长预测
- 按组件
- 硬体
- 软体
- 服务
- 按类型
- 三维地图
- 三维建模
- 透过使用
- 投影映射
- 纹理映射
- 地图和导航
- 3D渲染和视觉化以及其他用途
- 按最终用户行业划分
- 娱乐与媒体
- 卫生保健
- 建筑/施工
- 汽车和运输设备
- 国防、安全及其他终端用户产业
- 透过部署
- 本地部署
- 云
- 按地区
- 北美洲
- 我们
- 加拿大
- 墨西哥
- 南美洲
- 巴西
- 阿根廷
- 智利
- 哥伦比亚
- 欧洲
- 德国
- 法国
- 英国
- 义大利
- 西班牙
- 俄罗斯
- 亚太地区
- 中国
- 日本
- 印度
- 韩国
- 澳洲
- 纽西兰
- 印尼
- 中东
- 沙乌地阿拉伯
- 阿拉伯聯合大公国
- 土耳其
- 以色列
- 卡达
- 非洲
- 南非
- 奈及利亚
- 肯亚
- 埃及
- 摩洛哥
- 北美洲
第六章 竞争情势
- 策略趋势
- 市占率分析
- 公司简介
- Autodesk Inc.
- Bentley Systems Inc.
- ESRI Inc.
- Trimble Inc.
- Hexagon AB
- Saab AB
- Airbus Defence and Space SAS
- Intermap Technologies Corp.
- Topcon Positioning Systems Inc.
- CyberCity 3D Inc.
- The Foundry Visionmongers Ltd.
- Golden Software LLC
- Pix4D SA
- Maxon Computer GmbH
- Dassault Systemes SE
- Pixologic Inc.
- Matterport Inc.
- FARO Technologies Inc.
- Leica Geosystems AG
- Apple Inc.(ARKit and LiDAR)
第七章 市场机会与未来展望
The 3D mapping and 3D modelling market was valued at USD 8.58 billion in 2025 and estimated to grow from USD 9.75 billion in 2026 to reach USD 18.47 billion by 2031, at a CAGR of 13.62% during the forecast period (2026-2031).
This growth trajectory stems from consumer-grade LiDAR in smartphones, generative AI integration into design software, government mandates for infrastructure digital twins, and rising demand for XR-ready content across retail and media. Cloud-native rendering that lowers total cost of ownership for small enterprises and the push for high-definition maps for autonomous vehicles further expand the 3D mapping and 3D modelling market. Competitive intensity increases as vendors pursue vertical integration to secure key sensors and GPUs while simultaneously opening platforms to partner ecosystems for scale.
Global 3D Mapping And 3D Modelling Market Trends and Insights
Smartphone LiDAR Commoditises Real-Time 3D Capture
LiDAR sensors embedded in mainstream smartphones remove the traditional cost and skills barriers associated with professional spatial data collection. Apple's VCSEL-based time-of-flight array now sits inside millions of iPhones and iPads, producing millimeter-grade point clouds that once required industrial scanners. Small businesses exploit these hand-held sensors to offer affordable site scans, interior documentation, and immersive AR merchandising without capital outlays for survey-grade hardware. Developers further harness Apple's ARKit to secure real-time occlusion handling, enabling interior design previews and facility walkthroughs that enrich the 3D mapping and 3D modelling market. Continuous miniaturization keeps LiDAR modules thin, while FCC and CE certifications guarantee cross-region deployment compliance.
Integration of 3D Geospatial Layers into Generative-AI Design Suites
Design software now feeds on 3D geospatial context to automate concept creation. Esri has added AI feature extraction inside ArcGIS Pro, turning raw point clouds into semantic building blocks and cutting manual classification by 70%. SketchUp's generative engine then iterates thousands of floor plans that respect solar exposure, wind flow, and zoning rules in seconds. Such AI-assisted workflows suit urban planners pressed for eco-efficient layouts and architects chasing faster approvals. Open IFC and ISO 19650 data standards move these AI-generated concepts into BIM pipelines without rework, amplifying the 3D mapping and 3D modelling market applicability across construction lifecycles.
High GPU and Sensor Supply-Chain Volatility
Semiconductor shortages send GPU prices soaring and extend lead times beyond 9 months, throttling real-time rendering and deep-learning pipelines that underpin the 3D mapping and 3D modelling market. Automotive LiDAR makers also compete for scarce VCSELs and photodiodes, prompting larger firms to lock multi-year supply deals and forcing small integrators to delay projects or pay premiums. Some enterprises pivot to cloud render farms to cushion hardware gaps, yet those services equally rely on limited H100 clusters, highlighting systemic vulnerability until new foundry capacity matures.
Other drivers and restraints analyzed in the detailed report include:
- Mandates for Digital Twins in Public Infrastructure Projects
- XR-Ready 3D Content Boom in Media and Retail
- Large-File Data-Sovereignty Compliance Costs
For complete list of drivers and restraints, kindly check the Table Of Contents.
Segment Analysis
Software generated 44.96% of overall revenue in 2025, underscoring its role in automating feature extraction, generative modeling, and collaborative workflows. Services, while smaller, is the fastest-growing component with a 14.02% CAGR to 2031 as enterprises outsource photogrammetry, regulatory compliance, and cloud optimization tasks. Hardware retains a leaner slice but benefits from single-photon LiDAR modules that quintuple data-capture speed while cutting maintenance.
Ongoing software advances such as Trimble Business Center v2024.10 slash classification time by 60% through AI algorithms, enabling engineers to focus on higher-value design rather than manual labeling. As workflows migrate to subscription bundles, organizations pay per-project or per-device, smoothing budgets and expanding the 3D mapping and 3D modelling market. Services demand rises where in-house teams lack photogrammetry or data-governance expertise, especially in regulated defense and infrastructure projects. Hardware innovation ensures continuous miniaturization and lower power draw, which unlocks mobile scanning scenarios for field crews and first responders.
3D modelling captured 57.74% share in 2025 as entertainment studios, product designers, and architects prioritized geometric detail and visual storytelling. In contrast, 3D mapping posts the superior 14.78% CAGR owing to infrastructure digitization and autonomous vehicle needs that demand centimeter-level accuracy. The convergence of both streams into digital twin solutions blends geometric richness with spatial exactness, amplifying the 3D mapping and 3D modelling market size at project level.
Mature modelling pipelines leverage Autodesk and Maxon toolsets for procedural generation, while emerging AI features auto-rig characters and simulate physics without manual keyframes. Conversely, mapping vendors refine HD-grade road models for autonomous navigation, supporting dynamic objects such as lane closures or pedestrians. Hybrid platforms such as Bentley iTwin combine engineering schematics with textured meshes, allowing asset owners to inspect corrosion, monitor traffic flow, and schedule maintenance in one viewport. Interoperability depends on open 3D Tiles and CityGML schemas that shuttle data between GIS and CAD domains seamlessly.
The 3D Mapping and 3D Modelling Market Report is Segmented by Component (Hardware, Software, and Services), Type (3D Mapping, and 3D Modelling), Application (Projection Mapping, Texture Mapping, Maps and Navigation, and More), End-User Vertical (Entertainment and Media, Healthcare, Automotive and Transportation, and More), Deployment (On-Premise, and Cloud), and Geography. The Market Forecasts are Provided in Terms of Value (USD).
Geography Analysis
North America held 37.14% of global revenue in 2025, buoyed by Silicon Valley innovation, federal infrastructure spending, and defense contracts that value high-precision geospatial intelligence. Federal agencies commission HD maps for autonomous vehicle corridors, while manufacturers adopt digital twins to streamline production in Detroit and Austin. Early consumer adoption of smartphone LiDAR and fast 5G rollout sustain a receptive user base, keeping the 3D mapping and 3D modelling market at the forefront of innovation in the region.
Asia Pacific is forecast to attain a 14.12% CAGR through 2031, propelled by massive urbanization, smart-factory investments, and government mandates for digital city planning. China's 3D industrial camera revenue climbed to CNY 2.362 billion (USD 0.32 billion) in 2023, signaling strong hardware foundations for mapping suppliers. Japan's precision machining exports adopt metrology-grade LiDAR to verify tolerances, and India's Smart Cities Mission packages drone surveys and BIM deliverables for 100+ municipalities. These multiple demand streams collectively uplift the 3D mapping and 3D modelling market in Asia Pacific.
Europe maintains robust share owing to strict regulations that compel detailed 3D documentation of public assets. The EU's Digital Single Market and Green Deal strategies encourage carbon-reduction analytics on digital twins, expanding the 3D mapping and 3D modelling market among energy utilities and transport operators. Germany's Industry 4.0 initiatives, France's autonomous-vehicle lanes, and the United Kingdom's national digital twin all scaffold consistent demand. GDPR, though a compliance burden, also differentiates providers with proven data-governance capabilities, steering contracts toward vendors with European cloud regions.
- Autodesk Inc.
- Bentley Systems Inc.
- ESRI Inc.
- Trimble Inc.
- Hexagon AB
- Saab AB
- Airbus Defence and Space SAS
- Intermap Technologies Corp.
- Topcon Positioning Systems Inc.
- CyberCity 3D Inc.
- The Foundry Visionmongers Ltd.
- Golden Software LLC
- Pix4D SA
- Maxon Computer GmbH
- Dassault Systemes SE
- Pixologic Inc.
- Matterport Inc.
- FARO Technologies Inc.
- Leica Geosystems AG
- Apple Inc. (ARKit and LiDAR)
Additional Benefits:
- The market estimate (ME) sheet in Excel format
- 3 months of analyst support
TABLE OF CONTENTS
1 INTRODUCTION
- 1.1 Study Assumptions and Market Definition
- 1.2 Scope of the Study
2 RESEARCH METHODOLOGY
3 EXECUTIVE SUMMARY
4 MARKET LANDSCAPE
- 4.1 Market Drivers
- 4.1.1 Smartphone LiDAR commoditises real-time 3D capture
- 4.1.2 Integration of 3D geospatial layers into generative-AI design suites
- 4.1.3 Mandates for digital twins in public infrastructure projects
- 4.1.4 XR-ready 3D content boom in media and retail
- 4.1.5 Cloud-native 3D rendering slashes TCO for SMEs
- 4.1.6 Growth of autonomous-vehicle HD maps
- 4.2 Market Restraints
- 4.2.1 High GPU and sensor supply-chain volatility
- 4.2.2 Large-file data-sovereignty compliance costs
- 4.2.3 Skills shortage in photogrammetry post-processing
- 4.2.4 Fragmented 3D data standards slow interoperability
- 4.3 Industry Ecosystem Analysis
- 4.3.1 Regulatory Landscape
- 4.3.2 Technological Outlook
- 4.3.3 Impact of Macroeconomic Factors
- 4.3.4 Porter's Five Forces Analysis
- 4.3.4.1 Bargaining Power of Suppliers
- 4.3.4.2 Bargaining Power of Buyers
- 4.3.4.3 Threat of New Entrants
- 4.3.4.4 Threat of Substitutes
- 4.3.4.5 Intensity of Competitive Rivalry
5 MARKET SIZE AND GROWTH FORECASTS (VALUE)
- 5.1 By Component
- 5.1.1 Hardware
- 5.1.2 Software
- 5.1.3 Services
- 5.2 By Type
- 5.2.1 3D Mapping
- 5.2.2 3D Modelling
- 5.3 By Application
- 5.3.1 Projection Mapping
- 5.3.2 Texture Mapping
- 5.3.3 Maps and Navigation
- 5.3.4 3D Rendering and Visualisation and Other Applications
- 5.4 By End-user Vertical
- 5.4.1 Entertainment and Media
- 5.4.2 Healthcare
- 5.4.3 Building and Construction
- 5.4.4 Automotive and Transportation
- 5.4.5 Defense and Security and Other nd-user Verticals
- 5.5 By Deployment
- 5.5.1 On-premise
- 5.5.2 Cloud
- 5.6 By Geography
- 5.6.1 North America
- 5.6.1.1 United States
- 5.6.1.2 Canada
- 5.6.1.3 Mexico
- 5.6.2 South America
- 5.6.2.1 Brazil
- 5.6.2.2 Argentina
- 5.6.2.3 Chile
- 5.6.2.4 Colombia
- 5.6.3 Europe
- 5.6.3.1 Germany
- 5.6.3.2 France
- 5.6.3.3 United Kingdom
- 5.6.3.4 Italy
- 5.6.3.5 Spain
- 5.6.3.6 Russia
- 5.6.4 Asia Pacific
- 5.6.4.1 China
- 5.6.4.2 Japan
- 5.6.4.3 India
- 5.6.4.4 South Korea
- 5.6.4.5 Australia
- 5.6.4.6 New Zealand
- 5.6.4.7 Indonesia
- 5.6.5 Middle East
- 5.6.5.1 Saudi Arabia
- 5.6.5.2 United Arab Emirates
- 5.6.5.3 Turkey
- 5.6.5.4 Israel
- 5.6.5.5 Qatar
- 5.6.6 Africa
- 5.6.6.1 South Africa
- 5.6.6.2 Nigeria
- 5.6.6.3 Kenya
- 5.6.6.4 Egypt
- 5.6.6.5 Morocco
- 5.6.1 North America
6 COMPETITIVE LANDSCAPE
- 6.1 Strategic Moves
- 6.2 Market Share Analysis
- 6.3 Company Profiles (includes Global level Overview, Market level overview, Core Segments, Financials as available, Strategic Information, Market Rank/Share for key companies, Products and Services, and Recent Developments)
- 6.3.1 Autodesk Inc.
- 6.3.2 Bentley Systems Inc.
- 6.3.3 ESRI Inc.
- 6.3.4 Trimble Inc.
- 6.3.5 Hexagon AB
- 6.3.6 Saab AB
- 6.3.7 Airbus Defence and Space SAS
- 6.3.8 Intermap Technologies Corp.
- 6.3.9 Topcon Positioning Systems Inc.
- 6.3.10 CyberCity 3D Inc.
- 6.3.11 The Foundry Visionmongers Ltd.
- 6.3.12 Golden Software LLC
- 6.3.13 Pix4D SA
- 6.3.14 Maxon Computer GmbH
- 6.3.15 Dassault Systemes SE
- 6.3.16 Pixologic Inc.
- 6.3.17 Matterport Inc.
- 6.3.18 FARO Technologies Inc.
- 6.3.19 Leica Geosystems AG
- 6.3.20 Apple Inc. (ARKit and LiDAR)
7 MARKET OPPORTUNITIES AND FUTURE OUTLOOK
- 7.1 White-Space and Unmet-Need Assessment
 3D地图和建模市场:2026-2032年全球市场预测(按技术、定价模式、应用、最终用户、部署类型和行业划分)
 2026年全球行动3D市场报告2026年全球3D地图绘製与建模市场报告
 3D地图绘製和建模市场规模、份额、趋势和预测:按组件、应用、最终用户行业和地区划分,2026-2034年
 游戏领域3D地图和建模市场规模、份额和成长分析:按组件、技术、部署模式、平台、应用、企业规模和地区划分 - 产业预测 2026-2033
 2026-2030年全球3D地图绘製与建模市场
 2035年三维地图绘製与建模市场分析及预测:按类型、产品类型、服务、技术、组件、应用、部署类型、最终用户和功能划分
 全球3D地图绘製与建模市场规模、份额、趋势及成长分析报告(2026-2034年)全球3D建模、3D视觉化和3D资料撷取市场规模、份额、趋势和成长分析报告(2026-2034年)全球移动3D市场规模、份额、趋势和成长分析报告(2026-2034年)