


 |
市场调查报告书
商品编码
1939035
美国可再生能源:市场份额分析、行业趋势和统计数据以及成长预测(2026-2031 年)United States Renewable Energy - Market Share Analysis, Industry Trends & Statistics, Growth Forecasts (2026 - 2031) |
||||||
※ 本网页内容可能与最新版本有所差异。详细情况请与我们联繫。
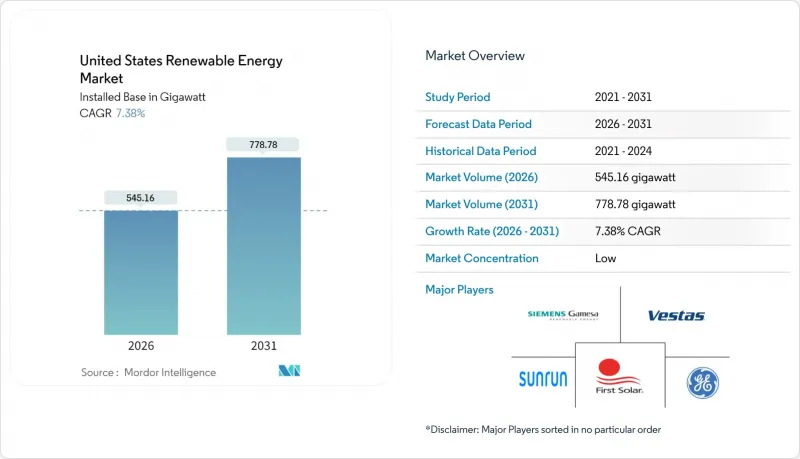
2025年美国可再生能源市场价值为507.67吉瓦,预计2031年将达到778.78吉瓦,高于2026年的545.16吉瓦。
预测期(2026-2031 年)的复合年增长率预计为 7.38%。
《通货膨胀控制法案》下的联邦激励措施、太阳能和风能安装成本的快速下降以及企业清洁能源部署目标的创纪录高位,正在推动一个不再完全依赖补贴的投资週期。电网改革、将电池储能与可再生能源结合的计划结构以及国内製造业的成长,进一步增强了美国可再生能源市场的经济效益。太阳能光电发电以41.2%的技术份额领先,风能保持其作为基础能源的地位,而储能解决方案正在加速电网的柔软性。儘管公用事业公司仍然主导着装机容量,但家庭和企业的分散式能源正在快速成长,重塑着收入模式,并推动美国可再生能源市场的服务创新。
美国可再生能源市场趋势与洞察
延长联邦投资税额扣抵和生产税额扣抵
太阳能光电发电30%的投资税额扣抵和风力光电26美元/兆瓦时的生产税额扣抵(有效期至2032年)的长期确定性,帮助美国可再生能源市场维持了稳定的建设进度,避免了以往快速成长后突然放缓的模式。国内含量要求带来的额外收益使实际税额扣抵率提高了10个百分点,预计到2024年,美国太阳能板的产量将增加40%。太阳能电池最高可达0.07美元/瓦的多级製造税额扣抵,进一步改善了计划的经济效益,并鼓励新工厂落脚传统工业州,从而扩大了美国可再生能源市场的税基。
太阳能和风能发电的平准化电成本(LCOE)迅速下降
到2024年,大型光伏发电的平准化度电成本(LCOE)将达到0.048美元/千瓦时,陆上风电的平准化度电成本将达到0.033美元/千瓦时,两者均低于未享受补贴的联合循环燃气发电价格。更大的风力涡轮机、更密集的电池结构以及供应链的最佳化正在降低资本成本,而储能技术的加入则将波动不定的输出转化为可调度的电力。商业买家将这些价格下降视为石化燃料价格波动风险的有效途径,这不仅推动了美国可再生能源市场计划储备的成长,也为投资者创造了可预测的收入来源。
电网瓶颈和互联排队
到2024年,电网连接积压量将达到2.6太瓦,比2020年增加四倍,并将导致计划延长四到五年。儘管联邦能源监管委员会(FERC)2023号令引入了丛集研究规则和商业性可行性审查,但大部分积压项目仍需要电网升级,每兆瓦的升级成本超过100万美元。在风能资源丰富的大平原地区,由于缺乏通往负载中心的输电线路,阻碍了开发,并导緻美国可再生能源市场近期新增装置容量的萎缩。
细分市场分析
预计到2025年,太阳光电技术将占美国可再生能源市场份额的40.80%,并在2031年之前以12.05%的复合年增长率成长。 85%的新建大型太阳能发电厂都配备了储能係统,将白天的发电转化为高峰时段的电力供给能力,从而提高了收入的稳定性。农光互补将农业生产与太阳能发电结合,在提高农场盈利的同时,也缓解了土地资源的限制。风能仍是许多能源组合的基础,由于塔架更高、转子更大,风力发电的安装面积也随之扩大。离岸风电发展势头强劲,透过联邦租赁竞标和州政府公开招标,离岸风电装置容量总合15吉瓦。水力发电和地热虽然能够提供可靠的电力,但资源限制和高昂的初始成本减缓了它们的发展速度。如今,技术组合决策不仅考虑千瓦时成本,还考虑电网服务价值,这正在重塑美国可再生能源市场的投资逻辑。
预计到2031年,美国纯太阳能可再生能源市场规模将达到326.4吉瓦,随着区域电网的增强,陆域风电预计将扩展至253.1吉瓦。诸如增强型地热系统和海洋能等新兴资源目前规模小规模,但先导计画已证明,在成本优化后具有扩充性。总体而言,随着关键州渗透率超过50%,技术多元化将有助于缓解天气相关的波动,并提高电力可靠性。
美国可再生能源市场报告按技术(太阳能、风能、水力、生质能源能、地热能和海洋能)和最终用户(公共产业、商业和工业以及住宅)进行细分。市场规模和预测以吉瓦装置容量为单位。
其他福利:
- Excel格式的市场预测(ME)表
- 3个月的分析师支持
目录
第一章 引言
- 研究假设和市场定义
- 调查范围
第二章调查方法
第三章执行摘要
第四章 市场情势
- 市场概览
- 市场驱动因素
- 延长联邦投资税额扣抵和生产税额扣抵
- 太阳能和风能发电的平准化能源成本(LCOE)大幅下降
- 企业净零排放及 RE100 采购目标
- 製造业復苏趋势与通膨控制法有关
- 能够促进可再生能源普及的电网强化技术
- 市场限制
- 电网瓶颈和互联排队
- 涡轮机和麵板原料价格波动;
- 当地民众反对大型发电工程
- 供应链分析
- 监理展望
- 技术展望
- 波特五力模型
- 新进入者的威胁
- 供应商的议价能力
- 买方的议价能力
- 替代品的威胁
- 竞争对手之间的竞争
- PESTEL 分析
第五章 市场规模与成长预测
- 透过技术
- 太阳能(光伏和聚光太阳能)
- 风力发电(陆上和海上)
- 水力发电(小规模、大型、抽水蓄能)
- 生质能源
- 地热
- 海洋能源(潮汐能和波浪能)
- 最终用户
- 电力公司
- 商业和工业
- 住宅
第六章 竞争情势
- 市场集中度
- 策略性措施(併购、合资、资金筹措、购电协议)
- 市场占有率分析(主要企业的市场排名和份额)
- 公司简介
- NextEra Energy, Inc.
- Invenergy LLC
- Orsted US Offshore Wind
- General Electric Company
- Vestas Wind Systems A/S
- First Solar, Inc.
- Canadian Solar Inc.
- Sunrun Inc.
- Enphase Energy, Inc.
- Siemens Gamesa Renewable Energy SA
- Brookfield Renewable Partners LP
- Pattern Energy Group LP
- AES Clean Energy
- Dominion Energy, Inc.
- Duke Energy Renewables
- EDF Renewables North America
- EDP Renewables North America LLC
- Clearway Energy Group LLC
- Mitsubishi Power Americas, Inc.
- Trina Solar Co., Ltd.
第七章 市场机会与未来展望
The United States Renewable Energy Market was valued at 507.67 gigawatt in 2025 and estimated to grow from 545.16 gigawatt in 2026 to reach 778.78 gigawatt by 2031, at a CAGR of 7.38% during the forecast period (2026-2031).
Federal incentives under the Inflation Reduction Act, steep cost declines in solar photovoltaic and wind equipment, and record-high corporate clean-electricity commitments are driving an investment cycle that no longer depends solely on subsidies. Transmission reforms, battery-plus-renewable project structures, and domestic manufacturing expansion further strengthen the economics of the US renewable energy market. Solar holds the leading 41.2% technology share, while wind remains a foundational resource, and storage solutions accelerate grid flexibility. Utilities still dominate installed capacity, yet distributed resources in homes and businesses grow quickly, reshaping revenue models and spurring service innovation across the US renewable energy market.
United States Renewable Energy Market Trends and Insights
Extension of Federal Investment & Production Tax Credits
Long-term certainty through 2032 for the 30% investment tax credit on solar and USD 26 per MWh production tax credit for wind keeps the US renewable energy market on a steady build schedule, avoiding the historical boom-bust pattern.Domestic-content bonuses lift effective credits by 10 percentage points and have already encouraged a 40% increase in US solar panel output during 2024. Layered manufacturing credits, worth up to USD 0.07 per watt for solar cells, further improve project economics and anchor new factories in traditional industrial states, broadening the tax base benefits of the US renewable energy market.
Rapid Decline in Solar-PV & Wind LCOE
Utility-scale solar reached USD 0.048 per kWh and onshore wind USD 0.033 per kWh in 2024, both undercutting combined-cycle gas prices without subsidies. Larger turbines, high-density cell architectures, and supply-chain optimization compress capital costs, while energy storage attachments convert variable output into dispatchable power. Corporate buyers treat these falling prices as a hedge against fossil-fuel volatility, adding momentum to the US renewable energy market's project pipeline and creating predictable revenue streams for investors.
Transmission Bottlenecks & Interconnection Queues
The interconnection backlog hit 2.6 TW by 2024, quadrupling 2020 levels and delaying projects by 4-5 years. Although FERC Order 2023 imposes cluster-study rules and commercial readiness screens, most pending applications still face network upgrades valued at more than USD 1 million per MW. The Great Plains, rich in wind, sees development stymied without conduits to load centers, resulting in trimmed near-term additions in the US renewable energy market.
Other drivers and restraints analyzed in the detailed report include:
- Corporate Net-Zero & RE100 Procurement Targets
- Inflation Reduction Act-linked Manufacturing Upswing
- Volatility in Commodity Prices for Turbines & Panels
For complete list of drivers and restraints, kindly check the Table Of Contents.
Segment Analysis
Solar technology accounted for 40.80% of the US renewable energy market share in 2025 and is projected to grow at the fastest rate, with a 12.05% CAGR, to 2031. Pairing with batteries means that 85% of new utility solar installations include storage, turning midday generation into peaking capacity and raising revenue certainty. Agrivoltaics blends crop production and photovoltaics, easing land constraints while improving farmer economics. Wind still anchors many portfolios and benefits from taller towers and larger rotors that expand viable terrain. Offshore wind gains momentum through federal lease auctions and state solicitations totaling 15 GW. Hydropower and geothermal energy offer dependable capacity, yet resource limitations and higher upfront costs slow their relative advancement. Technology mix decisions now reflect grid-service value in addition to kilowatt-hour prices, reshaping investment logic inside the US renewable energy market.
The US renewable energy market size for solar alone is expected to reach 326.4 GW by 2031, while onshore wind is projected to expand to 253.1 GW amid regional transmission upgrades. Emerging resources, such as enhanced geothermal systems and marine energy, exhibit modest baselines, but pilot projects reveal scalability once costs are optimized. In aggregate, technology diversification cushions weather-related output swings and strengthens reliability as penetration rises beyond 50% in leading states.
The United States Renewable Energy Market Report is Segmented by Technology (Solar Energy, Wind Energy, Hydropower, Bioenergy, Geothermal, and Ocean Energy) and End-User (Utilities, Commercial and Industrial, and Residential). The Market Sizes and Forecasts are Provided in Terms of Installed Capacity (GW).
List of Companies Covered in this Report:
- NextEra Energy, Inc.
- Invenergy LLC
- Orsted US Offshore Wind
- General Electric Company
- Vestas Wind Systems A/S
- First Solar, Inc.
- Canadian Solar Inc.
- Sunrun Inc.
- Enphase Energy, Inc.
- Siemens Gamesa Renewable Energy S.A.
- Brookfield Renewable Partners L.P.
- Pattern Energy Group LP
- AES Clean Energy
- Dominion Energy, Inc.
- Duke Energy Renewables
- EDF Renewables North America
- EDP Renewables North America LLC
- Clearway Energy Group LLC
- Mitsubishi Power Americas, Inc.
- Trina Solar Co., Ltd.
Additional Benefits:
- The market estimate (ME) sheet in Excel format
- 3 months of analyst support
TABLE OF CONTENTS
1 Introduction
- 1.1 Study Assumptions & Market Definition
- 1.2 Scope of the Study
2 Research Methodology
3 Executive Summary
4 Market Landscape
- 4.1 Market Overview
- 4.2 Market Drivers
- 4.2.1 Extension of Federal Investment & Production Tax Credits
- 4.2.2 Rapid Decline in Solar-PV & Wind LCOE
- 4.2.3 Corporate Net-Zero & RE100 Procurement Targets
- 4.2.4 Inflation Reduction Act-linked Manufacturing Upswing
- 4.2.5 Grid-enhancing Technologies enabling higher renewable penetration
- 4.3 Market Restraints
- 4.3.1 Transmission Bottlenecks & Interconnection Queues
- 4.3.2 Volatility in Commodity Prices for Turbines & Panels
- 4.3.3 Community Opposition to Utility-Scale Projects
- 4.4 Supply-Chain Analysis
- 4.5 Regulatory Outlook
- 4.6 Technological Outlook
- 4.7 Porters Five Forces
- 4.7.1 Threat of New Entrants
- 4.7.2 Bargaining Power of Suppliers
- 4.7.3 Bargaining Power of Buyers
- 4.7.4 Threat of Substitutes
- 4.7.5 Competitive Rivalry
- 4.8 PESTLE Analysis
5 Market Size & Growth Forecasts
- 5.1 By Technology
- 5.1.1 Solar Energy (PV and CSP)
- 5.1.2 Wind Energy (Onshore and Offshore)
- 5.1.3 Hydropower (Small, Large, PSH)
- 5.1.4 Bioenergy
- 5.1.5 Geothermal
- 5.1.6 Ocean Energy (Tidal and Wave)
- 5.2 By End-User
- 5.2.1 Utilities
- 5.2.2 Commercial and Industrial
- 5.2.3 Residential
6 Competitive Landscape
- 6.1 Market Concentration
- 6.2 Strategic Moves (M&A, JVs, Funding, PPAs)
- 6.3 Market Share Analysis (Market Rank/Share for key companies)
- 6.4 Company Profiles (includes Global-level Overview, Market-level Overview, Core Segments, Financials, Strategic Information, Products & Services, Recent Developments)
- 6.4.1 NextEra Energy, Inc.
- 6.4.2 Invenergy LLC
- 6.4.3 Orsted US Offshore Wind
- 6.4.4 General Electric Company
- 6.4.5 Vestas Wind Systems A/S
- 6.4.6 First Solar, Inc.
- 6.4.7 Canadian Solar Inc.
- 6.4.8 Sunrun Inc.
- 6.4.9 Enphase Energy, Inc.
- 6.4.10 Siemens Gamesa Renewable Energy S.A.
- 6.4.11 Brookfield Renewable Partners L.P.
- 6.4.12 Pattern Energy Group LP
- 6.4.13 AES Clean Energy
- 6.4.14 Dominion Energy, Inc.
- 6.4.15 Duke Energy Renewables
- 6.4.16 EDF Renewables North America
- 6.4.17 EDP Renewables North America LLC
- 6.4.18 Clearway Energy Group LLC
- 6.4.19 Mitsubishi Power Americas, Inc.
- 6.4.20 Trina Solar Co., Ltd.
7 Market Opportunities & Future Outlook
- 7.1 White-space & Unmet-Need Assessment
 新一轮石油危机:推动通讯业者转向可再生能源
 可再生能源市场规模、份额、成长及全球产业分析:按类型、应用和地区分類的洞察,2026-2034 年预测
 农业可再生能源:生质燃料、太阳能发电厂和永续农业实践的全球市场—按应用、产品和地区分類的分析和预测(2025-2035 年)
 2026年全球可再生能源市场报告2026年全球多元能源系统市场报告2026年全球太阳能燃料市场报告
 可再生能源市场:全球产业分析、市场规模、市场份额及预测(依投资类型、可再生能源类型、企业类型、应用、国家及地区划分)-2026-2033年
 风电场变电站市场按组件类型、配置类型、连接类型、电压等级、最终用户和安装类型划分,全球预测(2026-2032年)全球节能设备市场:机会与策略展望(至2034年)
 节能微控制器市场分析及预测(至2035年):依类型、产品类型、服务、技术、组件、应用、最终用户、功能、安装类型、解决方案划分