


 |
市场调查报告书
商品编码
1939070
生物基聚乳酸(PLA):市场占有率分析、产业趋势与统计、成长预测(2026-2031)Bio-polylactic Acid (PLA) - Market Share Analysis, Industry Trends & Statistics, Growth Forecasts (2026 - 2031) |
||||||
※ 本网页内容可能与最新版本有所差异。详细情况请与我们联繫。
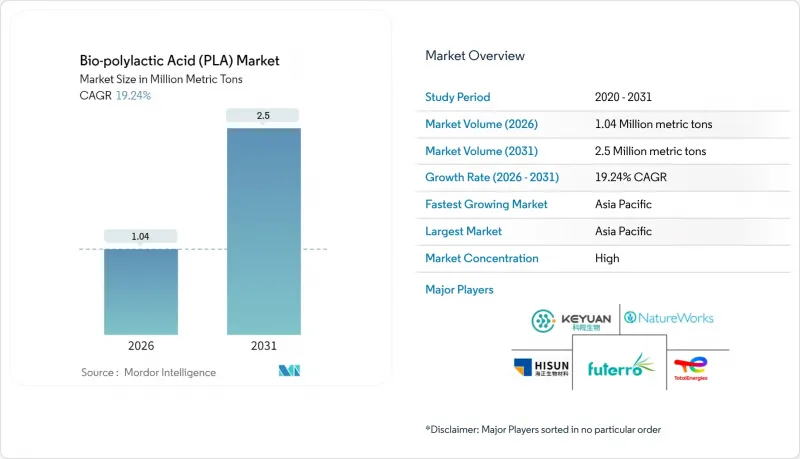
预计到 2025 年,生物基聚乳酸 (PLA) 市场价值将达到 87 万吨,并在预测期(2026-2031 年)内以 19.24% 的复合年增长率增长,从 2026 年的 104 万吨增长到 2031 年的 250 万吨。
对一次性塑胶的强力监管压力、亚洲产能扩张带来的成本快速下降,以及突破性酵素回收技术的开发,已将生物基聚乳酸市场从利基市场转变为主流材料解决方案。需求成长不再局限于硬质和软质包装;先进等级的聚乳酸正被应用于高温汽车内部装潢建材、医疗设备、3D列印电子产品等领域,其性能达到甚至超越了石油基聚合物的标准。与玉米相比,甘蔗和甜菜具有更低的碳排放强度和更稳定的价格,在原料替代方面发挥主导作用。同时,亚太地区的生产基地在地域上获得了成本优势,并成为全球竞争力的基石。竞争格局瞬息万变,老牌製造商正在靠近原材料产地的地方扩建世界级工厂,而新参与企业则利用其专有的解聚酶技术,在欧洲、北美和日本赢得以永续性的合约。
全球生物基聚乳酸(PLA)市场趋势及展望
政府对一次性塑胶製品的监管推动了市场发展。
一系列法规正在加速对生物基聚乳酸(PLA)的需求,其中许多产品必须具备经认证的可堆肥性。加州AB 1201法案(将于2026年生效)将可堆肥标籤的材料限定为符合美国农业部国家有机计划(USDA National Organic Program)标准的材料,从而有效地将不符合标准的生质塑胶,从而开闢机构通路,带来相当于数十万吨的额外需求。南澳大利亚州将于2025年禁止使用未经认证的可生物降解标籤,这将进一步加强合规框架,并将采购规格转向高纯度PLA等级。
中国不断扩大的生产能力将重塑全球成本结构。
亚太地区生物基聚乳酸市场正经历关键的成本削减阶段。 NatureWorks公司在泰国获得了3.5亿美元的投资,用于建造一座年产7.5万吨的甘蔗基聚乳酸工厂,这表明要实现全球竞争力,企业需要投入大量资金。阿联酋生物技术公司(Emirates Biotech)正在阿联酋建设一座大型工厂,计划于2028年投产,该工厂采用了苏尔寿(Sulzer)的技术,这将进一步扩大其在亚太和中东地区的业务。印度领先的糖业公司巴尔拉姆普尔·奇尼糖厂(Balrampur Cheeni Mills)正在投资200亿印度卢比建设一条年产7.5万吨的聚乳酸生产线,这充分体现了企业在保持本地原材料优势的同时,实现业务原材料,摆脱对中国市场的依赖。大型工厂专注于生产大宗商品级聚乳酸,而一些专注于特定领域的製造商则透过开发特种合金和获得低碳认证来维持其高定价策略。
工业堆肥基础设施的缺乏限制了市场可行性。
在模拟堆肥条件下,测试的五种硬质PLA产品中只有四种实现了完全分解,部分样品中检测到了微塑胶碎片,显示其在非最佳堆肥环境下的性能较差。美国废弃物管理负责人指出,将可堆肥和不可堆肥材料分开在经济和营运上都不切实际,导致大量废弃物最终被送往掩埋,而不管消费者的意愿如何。美国国家有机计画(NOP)目前认定,市售可生物降解地膜不符合生物基和可生物降解的要求,这使得PLA无法进入盈利的农业领域。在拉丁美洲、南亚和非洲,基础设施短缺问题更为突出,这些地区只有不到5%的都市固态废弃物经过受控堆肥处理。在挨家挨户收集系统普及之前,生物降解性的说法可能难以引起政策制定者和消费者的重视,并可能不时减缓生物基PLA市场的普及速度。
细分市场分析
截至2025年,甘蔗和甜菜将占生物基聚乳酸市场62.10%的份额,年复合成长率达19.93%,显示原料采购结构将有显着变化。与玉米基原料相比,甘蔗发酵产生的二氧化碳排放更低,因为热带地区的甘蔗种植最大限度地减少了化学肥料和灌溉的使用。 Total Energies Corbion位于罗勇府的工厂使用当地采购的甘蔗糖蜜,与进口玉米淀粉相比,物流排放减少了15%。该工厂已获得ISCC PLUS认证,并因此获得了欧洲生态标章。巴西和泰国的生产商计划引进利用甘蔗渣(甘蔗废料)的汽电共生,推动生命週期分析朝向净负排放的方向发展。
玉米在北美仍然是一种重要的农作物,当地现有的湿式製糖产能和成熟的酵素供应链降低了将现有工厂改造为聚乳酸(PLA)生产厂的资本门槛。木薯是一种极具吸引力的非食品原料,在越南、印尼和奈及利亚等国均有丰富的产量。木薯淀粉含量高,农业投入适中,若当地具备干燥设施,可作为低成本的乳酸生产途径。研究表明,在年产10万吨的工厂中,使用糖蜜作为原料可降低37%的营业成本,这使其成为垂直整合的糖业集团极具吸引力的多元化选择。
生物基聚乳酸报告按原料(玉米、木薯、甘蔗/甜菜、其他原料)、形态(纤维、薄膜/片材、涂层、其他形态)、终端用户产业(包装、医疗、电子、农业、其他)和地区(亚太地区、北美、欧洲、南美、中东和非洲)进行细分。市场预测以吨为单位。
区域分析
到2025年,亚太地区将占据生物基聚乳酸市场40.50%的份额,复合年增长率达22.14%,显示该地区既是最大的消费市场,也是成本最低的生产市场。泰国投资促进委员会针对生质塑胶的税收优惠政策已将计划投资回收期缩短至六年,这鼓励了NatureWorks和该地区的主要糖业公司扩大生产线。在中国,为了实现2025年的塑胶污染控制目标,国内包装品牌正以聚乳酸(PLA)取代EPS翻盖式容器,这在出口成长的同时也提振了国内需求。印度大力推广乙醇掺混,导致部分甘蔗生产转向PLA,而一些综合糖厂正在发酵糖蜜生产乳酸,作为PLA的原料,这既创造了附加价值,也稳定了收入来源。
儘管北美受益于明确的监管推动,例如联邦采购的逐步淘汰和加州的可堆肥标籤强制令,但除主要沿海大都会圈外,工业堆肥基础设施仍然不足。中西部地区较低的掩埋费抑制了商业堆肥企业的扩张,限制了生物基PLA的市场渗透,儘管品牌所有者对此表现出浓厚的兴趣。 PLA生产商与废弃物收集商合作,在西雅图和奥斯汀建立专用收集路线,为建构循环经济模式提供了一个可扩展的蓝图。
欧洲在闭合迴路计画方面持续保持主导,ENZYCLE计划透过一座年产2,000吨的解聚工厂证明了其技术可行性。欧盟严格的包装课税制度鼓励品牌所有者采用生物基和可再生材料,使其价格高于化石基替代品。南美洲和中东/非洲地区正在涌现新的机会:巴西的糖过剩恰好满足了聚乳酸(PLA)的经济效益,而阿联酋的一家大型工厂将为寻求清真认证食品低碳包装的区域加工商提供服务。然而,国内有机垃圾收集系统的限制限制了消费者堆肥的益处,也减缓了全循环利用的普及。
其他福利:
- Excel格式的市场预测(ME)表
- 3个月的分析师支持
目录
第一章 引言
- 研究假设和市场定义
- 调查范围
第二章调查方法
第三章执行摘要
第四章 市场情势
- 市场概览
- 市场驱动因素
- 政府对一次性塑胶製品进行限制,并强制要求使用可堆肥包装。
- 中国产能的快速成长降低了PLA的生产成本。
- 电子商务食材自煮包的蓬勃发展推动了对可堆肥薄膜的需求。
- 欧盟和日本正在兴起闭合迴路PLA回收试点项目
- 耐热PLA在汽车内装复合材料的应用
- 市场限制
- 饲料玉米价格波动对PLA经济效益的影响
- 大多数地区缺乏工业堆肥能力
- 由于酵素法PLA解聚技术的智慧财产权集中,成本上升。
- 价值链分析
- 波特五力模型
- 供应商的议价能力
- 买方的议价能力
- 新进入者的威胁
- 替代品的威胁
- 竞争程度
第五章 市场规模与成长预测
- 按原料
- 玉米
- 木薯
- 甘蔗和甜菜
- 其他成分
- 按形式
- 纤维
- 薄膜和片材
- 涂层
- 其他形式
- 按最终用户行业划分
- 包装
- 医疗保健
- 电子设备
- 农业
- 纺织品
- 其他终端用户产业
- 按地区
- 亚太地区
- 中国
- 印度
- 日本
- 韩国
- 亚太其他地区
- 北美洲
- 我们
- 加拿大
- 墨西哥
- 欧洲
- 德国
- 英国
- 义大利
- 法国
- 比荷卢经济联盟
- 奥地利
- 捷克共和国和斯洛伐克
- 波兰
- 匈牙利
- 瑞士
- 北欧国家
- 其他欧洲地区
- 南美洲
- 巴西
- 阿根廷
- 其他南美洲
- 中东和非洲
- 沙乌地阿拉伯
- 南非
- 其他中东和非洲地区
- 亚太地区
第六章 竞争情势
- 市场集中度
- 策略趋势
- 市占率(%)/排名分析
- 公司简介
- Balrampur Chini Mills Limited
- BASF
- BEWi
- COFCO
- Danimer Scientific
- Evonik Industries AG
- Futerro
- Jiangxi Keyuan Bio-Material Co. Ltd
- Mitsubishi Chemical Group Corporation
- Musashino Chemical Laboratory, Ltd.
- NatureWorks LLC
- Polysciences Inc.
- Shanghai Tong Jie Liang Biomaterials Co. Ltd
- Shenzhen Esun Industrial Co., Ltd.
- Sulzer Ltd
- TotalEnergies
- Zhejiang Hisun Biomaterials Co., Ltd.
第七章 市场机会与未来展望
The Bio-polylactic Acid (PLA) Market was valued at 0.87 Million metric tons in 2025 and estimated to grow from 1.04 Million metric tons in 2026 to reach 2.5 Million metric tons by 2031, at a CAGR of 19.24% during the forecast period (2026-2031).
Strong legislative pressure on single-use plastics, rapid cost deflation from Asian capacity additions, and breakthrough enzymatic recycling technologies have moved the Bio-polylactic Acid market from a niche to a mainstream materials solution. Demand growth is no longer confined to rigid and flexible packaging, as high-heat automotive interiors, medical devices, and 3D-printed electronics adopt advanced grades that match or exceed petro-polymer performance benchmarks. Sugarcane and sugar beet feedstocks lead raw-material substitution on the back of lower carbon intensity and more stable pricing compared with corn, while geographically the Asia-Pacific production base secures the cost leadership that underpins global competitiveness. Competitive dynamics remain fluid: incumbent producers scale world-class plants close to feedstock sources, and new entrants leverage proprietary depolymerization enzymes to win sustainability-driven contracts in Europe, North America, and Japan.
Global Bio-polylactic Acid (PLA) Market Trends and Insights
Government Bans on Single-Use Plastics Drive Regulatory Momentum
A cascade of regulations accelerates the Bio-polylactic Acid market demand by making certified compostability a legal requirement for numerous products. California's AB 1201, effective in 2026, restricts compostable labels to materials that meet USDA National Organic Program standards, effectively removing subpar bioplastics from the shelf. New South Wales' enforcement of extensive single-use restrictions from 2025 prompts rapid substitution toward PLA certified to Australian standards. The White House Plastic Strategy, announced in 2024, eliminates federal procurement of single-use plastics by 2027, opening institutional channels equivalent to several hundred thousand tons of incremental demand. South Australia's 2025 ban on non-certified compostable labels further tightens compliance frameworks and shifts purchasing specifications toward high-purity PLA grades.
Chinese Capacity Expansion Reshapes Global Cost Structure
Asia-Pacific hosts the pivotal cost-down phase of the Bio-polylactic Acid market. NatureWorks secured USD 350 million to build a 75,000-ton sugarcane-based plant in Thailand, illustrating the capital intensity required to achieve globally competitive economics. Emirates Biotech selected Sulzer technology for a UAE mega-facility that will commence operations in 2028, further enlarging the Asian and Middle-East footprint. Indian sugar player Balrampur Chini Mills is investing INR 2,000 crores in a 75,000 ton PLA line, exemplifying diversification beyond China while retaining regional feedstock advantages. As larger plants focus on commodity grades, niche producers defend premium pricing through specialty alloy development and certified low-carbon footprints.
Industrial Composting Infrastructure Gaps Constrain Market Realization
Only four out of five tested rigid PLA items achieved full disintegration under simulated composting, and some samples emitted microplastic fragments, revealing performance shortfalls when compost envelope conditions are sub-optimal. Municipal waste managers in the United States report that separating compostable from non-compostable items is financially and operationally unworkable, forcing many loads into landfills despite consumer intentions. The U.S. National Organic Program currently finds that no commercial biodegradable mulch film meets its biobased and degradation requirements, blocking PLA entry into a potentially lucrative agricultural segment. Infrastructure scarcity is even more pronounced in Latin America, South Asia, and Africa where less than 5% of municipal solid waste passes through controlled composting. Until curbside systems scale, claims of biodegradability may ring hollow for policymakers and consumers, periodically slowing the Bio-polylactic Acid market adoption curve.
Other drivers and restraints analyzed in the detailed report include:
- E-commerce Packaging Demand Accelerates Compostable Film Adoption
- Closed-Loop Recycling Technology Emerges as Competitive Differentiator
- Concentrated IP Around Enzymatic PLA Depolymerization Raises Costs
For complete list of drivers and restraints, kindly check the Table Of Contents.
Segment Analysis
Sugarcane and sugar beet supplied 62.10% of the Bio-polylactic Acid market share in 2025, rising on a 19.93% CAGR trajectory that signals a deep realignment of raw-material sourcing. Sugarcane fermentation yields lower process CO2 than corn variants because crop cultivation requires minimal fertilizer and irrigation inputs in tropical geographies. TotalEnergies Corbion's Rayong line leverages local cane syrup, trimming logistics emissions by 15% compared with imported corn starch and ensuring ISCC PLUS certification that unlocks European eco-label access. Producers in Brazil and Thailand plan to integrate bagasse cogeneration to push life-cycle analysis toward net-negative profiles.
Corn retains meaningful volume in North America because existing wet-milling assets and established enzyme supply chains reduce capital barriers for brownfield PLA retrofits. Cassava obtains attention as a non-food alternative plentiful in Vietnam, Indonesia, and Nigeria; its high starch content and moderate agronomic inputs present a path to low-cost lactic acid when local drying capacity is available. Research demonstrates that molasses feedstocks can cut operating costs by 37% at 100,000-ton scale plants, giving vertically integrated sugar groups a compelling diversification option.
The Bio-Polylactic Acid Report is Segmented by Raw Material (Corn, Cassava, Sugarcane and Sugar Beet, and Other Raw Materials), Form (Fiber, Films and Sheets, Coatings, and Other Forms), End-User Industry (Packaging, Medical, Electronics, Agriculture, and More), and Geography (Asia-Pacific, North America, Europe, South America, and Middle-East and Africa). The Market Forecasts are Provided in Terms of Volume (Tons).
Geography Analysis
Asia-Pacific commanded 40.50% Bio-polylactic Acid market share in 2025, and its 22.14% CAGR underscores the region's dual role as the largest consumer and the lowest-cost producer. Thailand's policy of Board of Investment tax breaks for bioplastics cuts project payback periods to six years, encouraging NatureWorks and regional sugar conglomerates to scale new lines. China's domestic packaging brands substitute PLA for EPS clamshells to meet 2025 plastic-pollution targets, lifting local demand even as export volumes grow. India's ethanol-blending push diverts some sugarcane output, but integrated mills capture additional value by fermenting molasses into lactic acid for PLA, stabilizing revenue streams.
North America benefits from clear regulatory impetus, such as the federal procurement phase-out and California's compostability labeling, yet industrial composting infrastructure remains patchy outside coastal metros. Landfill tipping fees in the Midwest remain low, reducing economic incentives for commercial composters to expand, which tempers Bio-polylactic Acid market penetration despite strong brand owner interest. Collaboration between PLA producers and waste haulers to establish dedicated pickup routes in Seattle and Austin demonstrates scalable blueprints for circular loops.
Europe maintains leadership in closed-loop pilots, with the ENZYCLE project proving technical feasibility at 2,000 ton annual capacity depolymerization plants. Stringent EU packaging levy structures push brand owners to adopt bio-based and recyclable content, thereby supporting a price premium over fossil alternatives. South America and the Middle East and Africa present nascent opportunities: Brazil's sugar surplus aligns well with PLA economics, while the UAE mega-facility will serve regional converters seeking low-carbon packaging for halal certified foods. Absence of curbside organics collection, however, restricts consumer-side composting benefits, delaying full-cycle adoption.
- Balrampur Chini Mills Limited
- BASF
- BEWi
- COFCO
- Danimer Scientific
- Evonik Industries AG
- Futerro
- Jiangxi Keyuan Bio-Material Co. Ltd
- Mitsubishi Chemical Group Corporation
- Musashino Chemical Laboratory, Ltd.
- NatureWorks LLC
- Polysciences Inc.
- Shanghai Tong Jie Liang Biomaterials Co. Ltd
- Shenzhen Esun Industrial Co., Ltd.
- Sulzer Ltd
- TotalEnergies
- Zhejiang Hisun Biomaterials Co., Ltd.
Additional Benefits:
- The market estimate (ME) sheet in Excel format
- 3 months of analyst support
TABLE OF CONTENTS
1 Introduction
- 1.1 Study Assumptions and Market Definition
- 1.2 Scope of the Study
2 Research Methodology
3 Executive Summary
4 Market Landscape
- 4.1 Market Overview
- 4.2 Market Drivers
- 4.2.1 Government Bans on Single-Use Plastics and Compostable-Pack Mandates
- 4.2.2 Chinese Capacity Surge Lowering PLA Production Cost
- 4.2.3 E-Commerce Meal-Kit Boom Driving Demand for Compostable Films
- 4.2.4 Emerging Closed-Loop PLA Recycling Pilots in EU and Japan
- 4.2.5 High-Heat PLA Adoption in Automotive Interior Composites
- 4.3 Market Restraints
- 4.3.1 Feed-Corn Price Volatility Impacting PLA Economics
- 4.3.2 Insufficient Industrial Composting Capacity in Most Regions
- 4.3.3 Concentrated IP around Enzymatic PLA Depolymerisation Raises Costs
- 4.4 Value Chain Analysis
- 4.5 Porter's Five Forces
- 4.5.1 Bargaining Power of Suppliers
- 4.5.2 Bargaining Power of Buyers
- 4.5.3 Threat of New Entrants
- 4.5.4 Threat of Substitutes
- 4.5.5 Degree of Competition
5 Market Size and Growth Forecasts (Volume)
- 5.1 By Raw Material
- 5.1.1 Corn
- 5.1.2 Cassava
- 5.1.3 Sugarcane and Sugar Beet
- 5.1.4 Other Raw Materials
- 5.2 By Form
- 5.2.1 Fiber
- 5.2.2 Films and Sheets
- 5.2.3 Coatings
- 5.2.4 Other Forms
- 5.3 By End-user Industry
- 5.3.1 Packaging
- 5.3.2 Medical
- 5.3.3 Electronics
- 5.3.4 Agriculture
- 5.3.5 Textiles
- 5.3.6 Other End-user Industries
- 5.4 By Geography
- 5.4.1 Asia-Pacific
- 5.4.1.1 China
- 5.4.1.2 India
- 5.4.1.3 Japan
- 5.4.1.4 South Korea
- 5.4.1.5 Rest of Asia-Pacific
- 5.4.2 North America
- 5.4.2.1 United States
- 5.4.2.2 Canada
- 5.4.2.3 Mexico
- 5.4.3 Europe
- 5.4.3.1 Germany
- 5.4.3.2 United Kingdom
- 5.4.3.3 Italy
- 5.4.3.4 France
- 5.4.3.5 Benelux
- 5.4.3.6 Austria
- 5.4.3.7 Czech Republic and Slovakia
- 5.4.3.8 Poland
- 5.4.3.9 Hungary
- 5.4.3.10 Switzerland
- 5.4.3.11 Nordic
- 5.4.3.12 Rest of Europe
- 5.4.4 South America
- 5.4.4.1 Brazil
- 5.4.4.2 Argentina
- 5.4.4.3 Rest of South America
- 5.4.5 Middle-East and Africa
- 5.4.5.1 Saudi Arabia
- 5.4.5.2 South Africa
- 5.4.5.3 Rest of Middle-East and Africa
- 5.4.1 Asia-Pacific
6 Competitive Landscape
- 6.1 Market Concentration
- 6.2 Strategic Moves
- 6.3 Market Share (%)/Ranking Analysis
- 6.4 Company Profiles (includes Global level Overview, Market level overview, Core Segments, Financials as available, Strategic Information, Market Rank/Share, Products and Services, Recent Developments)
- 6.4.1 Balrampur Chini Mills Limited
- 6.4.2 BASF
- 6.4.3 BEWi
- 6.4.4 COFCO
- 6.4.5 Danimer Scientific
- 6.4.6 Evonik Industries AG
- 6.4.7 Futerro
- 6.4.8 Jiangxi Keyuan Bio-Material Co. Ltd
- 6.4.9 Mitsubishi Chemical Group Corporation
- 6.4.10 Musashino Chemical Laboratory, Ltd.
- 6.4.11 NatureWorks LLC
- 6.4.12 Polysciences Inc.
- 6.4.13 Shanghai Tong Jie Liang Biomaterials Co. Ltd
- 6.4.14 Shenzhen Esun Industrial Co., Ltd.
- 6.4.15 Sulzer Ltd
- 6.4.16 TotalEnergies
- 6.4.17 Zhejiang Hisun Biomaterials Co., Ltd.
7 Market Opportunities and Future Outlook
- 7.1 White-space and Unmet-need Assessment
