


 |
市场调查报告书
商品编码
1939125
硫磺:市场占有率分析、产业趋势与统计、成长预测(2026-2031)Sulfur - Market Share Analysis, Industry Trends & Statistics, Growth Forecasts (2026 - 2031) |
||||||
※ 本网页内容可能与最新版本有所差异。详细情况请与我们联繫。
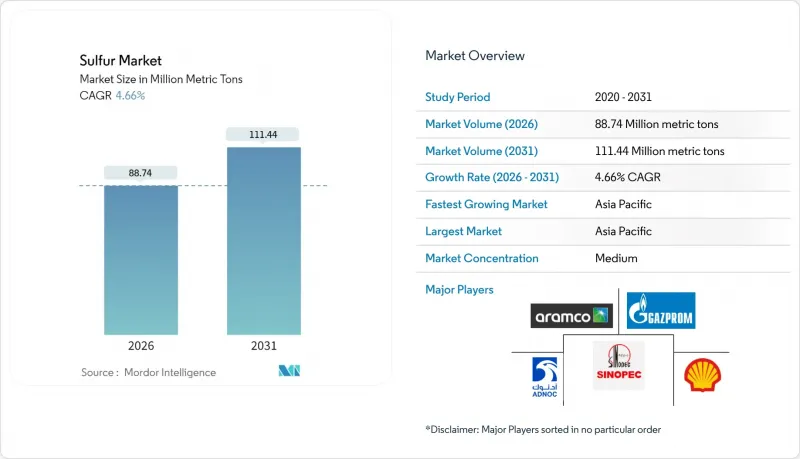
2025年硫磺市场价值为8,479万吨,预计2026年将成长至8,874万吨,到2031年将成长至1.1144亿吨。
预计在预测期(2026-2031 年)内,复合年增长率将达到 4.66%。
儘管环境法规日益严格,但硫磺市场仍在稳步扩张,这主要得益于化肥消费的持续增长、超低硫柴油(ULSD)法规推动的炼油厂生产以及新兴电池技术的创新。亚太地区仍是硫磺市场的核心区域,由于人口成长、炼油产能带来的粮食需求以及产业多元化,该地区保持最大的硫磺供应和消费量。固体硫磺具有物流优势,因为它避免了处理熔融硫磺所需的高成本热处理、专用储存槽和安全控制措施。竞争格局有利于将硫磺回收视为成本抵销产品的石油和天然气集团,而锂硫电池和硫改质建筑材料等高价值应用则鼓励规模较小的专业公司建立高纯度硫磺生产能力。儘管持续的SOx排放法规和高成本的熔融硫磺物流在短期内构成了一些障碍,但这并不影响硫磺市场未来五年的成长前景。
全球硫磺市场趋势及展望
化肥生产需求增加
全球粮食安全目标将维持化肥的高产量,预计2025年,化肥将占硫磺市场需求的88.96%。印度累计680亿美元用于2024年的磷钾肥补贴,这项政策促使缓释肥中添加了大量的硫磺。中国的现代化建设推动了硫磺的补充,以改善贫瘠的土壤;而印尼和马来西亚棕榈油面积的扩大则推动了区域养分需求的成长。精密农业系统需要富含硫磺的微量元素配方,这不仅提高了单位肥料的硫含量,也创造了多元化的需求基础,使硫磺市场免受区域衝击的影响。
超低硫柴油(ULSD)精炼产能扩张
超低硫柴油(ULSD)法规迫使炼油厂从燃料中提取硫,并将这些硫重新投入硫市场。沙乌地阿拉伯吉赞炼油厂新建的脱硫装置于2024年新增65万吨供给能力,马拉松石油公司位于加尔维斯顿湾的扩建计划也新增了42万吨产能。北美和欧洲的炼油商持续投资,以确保2030年特定产品的稳定供应,并改善先前硫供不应求地区的下游通道。
无论地区如何,都应严格执行SOx排放法规
欧盟工业排放指令要求硫酸厂到2030年将二氧化硫排放减少95%。美国国家空气品质标准使监测和脱硫装置的成本每吨增加2-4美元,推动小规模加工企业进行整合。中国正在收紧排放气体法规,对不合规企业处以相当于其营业额10%的罚款。这些法规可能在短期内提高资本壁垒,减缓产能扩张速度,并抑制硫磺市场的成长动能。
细分市场分析
预计到2025年,固体产品将占硫磺市场份额的80.62%,并预计到2031年将保持5.08%的复合年增长率。由于固体硫磺产品易于处理、保险成本低且无需加热储存,因此不具备专业设施的化学肥料生产商更倾向于选择固体产品。随着自动化装载和除尘设备的改进,操作风险降低,固体硫磺的市场规模预计将进一步扩大。
颗粒状和球状硫磺能够提高产品在运输过程中的完整性,符合 ISO 14001 管理系统要求,并减少对环境的影响。液态硫磺的应用仅限于大型硫酸联合企业,这些企业将熔融原料直接整合到生产线中,而高昂的物流成本限制了其广泛应用。因此,随着新兴电池和建筑业的使用者也开始指定使用颗粒状原料,固体硫磺仍保持其主导地位。
硫磺市场报告按形态(固体与液态)、表面处理工程技术(颗粒状、膏状与造粒状)、终端用户行业(化肥、化学、金属製造、橡胶加工及其他终端用户行业)和地区(亚太地区、北美、欧洲、南美、中东和非洲)进行细分。市场预测以公吨为单位。
区域分析
至2025年,亚太地区将占全球硫磺消费量的39.40%,并在2031年之前以5.55%的复合年增长率成长。中国消费了2,850万吨硫磺,主要得益于其为实现粮食自给自足目标而製定的磷肥目标。印度的农业扶持政策以及东南亚种植作物不断增长的化肥需求,正使该地区成为硫磺市场的重要成长引擎。
在北美,对超低硫柴油(ULSD)的投资以及内华达州和德克萨斯州锂硫电池工厂的建设,正在推动区域硫需求的成长,并巩固供需平衡。在欧洲,精密农业的进步和监管政策的调整,使得硫基土壤改良剂比合成化学品更受青睐。在中东和非洲,炼油厂回收率的提高和农业计画的推进,推动了化肥用量的增加,进一步实现了硫市场的地域多元化。
其他福利:
- Excel格式的市场预测(ME)表
- 3个月的分析师支持
目录
第一章 引言
- 研究假设和市场定义
- 调查范围
第二章调查方法
第三章执行摘要
第四章 市场情势
- 市场概览
- 市场驱动因素
- 化肥生产产业需求不断成长
- 扩大超低硫柴油(ULSD)炼製产能
- 橡胶硫化过程中硫磺用量增加
- 锂硫电池在电动车中的商业化
- 循环建筑中硫改质沥青与混凝土的推广应用
- 市场限制
- 无论地区如何,都应严格执行SOx排放法规
- 熔融硫磺的物流处理成本很高
- 由于炼油厂脱碳和原油脱硫减少,硫回收率下降
- 价值链分析
- 波特五力模型
- 供应商的议价能力
- 买方的议价能力
- 新进入者的威胁
- 替代品的威胁
- 竞争程度
第五章 市场规模与成长预测
- 按形式
- 固体的
- 液体
- 透过完成技术
- 颗粒
- 糊状产品
- 颗粒化
- 按最终用户行业划分
- 肥料
- 化学加工
- 金属製造
- 橡胶加工
- 其他终端用户产业
- 按地区
- 亚太地区
- 中国
- 印度
- 日本
- 韩国
- 东南亚国协
- 亚太其他地区
- 北美洲
- 我们
- 加拿大
- 墨西哥
- 欧洲
- 德国
- 英国
- 义大利
- 法国
- 俄罗斯
- 其他欧洲地区
- 南美洲
- 巴西
- 阿根廷
- 其他南美洲
- 中东和非洲
- 沙乌地阿拉伯
- 南非
- 其他中东和非洲地区
- 亚太地区
第六章 竞争情势
- 市场集中度
- 策略趋势
- 市占率(%)/排名分析
- 公司简介
- ADNOC
- China Petroleum & Chemical Corporation(Sinopec)
- Flexsys America LP
- Gazprom International Limited
- Indian Oil Corporation Ltd
- Marathon Petroleum Corporation
- QatarEnergy LNG
- Saudi Arabian Oil Co.
- Shell plc
- Suncor Energy Inc.
- Tengizchevroil LLP
- Valero
第七章 市场机会与未来展望
The Sulfur Market was valued at 84.79 Million metric tons in 2025 and estimated to grow from 88.74 Million metric tons in 2026 to reach 111.44 Million metric tons by 2031, at a CAGR of 4.66% during the forecast period (2026-2031).
Ongoing fertilizer consumption, refinery output tied to ultra-low-sulfur diesel (ULSD) mandates, and early-stage battery innovation keep the sulfur market on a steady expansion path even as environmental rules tighten. Asia-Pacific remains the geographic anchor, supplying and consuming the largest volumes thanks to population-driven food demand, refinery capacity, and industrial diversification. Solid-form material dominates logistics because it avoids the costly heating, specialized tanks, and safety controls required for molten handling. Competitive behavior skews toward integrated oil and gas conglomerates that treat sulfur recovery as a cost-offsetting by-product, yet premium outlets in lithium-sulfur batteries and sulfur-modified construction materials are motivating smaller specialists to build high-purity capacity. Persistent SOx-emission caps and high-cost molten logistics pose near-term hurdles, but they do not dilute the five-year growth outlook for the sulfur market.
Global Sulfur Market Trends and Insights
Rising Demand from Fertilizer Manufacturing
Global food-security targets keep fertilizer output high, anchoring 88.96% of sulfur market demand in 2025. India earmarked USD 68 billion to subsidize phosphate and potash nutrients in 2024, a policy that pulled large sulfur volumes into controlled-release blends. China's modernization drive supports sulfur supplementation to upgrade depleted soils, while palm-oil acreage in Indonesia and Malaysia lifts regional nutrient intensity. Precision agriculture systems require sulfur-rich micronutrient formulations, which raise the sulfur content per fertilizer unit and create a dispersed demand base that shields the sulfur market from regional shocks.
Expansion of Ultra-Low-Sulfur Diesel Refining Capacity
ULSD legislation forces refiners to extract sulfur from fuel, generating a supply that flows back into the sulfur market. New desulfurization units in Saudi Arabia's Jazan refinery added 650,000 metric tons in 2024, and Marathon Petroleum's Galveston Bay expansion supplied another 420,000 metric tons. North American and European refiners continue to invest, ensuring steady by-product output through 2030 and improving downstream access in regions that once struggled with limited sulfur availability.
Stringent SOx-Emission Regulations Across Regions
The EU Industrial Emissions Directive mandates 95% SOx abatement in sulfuric-acid plants by 2030. The U.S. National Ambient Air Quality Standards add USD 2-4 per metric ton in monitoring and scrubber costs, nudging small processors toward consolidation. China's tighter stack-emission limits introduce fines at 10% of revenue for non-compliance. These rules raise capital barriers that slow capacity additions, trimming growth momentum for the sulfur market in the near term.
Other drivers and restraints analyzed in the detailed report include:
- Increasing Sulfur Usage in Rubber Vulcanization
- Commercialization of Lithium-Sulfur Batteries for E-Mobility
- High Logistics and Handling Cost for Molten Sulfur
For complete list of drivers and restraints, kindly check the Table Of Contents.
Segment Analysis
Solid products represented 80.62% of the sulfur market share in 2025 and are tracking a 5.08% CAGR to 2031. Handling ease, lower insurance premiums and the absence of heated storage explain the preference among fertilizer producers lacking specialized infrastructure. The sulfur market size for solid material is poised to rise further as automated loading and dust-suppression upgrades lower operational risks.
Granular and prilled formats also improve product integrity during transport, align with ISO 14001 management systems and reduce environmental exposure. Liquid sulfur stays limited to large sulfuric-acid complexes where molten feed integrates directly into process lines, but its high logistics bill caps broad adoption. Solid sulfur therefore keeps its leadership as emerging battery and construction users also specify granulated inputs.
The Sulfur Market Report is Segmented by Form (Solid and Liquid), Finishing-Process Technology (Granules, Pastilles, and Prilling), End-User Industry (Fertilizer, Chemical Processing, Metal Manufacturing, Rubber Processing, and Other End-User Industries), and Geography (Asia-Pacific, North America, Europe, South America, and Middle-East and Africa). The Market Forecasts are Provided in Terms of Volume (Metric Tons).
Geography Analysis
Asia-Pacific held 39.40% of global volume in 2025 and is pacing a 5.55% CAGR to 2031. China consumed 28.5 million metric tons, driven by phosphate fertilizer targets aligned with grain self-sufficiency goals. India's farm-support schemes and Southeast Asian plantation crops push fertilizer tonnage upward, making the region the core growth engine of the sulfur market.
North America is propelled by ULSD investments and lithium-sulfur battery plants in Nevada and Texas, placing incremental pull on regional supply, anchoring a balanced demand-supply position. Europe advances on precision farming and regulatory shifts that favor sulfur-based soil additives over synthetic chemicals. Middle East and Africa expand refinery recovery and promote agriculture programs that enlarge fertilizer use, widening geographic diversification for the sulfur market.
- ADNOC
- China Petroleum & Chemical Corporation (Sinopec)
- Flexsys America L.P.
- Gazprom International Limited
- Indian Oil Corporation Ltd
- Marathon Petroleum Corporation
- QatarEnergy LNG
- Saudi Arabian Oil Co.
- Shell plc
- Suncor Energy Inc.
- Tengizchevroil LLP
- Valero
Additional Benefits:
- The market estimate (ME) sheet in Excel format
- 3 months of analyst support
TABLE OF CONTENTS
1 Introduction
- 1.1 Study Assumptions and Market Definition
- 1.2 Scope of the Study
2 Research Methodology
3 Executive Summary
4 Market Landscape
- 4.1 Market Overview
- 4.2 Market Drivers
- 4.2.1 Rising demand from fertilizer manufacturing
- 4.2.2 Expansion of ultra-low-sulfur diesel (ULSD) refining capacity
- 4.2.3 Increasing sulfur usage in rubber vulcanization
- 4.2.4 Commercialization of lithium-sulfur batteries for e-mobility
- 4.2.5 Growing adoption of sulfur-modified asphalt and concrete in circular construction
- 4.3 Market Restraints
- 4.3.1 Stringent SOx-emission regulations across regions
- 4.3.2 High logistics and handling cost for molten sulfur
- 4.3.3 Declining sulfur recovery as refineries decarbonize and desulfurize less crude
- 4.4 Value Chain Analysis
- 4.5 Porter's Five Forces
- 4.5.1 Bargaining Power of Suppliers
- 4.5.2 Bargaining Power of Buyers
- 4.5.3 Threat of New Entrants
- 4.5.4 Threat of Substitutes
- 4.5.5 Degree of Competition
5 Market Size and Growth Forecasts (Volume)
- 5.1 By Form
- 5.1.1 Solid
- 5.1.2 Liquid
- 5.2 By Finishing-Process Technology
- 5.2.1 Granules
- 5.2.2 Pastilles
- 5.2.3 Prilling
- 5.3 By End-User Industry
- 5.3.1 Fertilizer
- 5.3.2 Chemical Processing
- 5.3.3 Metal Manufacturing
- 5.3.4 Rubber Processing
- 5.3.5 Other End-User Industries
- 5.4 By Geography
- 5.4.1 Asia-Pacific
- 5.4.1.1 China
- 5.4.1.2 India
- 5.4.1.3 Japan
- 5.4.1.4 South Korea
- 5.4.1.5 ASEAN Countries
- 5.4.1.6 Rest of Asia-Pacific
- 5.4.2 North America
- 5.4.2.1 United States
- 5.4.2.2 Canada
- 5.4.2.3 Mexico
- 5.4.3 Europe
- 5.4.3.1 Germany
- 5.4.3.2 United Kingdom
- 5.4.3.3 Italy
- 5.4.3.4 France
- 5.4.3.5 Russia
- 5.4.3.6 Rest of Europe
- 5.4.4 South America
- 5.4.4.1 Brazil
- 5.4.4.2 Argentina
- 5.4.4.3 Rest of South America
- 5.4.5 Middle-East and Africa
- 5.4.5.1 Saudi Arabia
- 5.4.5.2 South Africa
- 5.4.5.3 Rest of Middle-East and Africa
- 5.4.1 Asia-Pacific
6 Competitive Landscape
- 6.1 Market Concentration
- 6.2 Strategic Moves
- 6.3 Market Share (%)/Ranking Analysis
- 6.4 Company Profiles {(includes Global level Overview, Market level overview, Core Segments, Financials as available, Strategic Information, Market Rank/Share for key companies, Products and Services, and Recent Developments)}
- 6.4.1 ADNOC
- 6.4.2 China Petroleum & Chemical Corporation (Sinopec)
- 6.4.3 Flexsys America L.P.
- 6.4.4 Gazprom International Limited
- 6.4.5 Indian Oil Corporation Ltd
- 6.4.6 Marathon Petroleum Corporation
- 6.4.7 QatarEnergy LNG
- 6.4.8 Saudi Arabian Oil Co.
- 6.4.9 Shell plc
- 6.4.10 Suncor Energy Inc.
- 6.4.11 Tengizchevroil LLP
- 6.4.12 Valero
7 Market Opportunities and Future Outlook
- 7.1 White-space and unmet-need assessment
 2026年全球硫磺市场报告
 2025-2029年全球熔融硫市场
 亚硫酰氯市场按产品类型、分销管道、应用和最终用途行业划分-2026年至2032年全球预测亚硫酰氯溶液市场按等级、浓度、包装和应用划分-2026-2032年全球预测可湿性硫磺市场依形态、作物类型、应用方法、最终用户和通路划分,全球预测(2026-2032年)工业亚硫酰氯市场依等级、应用、终端用户产业及通路划分-2026-2032年全球预测硫氧氯化物市场按产品类型、纯度、销售管道、应用及最终用途产业划分-2026年至2032年全球预测
 2025年全球硫磺市场研究报告
 硫磺丸市场规模、份额及成长分析(按类型、製程、应用和地区划分)-产业预测(2026-2033 年)
 硫磺的全球市场(~2035年):各形状类型,各技术类型,各终端用户,各流通管道类型,各地区,产业趋势,预测