


 |
市场调查报告书
商品编码
1939128
资料中心冷却:市场占有率分析、产业趋势与统计、成长预测(2026-2032)Data Center Cooling - Market Share Analysis, Industry Trends & Statistics, Growth Forecasts (2026 - 2032) |
||||||
※ 本网页内容可能与最新版本有所差异。详细情况请与我们联繫。
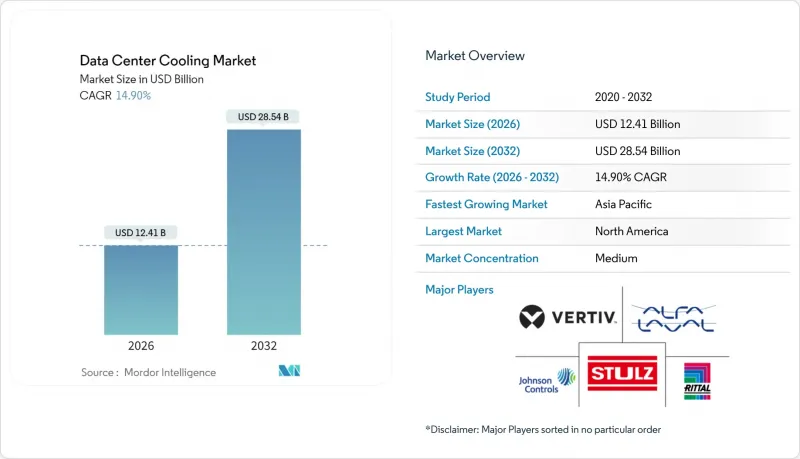
2025年资料中心冷却市场价值108亿美元,预计到2032年将达到285.4亿美元,高于2026年的124.1亿美元。
预计在预测期(2026-2032 年)内,复合年增长率将达到 14.90%。
从空气冷却系统向液体冷却系统的持续过渡推动了这一增长,超大规模资料中心建设、人工智慧晶片的热负荷以及对低全球暖化潜值(GWP)冷媒的强制性要求,都推动了近期采购的成长势头。液体冷却解决方案已占资料中心冷却市场的46%,到2031年将以17.50%的复合年增长率成长,这表明市场对晶片直接冷却和浸没式冷却架构的偏好将持续存在。虽然超大规模营运商是最大的需求来源,但随着5G推动区域网路的发展,边缘运算和微型站点部署的成长速度最快,达到18.00%。按地区划分,北美占总支出的76%,而亚太地区18.20%的复合年增长率凸显了新加坡、中国和日本支出的加速成长,这些地区的高密度设计弥补了土地资源的限制。 2024年至2025年,竞争格局将更加激烈。江森自控将价值81亿美元的暖通空调资产出售给博世,以专注于专用资料中心冷却器业务。Schneider Electric收购了浸没式冷却专家 Motivair,这标誌着该公司策略向液冷技术转型。
全球资料中心冷却市场趋势与洞察
人工智慧和高效能运算工作负载推动了热密度的快速成长。
如今,GPU密度高的伺服器每个机架的散热量超过200kW,远远超过传统的10kW阈值,也超过了传统的精密空调机组。因此,直接冷却板和全浸式冷却槽正从试点阶段走向生产阶段,尤其是在Meta和微软的AI丛集。晶片製造商正在将液冷通道整合到下一代封装中,模糊了运算晶片和设施基础设施之间的界限。同时,监管机构正在推动PUE值低于1.3,这创造了一种有利于液冷技术的双压环境。
二线都会区超大规模设施的扩张
在凤凰城、哥伦布和大阪等城市,由于公共产业基础设施往往不完善,开发商正寻求低廉的土地成本和绿能。因此,计划纷纷采用模组化冷却器和后门式热交换器,以缩短试运行週期并应对较大的环境温度波动。此外,这些地区的城市气候提供了更长的自然通风时间,有助于降低影响基板资本投资核准的生命週期成本指标。
先进液体技术的资本投资溢价
浸没式水槽比传统的热通道密闭系统贵60%,而且专用介电液每公升售价5-7美元,对于装置容量低于2兆瓦的场所来说,投资回报颇具挑战性。然而,在电力成本较高的地区,30-40%的节能效果可以将投资回收期缩短至三年以内。
细分市场分析
预计到2026年,液冷资料中心市场规模将达到59亿美元,到2032年将超过153.3亿美元,复合年增长率(CAGR)为17.25%。直接晶片冷却管线在新兴的人工智慧机架中占据主导地位,而两相浸没式冷却液则用于加密哈希丛集等特定工作负载。在机架密度低于15kW的企业环境中,气冷式冷却器和精密空调(CRAC)阵列仍然很常见,但随着监管机构对电源使用效率(PUE)目标的日益严格,它们的市场份额正在逐年下降。为了应对这项挑战,供应商正在推出混合冷却器,将乙二醇迴路和隔热垫结合,以延长自然冷却的使用寿命。
后门式热交换器为不愿在整个机房内重新布置机架的营运商提供了解决方案。单一热交换器无需焊接地板即可将机架容量从 12kW 提升至 30kW。同时,专利的微对流冷板技术可实现 350W/cm² 的热通量去除,标誌着液冷技术正式成为 x86 伺服器的主流选择。边缘机箱采用工厂密封的冷却模组,减少了现场施工,并符合无人操作的要求。
机房空调仍占总支出的30.60%,但其3.75%的复合年增长率低于整个资料中心冷却市场。同时,由于液冷技术的普及带动了管道需求的成长,冷水机组和热交换器将以15.70%的复合年增长率成长。泵浦、阀门和冗余歧管将受益于直通式迴路的广泛应用,预计到2026年将成为一个价值19.5亿美元的细分市场。人工智慧驱动的监控软体成长最快,Google和阿里巴巴等园区透过调整风扇转速和压缩机分级运行,实现了15%至25%的节能效果。虽然价格昂贵,但整合了硬体、遥测和机器学习控制的套件能够带来可量化的营运成本节约,并且比独立主机更容易获得财务长的认可。
资料中心冷却市场按冷却技术(气冷、液冷)、冷却组件(机房空调机组 (CRAH/CRAC)、冷却器和热交换器等)、资料中心类型(超大规模、企业级、主机)、终端用户产业(IT 和电信、零售和消费品等)以及地区进行细分。市场预测以以金额为准。
区域分析
预计到2026年,北美资料中心冷却市场规模将达到93.5亿美元,主要得益于凤凰城、亚特兰大和哥伦布等地的超大规模资料中心园区优先采用可在冷凝器迴路中使用再生污水的液体冷却器。持续的夏季热浪减少了自然通风的时间,促使操作员增加隔热冷却器以提高系统韧性。
2026年亚太市场规模为17.3亿美元,预计到2032年将超过46.4亿美元,复合年增长率达17.85%。新加坡已重新开放新建筑许可,但设定了PUE值低于1.3的目标,鼓励竞标采用海水冷却和液体浸没式冷却技术。东京的密集化策略是建造多层机房,并在每层都配备直接膨胀式盘管;而孟买沿海地区的高湿度则促使更多计划采用混合式冷却器来缓解缺水问题。
预计到2026年,欧洲市场规模将达到11.4亿美元。北欧国家已从资料中心回收250兆瓦的废热,作为区域供热的热源。法兰克福和阿姆斯特丹已推出废热再利用配额,以鼓励购买高品质的水循环系统。在中东和非洲,人们正在采用液冷技术来应对高达摄氏50度的室外高温。杜拜透过使用现场太阳能发电厂和蓄热罐,将冷却设备的电力消耗降低了17%。在拉丁美洲,克雷塔罗和圣地牙哥正在建造新建设,安装间接蒸发冷却模组,以利用凉爽的夜间气候。儘管白天温度很高,但这些项目的PUE值仍达到了1.2。
其他福利:
- Excel格式的市场预测(ME)表
- 3个月的分析师支持
目录
第一章 引言
- 研究假设和市场定义
- 调查范围
第二章调查方法
第三章执行摘要
第四章 市场情势
- 市场概览
- 市场驱动因素
- 人工智慧和高效能运算工作负载推动了热密度的快速成长。
- 二线都会区超大规模设施的扩张
- 强制性PUE/温室气体揭露法规
- 全球频繁的热浪增加了冷气需求。
- 利用区域供热迴路实现废热货币化
- 利用税收优惠扩大地方电网边缘基础设施
- 市场限制
- 先进液冷技术的资本投资溢价
- 维修传统閒置频段的复杂性
- 低全球暖化潜势冷媒的供应限制
- 使用非标准浸渍液带来的保固风险
- 冷气成本的关键考虑因素
- 资料中心营运主要成本开销分析(重点关注冷却)
- 冷冻技术比较研究(设计复杂性、PUE、优缺点、气候条件利用率)
- 资料中心冷却的关键创新和发展趋势
- 资料中心采取的主要节能措施
- 价值/供应链分析
- 监管环境
- 技术展望
5. 目前资料中心面积分析
- 资料中心 IT 负载容量(兆瓦)和面积(平方英尺)分析(2019-2031 年)
- 主要资料中心集群分析
- 主要新型超大规模设施分析
第六章 市场规模及成长预测(价值,十亿美元)
- 透过冷却技术
- 空气冷却法
- 冷却器和节热器
- CRAH(电脑房空调机组)
- 冷却塔(直接冷却式、间接冷却式、两级冷却式)
- 其他空气冷却技术
- 液冷法
- 浸没式冷却
- 晶片直接冷却
- 后门热交换器
- 空气冷却法
- 透过冷却组件
- 电脑房空调机组(CRAH/CRAC)
- 冷却器和热交换装置
- 冷却塔和干式冷却器
- 泵浦和阀门
- 控制和监控软体
- 依资料中心类型
- 超大规模(自有和租赁)
- 企业版(本地部署)
- 搭配
- 按最终用户行业划分
- 资讯科技和电信
- 零售和消费品
- 卫生保健
- 媒体与娱乐
- 联邦政府和政府机构
- 其他最终用户
- 按地区
- 北美洲
- 我们
- 加拿大
- 墨西哥
- 南美洲
- 巴西
- 阿根廷
- 智利
- 其他南美洲
- 欧洲
- 德国
- 英国
- 法国
- 其他欧洲地区
- 亚太地区
- 中国
- 印度
- 日本
- 亚太其他地区
- 中东和非洲
- 中东
- 非洲
- 北美洲
第七章 竞争情势
- 市占率分析
- 公司简介
- Vertiv
- Schneider Electric
- Stulz
- Rittal
- Johnson Controls
- Alfa Laval
- Fujitsu General
- Hitachi
- CoolIT Systems
- LiquidStack
- Asetek
- Asperitas
- Chilldyne
- Mikros Technologies
- Kaori Heat Treatment
- Lenovo
- Nortek Air Solutions
- Delta Electronics
- Munters
- Airedale(Modine)
- Black Box(Chatsworth Prod.)
- Submer
- GRC(Green Revolution Cooling)
- Coolcentric
- Starline
第八章:市场机会与未来展望
第九章 投资分析
The data center cooling market was valued at USD 10.80 billion in 2025 and estimated to grow from USD 12.41 billion in 2026 to reach USD 28.54 billion by 2032, at a CAGR of 14.90% during the forecast period (2026-2032).
Ongoing migration from air-based to liquid-based thermal systems underpins this expansion, while hyperscale build-outs, AI chip heat loads and low-GWP refrigerant mandates reinforce near-term purchasing momentum. Liquid solutions already claim a 46% data center cooling market share, and their 17.50% CAGR through 2031 signals lasting preference for direct-to-chip and immersion architectures. Hyperscale operators represent the single largest demand node, yet edge and micro-site deployments now post the fastest growth at 18.00% as 5G densifies rural networks. Geographically, North America contributes 76% of spending, but Asia-Pacific's 18.20% CAGR highlights accelerating spend in Singapore, China and Japan, where high-density designs offset land constraints. Competitive dynamics intensified in 2024-2025: Johnson Controls divested USD 8.1 billion of HVAC assets to Bosch to double down on data center-specific chillers, and Schneider Electric added immersion specialist Motivair to its portfolio, signaling a strategic pivot toward liquid engineering.
Global Data Center Cooling Market Trends and Insights
AI and HPC workload heat-density surge
GPU-dense servers now dissipate beyond 200 kW per rack, dwarfing legacy 10 kW envelopes and rendering conventional CRAC units ineffective. Direct-to-chip cold plates and full-immersion baths have therefore moved from pilots to production floors, particularly inside Meta and Microsoft AI clusters. Chipmakers embed liquid interface channels in next-generation packages, eroding the barrier between compute silicon and facility infrastructure Regulatory bodies simultaneously push PUE below 1.3, creating a dual-pressure environment that favors liquid technologies.
Hyperscale footprint expansion in secondary metros
Operators chase lower land costs and cleaner power in Phoenix, Columbus and Osaka, but those locations often lack mature utility infrastructure. As a result, projects specify modular chillers and rear-door heat exchangers that shorten commissioning cycles and tolerate wide ambient swings. Secondary-city climates also grant more free-air hours, lowering lifecycle cost metrics that drive board-level cap-ex approvals.
Cap-ex premium of advanced liquid technologies
Immersion tanks cost 60% more than traditional hot-aisle containment, and specialized dielectric fluids range USD 5-7 per liter, challenging ROI in sites below 2 MW. Nevertheless, energy savings of 30-40% compress payback to under three years in high-electricity-tariff regions.
Other drivers and restraints analyzed in the detailed report include:
- Mandatory PUE / GHG disclosure regulations
- Global heat-wave frequency raising cooling demand
- Retrofit complexity in legacy white-spaces
For complete list of drivers and restraints, kindly check the Table Of Contents.
Segment Analysis
The data center cooling market size for liquid methods reached USD 5.90 billion in 2026 and will eclipse USD 15.33 billion by 2032, advancing at 17.25% CAGR. Direct-to-chip pipelines dominate new AI racks, while dual-phase immersion tubs claim niche workloads such as crypto hashing clusters. Air-based chiller and CRAC arrays remain common in enterprise environments where rack densities linger below 15 kW, yet their share declines annually as regulations squeeze PUE targets. Vendors counter with hybrid coolers marrying glycol loops and adiabatic pads to extend free-cooling seasons.
Rear-door heat exchangers bridge the gap for operators unwilling to re-rack entire halls; a single exchanger lifts rack capacity from 12 kW to 30 kW without floor welding. Meanwhile, patents on microconvective cold plates promise 350 W/cm2 heat flux removal, foreshadowing liquid's march into mainstream x86 servers. Edge enclosures import factory-sealed coolant modules to slash on-site labor, aligning with unmanned operation mandates.
Computer-room air handlers still account for 30.60% of spend, but their 3.75% CAGR lags the overall data center cooling market. Conversely, chillers and heat-exchanger units will log 15.70% CAGR as liquid adoption expands pipework demand. Pumps, valves and redundancy manifolds form a USD 1.95 billion submarket in 2026, benefitting from direct-to-chip loop proliferation. AI-driven supervisory software posts the fastest growth, trimming fan RPM and compressor staging to save 15-25% energy at Google and Alibaba campuses. Integrated suites that blend hardware, telemetry and machine-learning controls command premium pricing yet deliver quantifiable OPEX reduction, convincing CFOs faster than standalone consoles.
Data Center Cooling Market is Segmented by Cooling Technology (Air-Based Cooling, Liquid-Based Cooling), Cooling Component (Computer-Room Air Handlers (CRAH/CRAC), Chillers and Heat-Exchanger Units, and More), Data Center Type (Hyperscale, Enterprise, Colocation), End-User Industry (IT and Telecom, Retail and Consumer Goods, and More), and Geography. The Market Forecasts are Provided in Terms of Value (USD).
Geography Analysis
North America recorded USD 9.35 billion of data center cooling market size in 2026, driven by hyperscale campuses in Phoenix, Atlanta and Columbus that favor liquid chillers able to exploit reclaimed wastewater for condenser loops. Extended summer heat waves shorten free-air windows, prompting operators to add adiabatic trim coolers for resilience.
Asia-Pacific contributed USD 1.73 billion in 2026 but will surpass USD 4.64 billion by 2032 on an 17.85% CAGR. Singapore reinstated new-build permits contingent on sub-1.3 PUE targets, steering bids toward seawater and liquid immersions. Tokyo's densification strategy stacks multi-story halls using direct-expansion coils for each floor, while Mumbai's coastal humidity inclines projects toward hybrid fluid coolers that mitigate water scarcity.
Europe generated USD 1.14 billion in 2026, with Nordic states extracting 250 MW of district-heating value from data center exhaust water. Frankfurt and Amsterdam now impose waste-heat-reuse quotas, nudging procurements toward high-grade water loops. Middle East and Africa adopt liquid cooling to battle 50 °C ambient peaks; Dubai's collocated solar farm plus thermal-storage tank trims chiller electricity by 17%. Latin America saw emergent builds in Queretaro and Santiago, where cooler night air favors indirect evaporative modules that achieve 1.2 PUE despite high daytime highs.
List of Companies Covered in this Report:
- Vertiv
- Schneider Electric
- Stulz
- Rittal
- Johnson Controls
- Alfa Laval
- Fujitsu General
- Hitachi
- CoolIT Systems
- LiquidStack
- Asetek
- Asperitas
- Chilldyne
- Mikros Technologies
- Kaori Heat Treatment
- Lenovo
- Nortek Air Solutions
- Delta Electronics
- Munters
- Airedale (Modine)
- Black Box (Chatsworth Prod.)
- Submer
- GRC (Green Revolution Cooling)
- Coolcentric
- Starline
Additional Benefits:
- The market estimate (ME) sheet in Excel format
- 3 months of analyst support
TABLE OF CONTENTS
1 INTRODUCTION
- 1.1 Study Assumptions and Market Definition
- 1.2 Scope of the Study
2 RESEARCH METHODOLOGY
3 EXECUTIVE SUMMARY
4 MARKET LANDSCAPE
- 4.1 Market Overview
- 4.2 Market Drivers
- 4.2.1 AI and HPC workload heat-density surge
- 4.2.2 Hyperscale footprint expansion in secondary metros
- 4.2.3 Mandatory PUE / GHG disclosure regulations
- 4.2.4 Global heat-wave frequency raising cooling demand
- 4.2.5 Monetisation of waste heat via district-energy loops
- 4.2.6 Tax-incentivised edge build-outs in rural grids
- 4.3 Market Restraints
- 4.3.1 Cap-ex premium of advanced liquid technologies
- 4.3.2 Retrofit complexity in legacy white-spaces
- 4.3.3 Limited supply of low-GWP refrigerants
- 4.3.4 Warranty-risk from non-standard immersion fluids
- 4.4 Key Cost Considerations for Cooling
- 4.4.1 Analysis of Key Cost Overheads Related to DC Operations (Cooling Focus)
- 4.4.2 Comparative Study of Cooling Technologies (Design Complexity, PUE, Pros/Cons, Weather Utilization)
- 4.4.3 Key Innovations and Developments in Data Center Cooling
- 4.4.4 Key Energy-Efficiency Practices Adopted in Data Centers
- 4.5 Value / Supply-Chain Analysis
- 4.6 Regulatory Landscape
- 4.7 Technological Outlook
5 ANALYSIS OF CURRENT DATA CENTER FOOTPRINT
- 5.1 Analysis of IT Load Capacity (MW) and Area footprint (Sq. Ft.) of Data Centers (for the period of 2019-2031)
- 5.2 Analysis of the major Data Center Hotspots
- 5.3 Analysis of Major Upcoming Hyperscale Facilities
6 MARKET SIZE and GROWTH FORECASTS (VALUE, USD BN)
- 6.1 By Cooling Technology
- 6.1.1 Air-based Cooling
- 6.1.1.1 Chiller and Economizer
- 6.1.1.2 CRAH (Computer-Room Air Handler)
- 6.1.1.3 Cooling Tower (Direct, Indirect, Two-Stage)
- 6.1.1.4 Other Air-based Cooling Technologies
- 6.1.2 Liquid-based Cooling
- 6.1.2.1 Immersion Cooling
- 6.1.2.2 Direct-to-Chip Cooling
- 6.1.2.3 Rear-Door Heat Exchanger
- 6.1.1 Air-based Cooling
- 6.2 By Cooling Component
- 6.2.1 Computer-Room Air Handlers (CRAH/CRAC)
- 6.2.2 Chillers and Heat-Exchanger Units
- 6.2.3 Cooling Towers and Dry Coolers
- 6.2.4 Pumps and Valves
- 6.2.5 Control and Monitoring Software
- 6.3 By Data Center Type
- 6.3.1 Hyperscale (Owned and Leased)
- 6.3.2 Enterprise (On-Premise)
- 6.3.3 Colocation
- 6.4 By End-user Industry
- 6.4.1 IT and Telecom
- 6.4.2 Retail and Consumer Goods
- 6.4.3 Healthcare
- 6.4.4 Media and Entertainment
- 6.4.5 Federal and Institutional Agencies
- 6.4.6 Other End users
- 6.5 By Geography
- 6.5.1 North America
- 6.5.1.1 United States
- 6.5.1.2 Canada
- 6.5.1.3 Mexico
- 6.5.2 South America
- 6.5.2.1 Brazil
- 6.5.2.2 Argentina
- 6.5.2.3 Chile
- 6.5.2.4 Rest of South America
- 6.5.3 Europe
- 6.5.3.1 Germany
- 6.5.3.2 United Kingdom
- 6.5.3.3 France
- 6.5.3.4 Rest of Europe
- 6.5.4 Asia-Pacific
- 6.5.4.1 China
- 6.5.4.2 India
- 6.5.4.3 Japan
- 6.5.4.4 Rest of Asia-Pacific
- 6.5.5 Middle East and Africa
- 6.5.5.1 Middle East
- 6.5.5.2 Africa
- 6.5.1 North America
7 COMPETITIVE LANDSCAPE
- 7.1 Market Share Analysis
- 7.2 Company Profiles (includes Global level Overview, Market level overview, Core Segments, Financials as available, Strategic Information, Market Rank/Share for key companies, Products and Services, and Recent Developments)
- 7.2.1 Vertiv
- 7.2.2 Schneider Electric
- 7.2.3 Stulz
- 7.2.4 Rittal
- 7.2.5 Johnson Controls
- 7.2.6 Alfa Laval
- 7.2.7 Fujitsu General
- 7.2.8 Hitachi
- 7.2.9 CoolIT Systems
- 7.2.10 LiquidStack
- 7.2.11 Asetek
- 7.2.12 Asperitas
- 7.2.13 Chilldyne
- 7.2.14 Mikros Technologies
- 7.2.15 Kaori Heat Treatment
- 7.2.16 Lenovo
- 7.2.17 Nortek Air Solutions
- 7.2.18 Delta Electronics
- 7.2.19 Munters
- 7.2.20 Airedale (Modine)
- 7.2.21 Black Box (Chatsworth Prod.)
- 7.2.22 Submer
- 7.2.23 GRC (Green Revolution Cooling)
- 7.2.24 Coolcentric
- 7.2.25 Starline
8 MARKET OPPORTUNITIES and FUTURE OUTLOOK
9 INVESTMENT ANALYSIS
 资料中心冷却市场:2026-2032年全球市场预测(以交付方式、系统整合、冷却方式、额定功率、资料中心类型、最终用户和部署模式划分)
 2026年航太港资料中心冷却全球市场报告
 全球资料中心管道市场:按管道类型、管道材质、应用、资料中心类型和地区划分-预测至2032年英洛冷冻市场:依产品类型、冷冻方式、安装方式、冷气量和最终用户划分-2026-2032年全球预测
 资料中心冷却市场分析及预测(至2035年):按类型、产品、服务、技术、组件、应用、部署、最终用户、设备及解决方案划分
 资料中心冷却市场报告:解决方案、服务、冷却方法、冷却技术、资料中心类型、产业和地区(2026-2034 年)整合式机架安装单元 (CDU) 市场:按阶段、容量、应用和最终用户分類的全球预测,2026-2032 年资料中心CDU市场:按类型、组件、冷却方式、容量、应用工作负载、最终用途、企业规模、安装方式、分销管道划分,全球预测,2026-2032年
 资料中心冷却市场:依组件、冷却技术、资料中心类型和行业划分 - 全球预测至2036年
 全球资料中心冷却市场规模、份额、趋势和成长分析报告(2026-2034年)