


 |
市场调查报告书
商品编码
1939145
生物肥料:市场占有率分析、产业趋势与统计、成长预测(2026-2031)Biofertilizers - Market Share Analysis, Industry Trends & Statistics, Growth Forecasts (2026 - 2031) |
||||||
※ 本网页内容可能与最新版本有所差异。详细情况请与我们联繫。
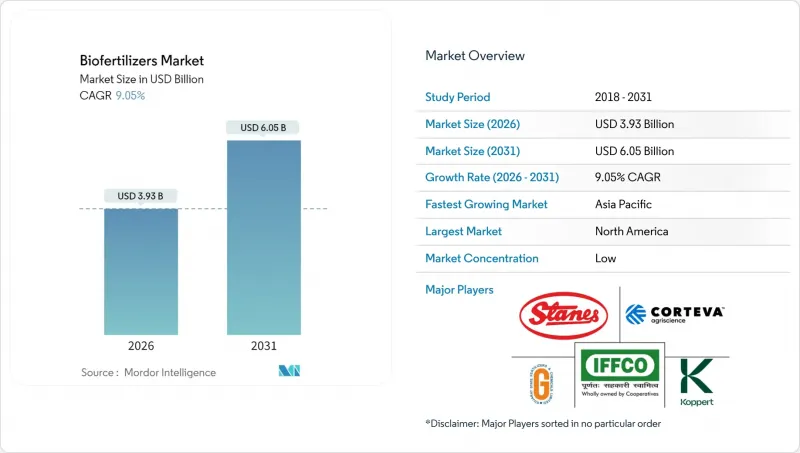
预计生物肥料市场将从 2025 年的 36 亿美元成长到 2026 年的 39.3 亿美元,到 2031 年将达到 60.5 亿美元,2026 年至 2031 年的复合年增长率为 9.05%。
永续农业的强劲发展势头、日益严格的环境法规以及有机认证产品的高溢价正在推动市场需求。北美目前在生物肥料市场占据领先地位,预计到2024年将占据36.2%的市场份额,这反映了其成熟的有机认证体系和政府成本分担计画。亚太地区在成长中扮演着主导角色,这主要得益于印度和中国的国家补贴计划,以及该地区正经历着从合成投入物向生物投入物的转变。在所有地区,排碳权货币化、精准施肥工具和复杂的微生物群落都在为供应商和种植者拓展利润来源。主要农业投入品企业与区域专业企业之间的整合进一步加速了技术的应用,同时也重塑了竞争格局。
全球生物肥料市场趋势与洞察
消费者转向有机食品推动了高端市场的扩张
预计到2024年,有机食品销售额将达到1,340亿美元,年增15.2%。获得认证的有机产品价格溢价20%至40%。零售商现在要求提供检验核实的生物投入记录才能确保货架空间,这促使生产商采用生物肥料市场解决方案以符合规定。欧洲人均有机食品消费量最高,其中德国和荷兰的需求持续稳定。传统有机食品领域以外的品牌所有者也在采用生物投入并扩大种植面积,以履行其永续性。这些趋同动态改善了供应商的收入前景,并增强了生物肥料市场的长期成长潜力。
政府补贴提高经济可行性
美国农业部(USDA)已在其环境品质激励计画(EQIP)下累计3亿美元,用于在2024年报销符合条件的生物肥料成本的75%。同年,印度化学和肥料部也启动了一项410亿卢比(约5亿美元)的推广计画。欧盟每年透过其生态计画拨款81亿欧元(约87亿美元)推广检验的生物投入品。巴西在其国家生物投入品计画下,为微生物生产设施提供税收减免。这些激励措施正在缩短生产商的投资回收期,并推动生物肥料市场实现两位数成长。
低温运输基础设施的限制阻碍了市场准入
生物肥料需要储存在2°C至8°C之间,但在室温下,其活性每月会下降15%至30%。 40%的开发中国家缺乏足够的冷藏设施,导致分销成本增加高达四倍。物流障碍阻碍了零售分销,也使得小规模经销商无法储备活性微生物产品。冷冻干燥和包埋技术可以将保质期延长至近两年,但会使生产成本增加35%至50%。在现有低温运输基础设施缺口得到有效解决之前,这项挑战将继续阻碍生物肥料市场的成长潜力。
细分市场分析
截至2025年,菌根真菌产品占生物肥料市场份额的35.74%。丛枝菌根真菌可使玉米、大豆和蔬菜田的磷吸收率提高20-35%。根瘤菌製剂可透过固氮作用减少每公顷高达60公斤的合成肥料用量,预计将推动2026年至2031年间10.25%的复合年增长率。双菌种混合物日益受到关注,美国环保署(EPA)的核准不断增加,这推动了高附加价值产品的成长。旨在提高作物耐受性和扩大种植面积的多菌株研究支撑了复合年增长率的预测,并吸引了新的资金流入生物肥料市场的这一领域。
发酵技术的持续投入,结合精准载体材料的使用,正在提升储存稳定性与田间均匀性。提供农艺咨询和产品配送服务的供应商正赢得大型种植者和合作社的支持。详尽的应用数据正指导着下一代研发,促进了针对不同土壤特性客製化接种剂方案的开发。这些进步推高了平均售价,进一步巩固了菌根及相关菌丛产品在生物肥料市场的竞争优势。
生物肥料市场报告按菌种(固氮螺菌属、固氮菌、菌根、磷酸盐可溶性细菌、根瘤菌属等)、作物类型(经济作物、园艺作物等)和地区(非洲、亚太地区、欧洲、中东、北美等)进行细分。市场预测以价值(美元)和数量(公吨)为单位。
区域分析
到2025年,北美将占生物肥料市场35.62%的份额,其中美国将占据较大份额以满足区域需求。联邦政府的奖励、成熟的低温运输和完善的推广服务支撑着销售量的持续成长。加拿大草原地区,特别是油菜籽和小麦种植区,生物肥料的应用仍在持续成长;而墨西哥则利用有机认证发展出口导向园艺产品。高研发投入、强大的经销网络和广泛的数位化农业平台,使北美成为生物肥料市场先进接种剂技术的部署中心。
亚太地区是成长最快的地区,预计到2031年将以9.74%的复合年增长率成长。印度正透过一项410亿卢比的补贴计画推动成长,该计画每年向4500万农民分发微生物材料。中国正透过区域示范田推广化肥减量20%,目标是到2025年实现4.385亿美元的减量。日本和澳洲正在投资高精度施肥系统,而越南和印尼则在稻田和棕榈种植园推广生物肥料。农村冷库设施和国家推广中心的扩建降低了推广门槛,提高了该地区对全球生物肥料市场的贡献。
欧洲在以金额为准位居第二,这得益于欧盟的「从农场到餐桌」目标和通用农业政策的环境支付机制。德国以23%的区域收入占比领先,其次是法国和义大利。英国脱欧后,正利用其环境土地管理支付资金来推广生物投入品。东欧的现代化项目正以两位数的速度推动需求成长。南美洲,尤其是巴西和阿根廷,正利用大规模的大豆轮作来整合固氮菌种,从而扩大生物肥料市场的地理覆盖范围。
其他福利:
- Excel格式的市场预测(ME)表
- 3个月的分析师支持
目录
第一章 引言
- 研究假设和市场定义
- 调查范围
- 调查方法
第二章执行摘要和主要发现
第三章 报告
第四章:主要产业趋势
- 有机耕作面积
- 人均有机产品支出
- 法律规范
- 阿根廷
- 澳洲
- 巴西
- 加拿大
- 中国
- 埃及
- 法国
- 德国
- 印度
- 印尼
- 伊朗
- 义大利
- 日本
- 墨西哥
- 荷兰
- 奈及利亚
- 菲律宾
- 俄罗斯
- 南非
- 西班牙
- 泰国
- 土耳其
- 英国
- 我们
- 越南
- 价值炼和通路分析
- 市场驱动因素
- 消费者对有机食品的偏好正在推动高端市场的扩张。
- 政府补贴提高经济可行性
- 环境法规加速了合成材料的替代
- 扩大经认证的有机农地以满足需求
- 生物肥料使用中排碳权的货币化
- 利用微生物群落提高植物的耐旱性和耐盐性
- 市场限制
- 低温运输基础设施的限制阻碍了市场准入
- 不同农业系统的性能差异
- 来自生物刺激剂和奈米肥料的竞争日益加剧
- 申请新型微生物菌株专利的障碍
第五章 市场规模和成长预测(价值和数量)
- 形式
- 固氮螺菌
- 固氮菌
- 菌根
- 溶磷细菌
- 根瘤菌
- 其他生物肥料
- 作物类型
- 经济作物
- 园艺作物
- 田间作物
- 地区
- 非洲
- 按国家/地区
- 埃及
- 奈及利亚
- 南非
- 其他非洲地区
- 按国家/地区
- 亚太地区
- 按国家/地区
- 澳洲
- 中国
- 印度
- 印尼
- 日本
- 菲律宾
- 泰国
- 越南
- 亚太其他地区
- 按国家/地区
- 欧洲
- 按国家/地区
- 法国
- 德国
- 义大利
- 荷兰
- 俄罗斯
- 西班牙
- 土耳其
- 英国
- 其他欧洲地区
- 按国家/地区
- 中东
- 按国家/地区
- 伊朗
- 沙乌地阿拉伯
- 其他中东地区
- 按国家/地区
- 北美洲
- 按国家/地区
- 加拿大
- 墨西哥
- 我们
- 北美其他地区
- 按国家/地区
- 南美洲
- 按国家/地区
- 阿根廷
- 巴西
- 南美洲其他地区
- 按国家/地区
- 非洲
第六章 竞争情势
- 关键策略倡议
- 市占率分析
- 公司简介
- 公司简介
- Gujarat State Fertilizers & Chemicals Ltd
- IPL Biologicals Limited
- Koppert Biological Systems Inc.
- Novonesis Group
- Rizobacter Argentina SA(Bioceres Crop Solutions)
- Symborg Inc.(Corteva Agriscience)
- Andermatt Group AG
- T. Stanes and Company Limited
- Atlantica Agricola
- Biostadt India Limited
- Kiwa Bio-Tech
- Lallemand Inc.
- Certis Biologicals(Mitsui & Co.)
- Indian Farmers Fertiliser Cooperative Limited
- Indogulf Company
- Bionema Ltd
- Binzhou Jingyang Biological Fertilizer Co. Ltd
- Sustane Natural Fertilizer Inc.
第七章:CEO们需要思考的关键策略问题
The biofertilizers market is expected to grow from USD 3.60 billion in 2025 to USD 3.93 billion in 2026 and is forecast to reach USD 6.05 billion by 2031 at 9.05% CAGR over 2026-2031.
Strong momentum in sustainable farming, stricter environmental rules, and premium pricing for certified organic produce reinforce demand. North America leads current revenue with a 36.2% biofertilizers market share in 2024, reflecting mature organic certification systems and government cost-share programs. Asia-Pacific sets the pace on the growth front, propelled by national subsidy schemes in India and China and by large areas transitioning from synthetic to biological inputs. Across all regions, carbon-credit monetization, precision application tools, and bundled microbial consortia are widening profit pools for suppliers and growers alike. Consolidation among agricultural-input majors and local specialists further accelerates technology diffusion while reshaping competitive boundaries.
Global Biofertilizers Market Trends and Insights
Consumer Shift Toward Organic Food Drives Premium Market Expansion
Organic food sales reached USD 134 billion in 2024, posting 15.2% year-over-year growth, and certified produce commands 20-40% price premiums . Retailers now require verified biological input records for shelf space, prompting growers to embrace biofertilizers market solutions for compliance. Europe posts the highest per-capita organic consumption, reinforcing steady demand in Germany and the Netherlands. Brand owners outside traditional organic niches are adopting biological inputs to satisfy public sustainability pledges, thereby enlarging addressable hectares. These convergence dynamics elevate revenue visibility for suppliers and strengthen long-term expansion prospects for the biofertilizers market.
Government Subsidies Create Favorable Adoption Economics
The United States Department of Agriculture (USDA) earmarked USD 300 million in 2024 under the Environmental Quality Incentives Program to reimburse up to 75% of qualifying biofertilizer costs . India's Ministry of Chemicals and Fertilizers launched an INR 41 billion (USD 500 million) promotion scheme the same year. The European Union (EU) allocates EUR 8.1 billion (USD 8.7 billion) annually through eco-schemes that reward verified biological inputs . Brazil, under its National Program for Biological Inputs, offers tax holidays on microbial manufacturing equipment. These incentives narrow payback periods for growers and catalyze double-digit growth in the biofertilizers market.
Cold-Chain Infrastructure Limitations Constrain Market Access
Biofertilizers must remain between 2 °C and 8 °C, yet viability drops 15-30% monthly at ambient temperatures. Forty percent of developing nations lack adequate cold storage, raising distribution costs by up to four times. Logistics hurdles weaken retail availability and deter small distributors from stocking live microbial products. Freeze-dry and encapsulation methods extend shelf life to almost two years but raise production costs 35-50%. Until the existing cold-chain infrastructure gaps are effectively addressed, this challenge will continue to impede the growth potential of the biofertilizers market.
Other drivers and restraints analyzed in the detailed report include:
- Environmental Regulations Accelerate Synthetic Input Substitution
- Certified Organic Acreage Expansion Sustains Demand
- Performance Inconsistency Across Agricultural Systems
For complete list of drivers and restraints, kindly check the Table Of Contents.
Segment Analysis
Mycorrhiza products held 35.74% of the biofertilizers market share in 2025. Arbuscular mycorrhizal fungi deliver 20-35% higher phosphorus uptake across corn, soybean, and vegetable plots. Rhizobium formulations lead future expansion at 10.25% CAGR from 2026 to 2031 due to nitrogen fixation that trims synthetic needs by up to 60 kg per hectare. Growing interest in dual-organism blends, validated by the Environmental Protection Agency (EPA) in its rising approvals roster, drives incremental value. Multi-strain research strengthens crop resilience and broadens acreage, reinforcing CAGR forecasts and pulling fresh capital into this slice of the biofertilizers market.
Sustained investment in fermentation technology, coupled with precision carrier materials, is boosting shelf stability and field consistency. Suppliers that integrate agronomy advisory with product supply are earning loyalty among large growers and cooperatives. Granular application data guides next-generation R&D, encouraging custom inoculant packages that match soil profiles. These advances increase average selling prices and deepen the competitive moat around the biofertilizers market size for mycorrhiza and related consortia products.
The Biofertilizers Market Report is Segmented by Form (Azospirillum, Azotobacter, Mycorrhiza, Phosphate Solubilizing Bacteria, Rhizobium, and More), by Crop Type (Cash Crops, Horticultural Crops, and More), and by Geography (Africa, Asia-Pacific, Europe, Middle East, North America, and More). The Market Forecasts are Provided in Terms of Value (USD) and Volume (Metric Tons).
Geography Analysis
North America held a 35.62% share of the biofertilizers market in 2025, with the United States accounting for a significant portion to meet regional demand. Federal incentives, mature cold chains, and robust extension services underpin sustained volume growth. Canada follows with prairie-focused adoption in canola and wheat, while Mexico leverages organic certification for export-oriented horticulture. High research intensity, strong dealer networks, and widespread digital agronomy platforms make North America a launchpad for advanced inoculant technologies within the biofertilizers market.
Asia-Pacific stands out as the fastest-growing territory, advancing at a projected 9.74% CAGR to 2031. India anchors growth through its INR 41 billion subsidy scheme, distributing microbial inputs to 45 million farmers each year. China, representing USD 438.5 million in 2025, pursues a 20% synthetic-fertilizer cut, supported by regional demonstration plots. Japan and Australia invest in high-precision delivery systems, while Vietnam and Indonesia deploy biofertilizers across rice and palm plantations. Upgrades in rural cold storage and state-run extension clinics reduce adoption hurdles, enhancing regional contribution to the global biofertilizers market size.
Europe ranks second by value, buoyed by the European Union (EU) Farm to Fork target and Common Agricultural Policy eco-payments. Germany leads at 23% of regional revenue, followed by France and Italy. Post-Brexit, the United Kingdom channels Environmental Land Management payments into biological input adoption. Eastern European modernization programs are adding demand at double-digit rates. South America, chiefly Brazil and Argentina, leverages large-scale soybean rotations to integrate nitrogen-fixing inoculants, widening the geographic spread of the biofertilizers market.
- Gujarat State Fertilizers & Chemicals Ltd
- IPL Biologicals Limited
- Koppert Biological Systems Inc.
- Novonesis Group
- Rizobacter Argentina S.A. (Bioceres Crop Solutions)
- Symborg Inc. (Corteva Agriscience)
- Andermatt Group AG
- T. Stanes and Company Limited
- Atlantica Agricola
- Biostadt India Limited
- Kiwa Bio-Tech
- Lallemand Inc.
- Certis Biologicals (Mitsui & Co.)
- Indian Farmers Fertiliser Cooperative Limited
- Indogulf Company
- Bionema Ltd
- Binzhou Jingyang Biological Fertilizer Co. Ltd
- Sustane Natural Fertilizer Inc.
Additional Benefits:
- The market estimate (ME) sheet in Excel format
- 3 months of analyst support
TABLE OF CONTENTS
1 INTRODUCTION
- 1.1 Study Assumptions and Market Definition
- 1.2 Scope of the Study
- 1.3 Research Methodology
2 EXECUTIVE SUMMARY AND KEY FINDINGS
3 REPORT OFFERS
4 KEY INDUSTRY TRENDS
- 4.1 Area Under Organic Cultivation
- 4.2 Per Capita Spending On Organic Products
- 4.3 Regulatory Framework
- 4.3.1 Argentina
- 4.3.2 Australia
- 4.3.3 Brazil
- 4.3.4 Canada
- 4.3.5 China
- 4.3.6 Egypt
- 4.3.7 France
- 4.3.8 Germany
- 4.3.9 India
- 4.3.10 Indonesia
- 4.3.11 Iran
- 4.3.12 Italy
- 4.3.13 Japan
- 4.3.14 Mexico
- 4.3.15 Netherlands
- 4.3.16 Nigeria
- 4.3.17 Philippines
- 4.3.18 Russia
- 4.3.19 South Africa
- 4.3.20 Spain
- 4.3.21 Thailand
- 4.3.22 Turkey
- 4.3.23 United Kingdom
- 4.3.24 United States
- 4.3.25 Vietnam
- 4.4 Value Chain and Distribution Channel Analysis
- 4.5 Market Drivers
- 4.5.1 Consumer Shift Toward Organic Food Drives Premium Market Expansion
- 4.5.2 Government Subsidies Create Favorable Adoption Economics
- 4.5.3 Environmental Regulations Accelerate Synthetic Input Substitution
- 4.5.4 Certified Organic Acreage Expansion Sustains Demand
- 4.5.5 Carbon-Credit Monetization for Biofertilizer Use
- 4.5.6 Adoption of Microbial Consortia for Drought/Salinity Tolerance
- 4.6 Market Restraints
- 4.6.1 Cold-Chain Infrastructure Limitations Constrain Market Access
- 4.6.2 Performance Inconsistency Across Agricultural Systems
- 4.6.3 Rising Competition from Biostimulants and Nano-fertilizers
- 4.6.4 Patentability Hurdles for Novel Microbial Strains
5 MARKET SIZE AND GROWTH FORECASTS (VALUE AND VOLUME)
- 5.1 Form
- 5.1.1 Azospirillum
- 5.1.2 Azotobacter
- 5.1.3 Mycorrhiza
- 5.1.4 Phosphate Solubilizing Bacteria
- 5.1.5 Rhizobium
- 5.1.6 Other Biofertilizers
- 5.2 Crop Type
- 5.2.1 Cash Crops
- 5.2.2 Horticultural Crops
- 5.2.3 Row Crops
- 5.3 Geography
- 5.3.1 Africa
- 5.3.1.1 By Country
- 5.3.1.1.1 Egypt
- 5.3.1.1.2 Nigeria
- 5.3.1.1.3 South Africa
- 5.3.1.1.4 Rest of Africa
- 5.3.1.1 By Country
- 5.3.2 Asia-Pacific
- 5.3.2.1 By Country
- 5.3.2.1.1 Australia
- 5.3.2.1.2 China
- 5.3.2.1.3 India
- 5.3.2.1.4 Indonesia
- 5.3.2.1.5 Japan
- 5.3.2.1.6 Philippines
- 5.3.2.1.7 Thailand
- 5.3.2.1.8 Vietnam
- 5.3.2.1.9 Rest of Asia-Pacific
- 5.3.2.1 By Country
- 5.3.3 Europe
- 5.3.3.1 By Country
- 5.3.3.1.1 France
- 5.3.3.1.2 Germany
- 5.3.3.1.3 Italy
- 5.3.3.1.4 Netherlands
- 5.3.3.1.5 Russia
- 5.3.3.1.6 Spain
- 5.3.3.1.7 Turkey
- 5.3.3.1.8 United Kingdom
- 5.3.3.1.9 Rest of Europe
- 5.3.3.1 By Country
- 5.3.4 Middle East
- 5.3.4.1 By Country
- 5.3.4.1.1 Iran
- 5.3.4.1.2 Saudi Arabia
- 5.3.4.1.3 Rest of Middle East
- 5.3.4.1 By Country
- 5.3.5 North America
- 5.3.5.1 By Country
- 5.3.5.1.1 Canada
- 5.3.5.1.2 Mexico
- 5.3.5.1.3 United States
- 5.3.5.1.4 Rest of North America
- 5.3.5.1 By Country
- 5.3.6 South America
- 5.3.6.1 By Country
- 5.3.6.1.1 Argentina
- 5.3.6.1.2 Brazil
- 5.3.6.1.3 Rest of South America
- 5.3.6.1 By Country
- 5.3.1 Africa
6 COMPETITIVE LANDSCAPE
- 6.1 Key Strategic Moves
- 6.2 Market Share Analysis
- 6.3 Company Landscape
- 6.4 Company Profiles (Includes Global Level Overview, Market Level Overview, Core Segments, Financials as Available, Strategic Information, Market Rank/Share for Key Companies, Products and Services, and Recent Developments)
- 6.4.1 Gujarat State Fertilizers & Chemicals Ltd
- 6.4.2 IPL Biologicals Limited
- 6.4.3 Koppert Biological Systems Inc.
- 6.4.4 Novonesis Group
- 6.4.5 Rizobacter Argentina S.A. (Bioceres Crop Solutions)
- 6.4.6 Symborg Inc. (Corteva Agriscience)
- 6.4.7 Andermatt Group AG
- 6.4.8 T. Stanes and Company Limited
- 6.4.9 Atlantica Agricola
- 6.4.10 Biostadt India Limited
- 6.4.11 Kiwa Bio-Tech
- 6.4.12 Lallemand Inc.
- 6.4.13 Certis Biologicals (Mitsui & Co.)
- 6.4.14 Indian Farmers Fertiliser Cooperative Limited
- 6.4.15 Indogulf Company
- 6.4.16 Bionema Ltd
- 6.4.17 Binzhou Jingyang Biological Fertilizer Co. Ltd
- 6.4.18 Sustane Natural Fertilizer Inc.
7 KEY STRATEGIC QUESTIONS FOR AGRICULTURAL BIOLOGICALS CEOS
 基于固氮菌的生物肥料市场:2026-2032年全球市场预测(按产品类型、作物类型、配方类型、应用方法、分销管道和最终用户划分)生物肥料市场:按类型、形态、作物类型、应用方法和分销管道划分-2026-2032年全球市场预测
 2026年全球生物肥料市场报告
 2034年生物肥料接种剂市场预测-按产品类型、微生物类型、配方类型、应用方法、作物类型、通路和地区分類的全球分析
 生物肥料市场规模、份额、趋势和预测:按类型、作物、微生物、应用方法和地区划分,2026-2034年
 生物有机肥料:市场占有率分析、产业趋势与统计、成长预测(2026-2031)
 生物肥料市场规模、份额、成长及全球产业分析:按类型和应用划分,区域洞察及2026-2034年预测全球生物肥料市场规模、份额、趋势和成长分析报告(2026-2034年)2026年全球根瘤菌肥料市场报告根瘤菌接种剂市场按作物类型、形态、应用方法、最终用途和销售管道划分-2026-2032年全球预测