


 |
市场调查报告书
商品编码
1939146
锡:市场占有率分析、产业趋势和统计数据、成长预测(2026-2031)Tin - Market Share Analysis, Industry Trends & Statistics, Growth Forecasts (2026 - 2031) |
||||||
※ 本网页内容可能与最新版本有所差异。详细情况请与我们联繫。
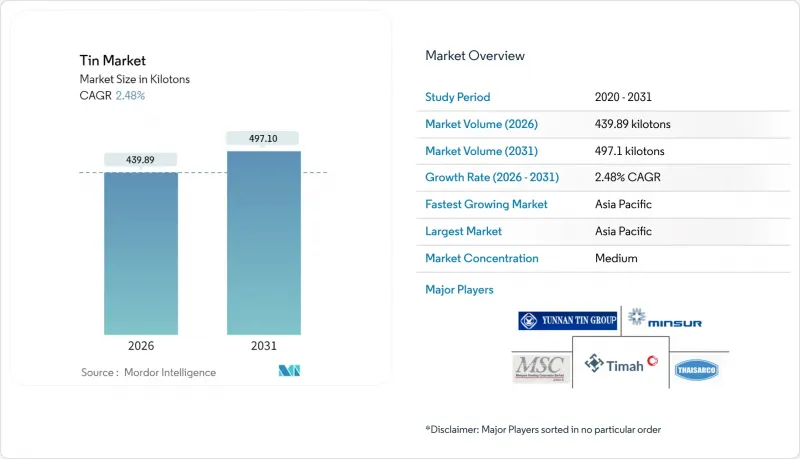
预计到 2026 年,锡市场规模将达到 439.89 千吨,高于 2025 年的 429.24 千吨。
预计到 2031 年产量将达到 497.1 千吨,2026 年至 2031 年的复合年增长率为 2.48%。
缅甸政治动盪导致的供应限制以及刚果民主共和国的供应风险,支撑了金属价格的稳定,儘管其销售成长较为温和。金属的特殊性在于其依赖铜、铅和锌矿开采,这使得金属价格的波动性比原生金属高出约50%,迫使製造商实现供应来源多元化。亚太地区位置中国电子产业和印尼冶炼厂,吸收了全球约70%的需求,并展现出该地区领先的成长速度。同时,北美和欧洲的买家正在加快在地采购和回收,以降低供应中断的风险。
全球锡市场趋势及展望
电子设备焊料需求不断成长
电子焊料是锡的最大应用领域,在向无铅合金转型以符合RoHS指令的背景下,预计2024年将占锡总消耗量的48.56%。 5G无线通讯基础设施的广泛应用和小型化半导体封装的普及推动了单位锡用量的成长。这是因为先进的焊料合金需要95-99%的锡纯度,而非传统的60-63%的混合锡。高温汽车模组中银烧结製程的兴起将限制电力电子领域焊料需求的成长,而消费性电子元件仍然高度依赖锡。用于锗锡外延的氯化亚锡化学气相沉积前驱体代表了一个利润丰厚的利基市场,可能会影响电子级锡的价格。北美和欧洲的本地化项目正在推动对国内焊料生产的投资,这不仅降低了对亚洲供应商的依赖,也为锡市场提供了额外的供应量。
电动车电源和温度控管组件的广泛应用
电动汽车电力电子装置(逆变器和电池组需要导热合金)正在加速汽车产业对锡的需求。采用碳化硅晶片的模组会提高焊点温度,因此更倾向于使用能够承受严苛热循环的铜锡金属间化合物键。瞬态液相键结所需的材料等级与传统焊料不同,促使合金开发商持续提高纯度和润湿性能。美国能源局提出的2025年实现100千瓦/公升功率密度的目标,推动了人们对高锡解决方案的兴趣,这些解决方案旨在最大限度地减少面积并控制发热量。严格的原始设备製造商(OEM)认证流程推高了价格,而锡金属化和银烧结之间的竞争平衡将决定高性能电动车领域在全球锡市场中的长期渗透率。
铝/锌/无铅焊料替代品的供应状况
在结温高于 175°C 的汽车功率模组中,银烧结和铝线焊线正日益取代锡基合金。在高可靠性应用中,铜直接接合和压接接触系统进一步降低了每个装置的锡用量。然而,由于资本成本、製程复杂性和较长的汽车认证週期(这些因素更有利于传统的含锡焊料),这些技术的普及仍然受到限制。在家用电子电器,锡在成本绩效方面与更昂贵的银基系统保持最佳平衡,因此仍占据锡市场的大部分需求。长期的竞争压力将取决于能够缩小成本差距并提高替代金属化方法产能的製程创新。
细分市场分析
到2025年,合金将占锡市场59.68%的份额,其精确的成分控制使其在焊料、轴承和特殊金属等领域得到广泛应用。合金市场具有规模经济优势,冶炼厂无需大量资本投入即可客製化锡铅、锡银和锡铜等合金,即使在矿石市场波动的情况下也能维持利润率。纯金属锡的纯度高达99.95%,适用于半导体、电池和太阳能等应用。预计到2031年,纯金属锡的复合年增长率将达到3.05%,从而进一步扩大其在整体锡市场规模中的比例。
像Aurobis这样的生产商正在利用多金属回收工艺,将精炼锡的产能扩大到每年1万吨以上,从阳极污泥和复合废料中回收金属,同时获得了ISO 9001和ISO 14001认证。这些一体化流程使供应来源多元化,减少了范围3的排放,并吸引了追求净零排放价值链的汽车製造商的需求。
本锡市场报告按产品类型(金属、合金、化合物)、应用领域(焊料、镀锡、化学品、铅酸电池及其他应用)、终端用户行业(汽车、电子、包装、玻璃及其他终端用户行业)和地区(亚太、北美、欧洲、南美、中东和非洲)对市场进行分析。市场预测以吨为单位。
区域分析
到2025年,亚太地区将占全球锡消费量的68.85%,主要驱动力来自中国的电子製造业和印尼的采矿能力。受中国政府对电动车生产的支持以及东协地区电池供应链的建立,亚太地区锡市场规模正以3.12%的复合年增长率成长。在中国,昆山省和广西壮族自治区的环境法规以及矿床资源的枯竭,促使冶炼厂进口高等级矿石;而印尼的PT Timah公司则因腐败调查而暂时限制了锡的出口。
由于供应链安全措施促进了国内回收利用,北美锡市场正在改变。奥罗维斯公司投资8亿美元在乔治亚里士满兴建了一座综合金属加工厂,确保了每年18万吨的复杂废料处理能力,从而为美国主要的汽车和航太製造商提供稳定的供应。
欧洲的锡消费格局日趋成熟,并以永续性发展为重点。德国在电动车电力电子领域主导锡的应用,而奥罗比斯位于汉堡的工厂则透过先进的污泥处理装置加强了其高纯度供应,该装置可将阳极泥提炼成锡和特殊金属。
中东和非洲地区目前的锡消费规模仍然小规模,但基础设施的扩张和新兴的汽车组装业预计将逐步提升锡的需求。儘管刚果民主共和国拥有丰富的资源潜力,但该国的政治风险抑制了上游投资,使其成为全球锡市场供应稳定性的关键变数。
其他福利:
- Excel格式的市场预测(ME)表
- 3个月的分析师支持
目录
第一章 引言
- 调查先决条件
- 调查范围
第二章调查方法
第三章执行摘要
第四章 市场情势
- 市场概览
- 市场驱动因素
- 电子领域对焊料的需求不断增长
- 电动车动力和温度控管组件的广泛应用
- 扩大食品和饮料罐的镀锡应用
- 无铅锡基钙钛矿太阳能电池的技术突破
- 用于固态电池的富锡复合负极材料
- 市场限制
- 铝/锌/无铅焊料替代品的供应情况
- 由于小规模采矿和衝突地区的供应,价格波动较大
- 缅甸和刚果民主共和国(刚果(金))供应链中不断上升的ESG合规成本
- 价值链分析
- 波特五力模型
- 新进入者的威胁
- 买方的议价能力
- 供应商的议价能力
- 替代品的威胁
- 竞争程度
- 定价分析
第五章 市场规模与成长预测
- 依产品类型
- 金属
- 合金
- 化合物
- 透过使用
- 焊接
- 镀锡
- 化学品
- 铅酸电池
- 其他用途(特殊合金)
- 按最终用户行业划分
- 车
- 电子设备
- 包装(食品/饮料)
- 玻璃
- 其他终端用户产业(化学、工具製造、医疗设备)
- 按地区
- 生产分析
- 澳洲
- 玻利维亚
- 巴西
- 缅甸
- 中国
- 刚果(金沙萨)
- 印尼
- 马来西亚
- 秘鲁
- 越南
- 其他国家
- 消费分析
- 亚太地区
- 中国
- 印度
- 日本
- 韩国
- 亚太其他地区
- 北美洲
- 我们
- 加拿大
- 墨西哥
- 欧洲
- 德国
- 英国
- 法国
- 义大利
- 奥地利
- 其他欧洲地区
- 南美洲
- 巴西
- 阿根廷
- 其他南美洲
- 中东和非洲
- 沙乌地阿拉伯
- 南非
- 其他中东和非洲地区
- 亚太地区
- 生产分析
第六章 竞争情势
- 市场集中度
- 策略趋势
- 市占率(%)/排名分析
- 公司简介
- Andrada Mining
- ArcelorMittal
- Aurubis Beerse nv
- Avalon Advanced Materials Inc.
- Huaxi Nonferrous Metals
- Indium Corporation
- Jiangxi New Nanshan Technology Co. Ltd
- Malaysia Smelting Corporation Berhad
- Minsur
- Thailand Smelting & Refining Co. Ltd(Thaisarco)
- Timah
- YUNNAN TIN COMPANY GROUP LIMITED
第七章 市场机会与未来展望
Tin Market size in 2026 is estimated at 439.89 kilotons, growing from 2025 value of 429.24 kilotons with 2031 projections showing 497.1 kilotons, growing at 2.48% CAGR over 2026-2031.
Structural tightness caused by Myanmar's political instability and supply risks in the Democratic Republic of Congo underpins price stability despite modest volume growth. The metal's by-product nature-where production depends on copper, lead, and zinc mining-magnifies price swings by nearly 50% versus primary metals and forces manufacturers to secure diverse sources. Asia-Pacific, home to China's electronics complex and Indonesia's smelters, absorbs close to seven-tenths of global demand and posts region-leading growth, while North American and European buyers accelerate local sourcing and recycling initiatives to cut exposure to supply disruptions.
Global Tin Market Trends and Insights
Growing Demand for Solder in Electronics
Electronics solder remained the largest application, accounting for 48.56% of 2024 consumption as manufacturers transitioned to lead-free alloys to meet RoHS mandates. Fifth-generation wireless infrastructure and smaller semiconductor packages drive higher tin loading per unit because advanced solder alloys require 95-99% purity rather than legacy 60-63% blends. The migration to silver sintering in high-temperature automotive modules limits solder growth in power electronics, yet leaves consumer devices largely dependent on tin. Stannic chloride chemical vapor deposition precursors for GeSn epitaxy create a niche, high-margin outlet that can influence electronic-grade tin prices. Localization programs in North America and Europe fuel investment in domestic solder production, tempering dependence on Asian suppliers while adding incremental tonnage to the tin market.
Rising Adoption in EV Power and Thermal-Management Components
Automotive demand for tin market volumes accelerates as electric-vehicle power electronics need thermally conductive alloys for inverters and battery packs. Modules using silicon carbide chips push junction temperatures higher, favoring copper-tin intermetallic bonding that withstands extreme thermal cycling. Transient liquid-phase joining consumes different feedstock grades than conventional solder, prompting alloy developers to refine purity levels and wetting characteristics. Department of Energy density targets of 100 kW/L by 2025 intensify interest in tin-rich solutions that manage heat while minimizing footprint. Premium pricing arises from stringent OEM qualification cycles, and the competitive balance between tin metallization and silver sintering will shape long-term penetration in high-performance EV segments across the global tin market.
Availability of Aluminium/ Zinc/Lead-Free Solder Substitutes
Silver sintering and aluminum wire bonding increasingly displace tin-based alloys in automotive power modules that operate above 175 °C junction temperatures. Copper direct bonding and pressure-contact systems further reduce tin per device in high-reliability applications. Uptake, however, remains limited by capital cost, process complexity and lengthy automotive qualification cycles that favor legacy tin-rich solders. In consumer electronics, tin maintains a cost-performance sweet spot against pricier silver systems, preserving a large portion of tin market demand. Long-term competitive pressure will depend on process innovation that narrows cost gaps and enhances throughput for alternative metallization methods.
Other drivers and restraints analyzed in the detailed report include:
- Expanding Use in Tin-Plating for Food and Beverage Cans
- Break-throughs in Lead-Free Tin-Based Perovskite Solar Cells
- Price Volatility from Artisanal and Conflict-Area Supply
For complete list of drivers and restraints, kindly check the Table Of Contents.
Segment Analysis
Alloys held 59.68% tin market share in 2025 as precise composition control underpinned widespread solder, bearing, and specialty-metal formulations. The alloy segment benefits from economies of scope because smelters can tailor tin-lead, tin-silver, and tin-copper blends without major capital outlays, sustaining margins even during volatile ore markets. The pure metal category recorded 99.95% purity output that caters to semiconductor, battery, and photovoltaic uses and is set to register a 3.05% CAGR through 2031, lifting its contribution to the overall tin market size.
Producers such as Aurubis leverage multimetal recycling streams to exceed 10,000 metric-ton annual refined tin capacity, recovering metal from anode sludge and complex scrap while meeting ISO 9001 and ISO 14001 certifications. Such integrated flows diversify supply, reduce Scope 3 emissions, and appeal to automakers that pursue net-zero value chains.
The Tin Report is Segmented by Product Type (Metal, Alloy, and Compounds), Application (Solder, Tin Plating, Chemicals, Lead-Acid Batteries, and Other Applications), End-User Industry (Automotive, Electronics, Packaging, Glass, and Other End-User Industries), and Geography (Asia-Pacific, North America, Europe, South America, and Middle-East and Africa). The Market Forecasts are Provided in Terms of Volume (Tons).
Geography Analysis
Asia-Pacific dominated with 68.85% consumption in 2025, driven by China's electronics manufacturing and Indonesia's mining capacity. Regional tin market size growth at 3.12% CAGR leverages government incentives for electric-vehicle production in China and battery supply-chain build-out across the ASEAN bloc. Chinese concentrate output faced environmental curbs and resource depletion at Yunnan and Guangxi deposits, prompting smelters to import higher-grade ore, while Indonesia's PT Timah battled corruption probes that temporarily restricted exports.
North America's tin market advances on supply-chain security initiatives that reward domestic recycling. Aurubis invested USD 800 million in its Richmond, Georgia multimetal plant capable of processing 180,000 tons of complex scrap annually, ensuring a reliable supply for U.S. automotive and aerospace primes.
Europe shows mature yet sustainability-focused tin consumption. Germany leads uptake in EV power electronics, and Aurubis's Hamburg complex boosts high-purity supply through its Advanced Sludge Processing unit that refines anode mud into tin and specialty metals.
The Middle-East and Africa remains a minor consumer, although infrastructure expansion and nascent automotive assembly may lift demand incrementally. Political risks in the Democratic Republic of Congo restrain upstream investment despite sizable resource potential, keeping the region a swing factor in global tin market supply stability.
- Andrada Mining
- ArcelorMittal
- Aurubis Beerse nv
- Avalon Advanced Materials Inc.
- Huaxi Nonferrous Metals
- Indium Corporation
- Jiangxi New Nanshan Technology Co. Ltd
- Malaysia Smelting Corporation Berhad
- Minsur
- Thailand Smelting & Refining Co. Ltd (Thaisarco)
- Timah
- YUNNAN TIN COMPANY GROUP LIMITED
Additional Benefits:
- The market estimate (ME) sheet in Excel format
- 3 months of analyst support
TABLE OF CONTENTS
1 Introduction
- 1.1 Study Assumptions
- 1.2 Scope of the Study
2 Research Methodology
3 Executive Summary
4 Market Landscape
- 4.1 Market Overview
- 4.2 Market Drivers
- 4.2.1 Growing demand for solder in electronics
- 4.2.2 Rising adoption in EV power and thermal-management components
- 4.2.3 Expanding use in tin-plating for food and beverage cans
- 4.2.4 Break-throughs in lead-free tin-based perovskite solar cells
- 4.2.5 Tin-rich composite anodes for solid-state batteries
- 4.3 Market Restraints
- 4.3.1 Availability of aluminium/zinc/lead-free solder substitutes
- 4.3.2 Price volatility from artisanal and conflict-area supply
- 4.3.3 Rising ESG-compliance cost in Myanmar and DRC supply chains
- 4.4 Value Chain Analysis
- 4.5 Porter's Five Forces
- 4.5.1 Threat of New Entrants
- 4.5.2 Bargaining Power of Buyers
- 4.5.3 Bargaining Power of Suppliers
- 4.5.4 Threat of Substitutes
- 4.5.5 Degree of Competition
- 4.6 Price Analysis
5 Market Size and Growth Forecasts (Volume)
- 5.1 By Product Type
- 5.1.1 Metal
- 5.1.2 Alloy
- 5.1.3 Compounds
- 5.2 By Application
- 5.2.1 Solder
- 5.2.2 Tin Plating
- 5.2.3 Chemicals
- 5.2.4 Lead-acid Batteries
- 5.2.5 Other Applications (Specialized Alloys)
- 5.3 By End-user Industry
- 5.3.1 Automotive
- 5.3.2 Electronics
- 5.3.3 Packaging (Food and Beverage)
- 5.3.4 Glass
- 5.3.5 Other End-user Industries (Chemical, Tool Making, Medical Devices)
- 5.4 By Geography
- 5.4.1 Production Analysis
- 5.4.1.1 Australia
- 5.4.1.2 Bolivia
- 5.4.1.3 Brazil
- 5.4.1.4 Burma
- 5.4.1.5 China
- 5.4.1.6 Congo (Kinshasa)
- 5.4.1.7 Indonesia
- 5.4.1.8 Malaysia
- 5.4.1.9 Peru
- 5.4.1.10 Vietnam
- 5.4.1.11 Other Countries
- 5.4.2 Consumption Analysis
- 5.4.2.1 Asia-Pacific
- 5.4.2.1.1 China
- 5.4.2.1.2 India
- 5.4.2.1.3 Japan
- 5.4.2.1.4 South Korea
- 5.4.2.1.5 Rest of Asia-Pacific
- 5.4.2.2 North America
- 5.4.2.2.1 United States
- 5.4.2.2.2 Canada
- 5.4.2.2.3 Mexico
- 5.4.2.3 Europe
- 5.4.2.3.1 Germany
- 5.4.2.3.2 United Kingdom
- 5.4.2.3.3 France
- 5.4.2.3.4 Italy
- 5.4.2.3.5 Austria
- 5.4.2.3.6 Rest of Europe
- 5.4.2.4 South America
- 5.4.2.4.1 Brazil
- 5.4.2.4.2 Argentina
- 5.4.2.4.3 Rest of South America
- 5.4.2.5 Middle-East and Africa
- 5.4.2.5.1 Saudi Arabia
- 5.4.2.5.2 South Africa
- 5.4.2.5.3 Rest of Middle East and Africa
- 5.4.2.1 Asia-Pacific
- 5.4.1 Production Analysis
6 Competitive Landscape
- 6.1 Market Concentration
- 6.2 Strategic Moves
- 6.3 Market Share (%)/Ranking Analysis
- 6.4 Company Profiles (includes Global level Overview, Market level overview, Core Segments, Financials as available, Strategic Information, Market Rank/Share for key companies, Products and Services, and Recent Developments)
- 6.4.1 Andrada Mining
- 6.4.2 ArcelorMittal
- 6.4.3 Aurubis Beerse nv
- 6.4.4 Avalon Advanced Materials Inc.
- 6.4.5 Huaxi Nonferrous Metals
- 6.4.6 Indium Corporation
- 6.4.7 Jiangxi New Nanshan Technology Co. Ltd
- 6.4.8 Malaysia Smelting Corporation Berhad
- 6.4.9 Minsur
- 6.4.10 Thailand Smelting & Refining Co. Ltd (Thaisarco)
- 6.4.11 Timah
- 6.4.12 YUNNAN TIN COMPANY GROUP LIMITED
7 Market Opportunities and Future Outlook
- 7.1 White-space and Unmet-Need Assessment
 二月桂酸二丁基锡市场:依形态、化学反应类型、等级、应用、终端用户产业及通路划分-2026-2032年全球市场预测
 日本锡市场规模、份额、趋势及预测(依产品类型、应用、最终用途产业及地区划分),2026-2034年锡市场规模、份额、趋势及预测(依产品类型、应用、最终用途产业及地区划分),2026-2034年电子锡焊料市场按类型、形式、最终用户和应用划分,全球预测(2026-2032年)
 锡市场规模、份额和成长分析(按产品类型、应用、最终用途产业、分销管道和地区划分)-2026-2033年产业预测
 全球锡市场(至 2035 年):依产品类型、应用类型、最终用户、分销管道、地区、行业趋势和预测
 全球锡市场(2025-2029)
 三丁基氟化锡市场机会、成长动力、产业趋势分析及 2025 - 2034 年预测
 全球锡市场规模(按应用、地区、范围和预测)