


 |
市场调查报告书
商品编码
1939628
界面活性剂:市场占有率分析、产业趋势与统计、成长预测(2026-2031)Surfactants - Market Share Analysis, Industry Trends & Statistics, Growth Forecasts (2026 - 2031) |
||||||
※ 本网页内容可能与最新版本有所差异。详细情况请与我们联繫。
预计到 2026 年,界面活性剂市场规模将达到 1,948 万吨,并预计从 2025 年的 1,886 万吨成长。
预计到 2031 年将达到 2,293 万吨,2026 年至 2031 年的复合年增长率为 3.31%。
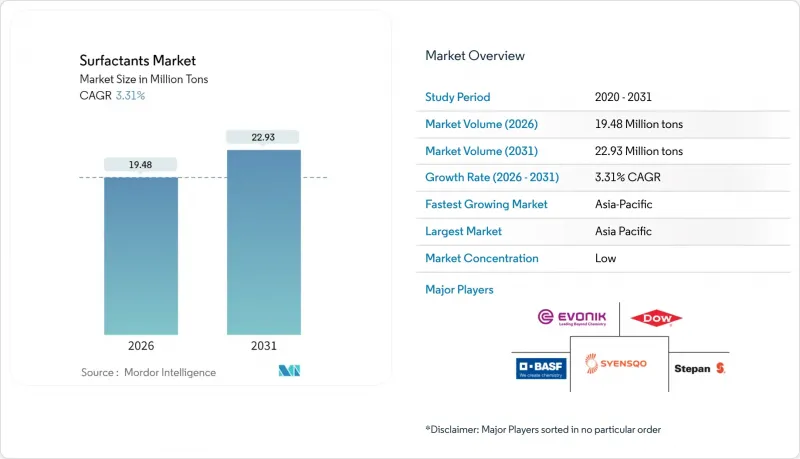
高端个人保健产品中多功能温和界面活性剂的采用、节能型冷水清洁剂的普及,以及为满足日益严格的永续性法规而使用生物基成分,正在重塑市场竞争格局。同时,由于中国产能週期性过剩和长链醇类供应波动,价格持续波动,使得成本控製成为生产商的首要任务。综合企业正利用其全球供应链和深厚的研发实力来捍卫市场份额,但亚太地区特种生物表面活性剂供应商和灵活的区域性企业正在逐步削弱它们的传统优势。
全球表面活性剂市场趋势与洞察
无水个人保健产品对多功能温和界面活性剂的需求日益增长
随着品牌越来越重视肌肤温和性和环保性,配方师们正逐渐抛弃传统的硫酸盐,转而使用葡糖酰胺和羟乙基磺酸盐。这些成分在浓缩型固态条、洁肤棒和洗衣粉中具有温和的清洁和调理功效。科莱恩的研究表明,这些分子能够减少冲洗用水量和能源消耗,同时保持消费者所重视的丰富泡沫。北美和欧洲的消费者愿意为这些配方支付更高的价格,这促使BASF扩大了其EcoBalanced甜菜碱产品线。与石油基替代品相比,该产品可将碳足迹降低高达30%。成分的快速改进和以水资源管理为重点的精准行销,正为界面活性剂市场奠定基础。随着亚洲消费者开始接受固态清洁剂,预计市场将持续成长。
C6-C12脂肪酸供应过剩推动了向生物基原料的转变
印尼的B35生质柴油强制令及类似计画创造了充足的中链脂肪酸供应,这些脂肪酸与石脑油基脂肪酸具有竞争力,从而提高了可再生界面活性剂生产路线的经济效益。欧洲製造商正在透过生物质平衡策略,在不进行资产重组的情况下,以可再生原料取代化石碳。同时,赢创在斯洛伐克新建的鼠李醣脂工厂正在展示利用欧洲玉米糖的可扩展发酵技术。欧盟森林砍伐法规和范围3碳计量等政策驱动因素,正在揭示继续使用化石原料的成本,促使合成界面活性剂生产商根据其品牌永续性承诺,转向混合原料组合。
严格的 PFAS 淘汰计画会加速产品配方调整成本
欧盟和美国的监管机构正迅速采取行动,限制全氟和多氟烷基物质(PFAS)的使用,这将直接影响约38%的现有界面活性剂终端应用。 DIC公司已将一种不含PFAS的电动车润滑油消泡剂商业化,其性能与PFAS消泡剂相当,但所需的研发投入推高了多个下游市场的单价。配方调整週期迫使企业引入新的稳定剂和加工工艺,这加剧了中小企业的技术资源压力,并加速了产业整合。即使价格溢价持续存在,那些能够及早响应并获得合规认证的供应商仍将获得优先供应商地位,这对錶面活性剂市场产生了影响。
细分市场分析
到2025年,阴离子活性剂将维持47.80%的市场份额,这主要得益于直链烷基苯磺酸盐(LAS)的成本效益和在家用清洁剂领域的广泛应用。 LAS的产量将超过400万吨,受益于规模经济和成熟的供应链。然而,两性分子,例如甜菜碱和氨基氧化物,预计将以4.30%的复合年增长率(CAGR)在所有表面活性剂类型中占据主导地位,这主要得益于它们在pH范围内温和的性质以及在高端个人保健产品中稳定复杂配方的能力。目前,界面活性剂市场的主要企业正在推广获得生态认证的甜菜碱,这些产品既符合零售商的清洁美容标准,又能确保高利润率。
阳离子部分虽然尺寸很小,但在织物柔软剂和抗菌季铵盐混合物中却至关重要;而硅酮界面活性剂由于其比碳基类似物具有更优异的延展性,已在纺织加工、提高石油采收率和高延伸率聚氨酯泡棉领域开闢了利基市场。
界面活性剂报告按类型(阴离子界面活性剂、阳离子界面活性剂等)、来源(合成界面活性剂、生物基界面活性剂等)、应用(家用肥皂和清洁剂、个人护理用品、润滑油和燃料添加剂、工业和机构清洁剂等)以及地区(亚太地区、北美地区、欧洲地区等)进行细分。市场预测以公吨为单位。
区域分析
到2025年,亚太地区将占全球表面活性剂市场总额的48.40%,预计到2031年将以4.24%的复合年增长率增长,这主要得益于中国强大的製造业基础、印度中产阶级的壮大以及东南亚的快速都市化。光是中国就供应了全球一半以上的十二烷基硫酸钠(LAS)产量,并透过极具竞争力的价格策略,支撑着国内清洁剂市场和海外出口。
欧盟的无毁林采购规则和即将出台的环境声明指令迫使品牌所有者检验成分的可追溯性,从而推动了由企业永续发展预算资金筹措的生物表面活性剂试点计画。在美国,产品性能日益受到重视,尤其是在浓缩型液体清洁剂和可减少包装废弃物的多用途擦拭巾。儘管这两个地区都面临 PFAS 替代成本的压力,但它们也拥有能够快速开发合规替代品的研究中心,这巩固了它们作为表面活性剂市场下一代化学物质跳板的地位,而这些化学物质随后可以推广到新兴市场。
阿布达比和阿曼的界面活性剂聚合物喷洒宣传活动正在为适用于高温高盐环境的混合物开闢高附加价值市场。同时,奈及利亚和肯亚的都市化加快,带动了包装清洁剂消费量的成长。巴西正利用大豆和甘蔗生物生质燃料衍生的丰富脂肪酸产品,促进可再生界面活性剂的反向整合,进而降低外汇波动带来的成本风险。儘管基础设施不足、物流成本高昂以及经济週期波动等挑战依然存在,但与当地契约製造和经销商合作的製造商正在降低风险,并扩大其在表面活性剂市场的份额。
其他福利:
- Excel格式的市场预测(ME)表
- 3个月的分析师支持
目录
第一章 引言
- 研究假设和市场定义
- 调查范围
第二章调查方法
第三章执行摘要
第四章 市场情势
- 市场概览
- 市场驱动因素
- 无水个人保健产品对多功能温和界面活性剂的需求日益增长
- 低温洗衣清洁剂需求的成长带动了对高性能阴离子活性剂的需求。
- C6-C12脂肪酸过剩促进了向生物基原料的转型
- 中东、非洲和中国的提高石油采收率(EOR)计划数量增加
- 在合约配药厂现场进行槐醣脂发酵
- 市场限制
- 严格的 PFAS 淘汰计画会加速产品配方调整成本
- 生质柴油政策变化导致长链醇价格波动
- 中国产能扩张引发週期性价格战
- 价值链分析
- 波特五力模型
- 供应商的议价能力
- 买方的议价能力
- 新进入者的威胁
- 替代品的威胁
- 竞争程度
- 定价分析
第五章 市场规模与成长预测
- 按类型
- 阴离子活性剂
- 直链烷基苯磺酸盐(LAS 或 LABS)
- 醇醚硫酸酯(AES)
- α-烯烃磺酸盐(AOS)
- 仲磺酸盐(SAS)
- 甲酯磺酸盐(MES)
- 磺基琥珀酸酯
- 其他(磺酸盐等)
- 阳离子界面活性剂
- 季铵化合物
- 其他的
- 非离子界面活性剂
- 醇乙氧基化物
- 乙氧基化烷基酚
- 脂肪酸酯
- 其他的
- 两性界面活性剂
- 硅油界面活性剂
- 阴离子活性剂
- 按原产地
- 合成界面活性剂
- 生物基界面活性剂
- 透过使用
- 家用肥皂和清洁剂
- 个人护理
- 润滑油和燃油添加剂
- 工业和机构清洁
- 食品加工
- 油田化学品
- 农业化学品
- 纺织加工
- 乳化
- 其他用途
- 按地区
- 亚太地区
- 中国
- 印度
- 日本
- 韩国
- ASEAN
- 亚太其他地区
- 北美洲
- 我们
- 加拿大
- 墨西哥
- 欧洲
- 德国
- 英国
- 法国
- 义大利
- 俄罗斯
- 其他欧洲地区
- 南美洲
- 巴西
- 阿根廷
- 其他南美洲
- 中东和非洲
- 沙乌地阿拉伯
- 南非
- 其他中东和非洲地区
- 亚太地区
第六章 竞争情势
- 市场集中度
- 策略趋势
- 市占率(%)/排名分析
- 公司简介
- 3M
- Arkema
- Ashland
- BASF
- Bayer AG
- CEPSA
- Clariant
- Croda International Plc
- Dow
- Emery Oleochemicals
- Evonik Industries AG
- Galaxy Surfactants
- GEO
- Godrej Industries Limited
- Indorama Ventures Public Limited
- Innospec
- Kao Corporation
- KLK OLEO
- Lankem
- Lonza
- Nouryon
- P&G Chemicals
- Reliance Industries Limited
- SANYO CHEMICAL INDUSTRIES, LTD.
- Sasol Limited Group
- Sinopec(China Petrochemical Corporation)
- Syensqo
- Stepan Company
- Sulfatrade SA
- Sumitomo Chemical Co., Ltd.
- Taiwan NJC Corporation
- TENSAC
- YPF
第七章 市场机会与未来展望
Surfactants market size in 2026 is estimated at 19.48 Million tons, growing from 2025 value of 18.86 Million tons with 2031 projections showing 22.93 Million tons, growing at 3.31% CAGR over 2026-2031.
Adoption of multifunctional mild surfactants in premium personal-care formats, cold-water laundry detergents that cut energy use, and bio-based feedstocks that satisfy tightening sustainability rules are setting the competitive agenda. Meanwhile, persistent price volatility tied to China's periodic overcapacity cycles and long-chain alcohol supply swings keeps cost discipline front-of-mind for producers. Integrated players leverage global supply chains and research and development depth to defend share, but specialty biosurfactant suppliers and agile regional firms in Asia-Pacific are steadily eroding historical advantages.
Global Surfactants Market Trends and Insights
Growing Demand for Multifunctional Mild Surfactants in Water-less Personal-Care Formats
Brands are prioritizing skin compatibility and environmental credentials, prompting formulators to shift from traditional sulfate systems to glucamides and isethionates that deliver gentle cleansing and conditioning in concentrated bars, sticks, and powders. Clariant's studies show these molecules cut rinse-water volume and energy use while maintaining foaming sensory cues valued by consumers. North American and European shoppers pay premiums for such formats, encouraging BASF to widen its EcoBalanced betaine line that trims product carbon footprints by as much as 30% compared with petro-based counterparts. Rapid ingredient iteration and targeted marketing around water stewardship are preparing the surfactants market for sustained adoption once Asian consumers gravitate toward solid cleansers.
Shift to Bio-Based Feedstocks Enabled by C6-C12 Fatty-Acid Over-Supply
Indonesia's B35 biodiesel mandate and similar programs unlock abundant medium-chain fatty acids priced competitively with naphtha-based chains, tipping the economics toward renewable surfactant routes. European producers deploy biomass-balance approaches that substitute fossil carbon with renewable inputs without rebuilding assets, while Evonik's new rhamnolipid plant in Slovakia demonstrates scalable fermentation on European corn sugar. Policy drivers such as the EU's Deforestation-Free Regulation and Scope 3 carbon accounting sharpen the cost of staying fossil-based, edging synthetic incumbents in the surfactants industry toward mixed portfolios that better align with brand sustainability pledges.
Stringent PFAS Phase-Out Accelerating Reformulation Costs
Regulators in the EU and the United States have fast-tracked restrictions on per- and polyfluoroalkyl substances, directly affecting roughly 38% of current surfactant end-uses. DIC has already commercialized PFAS-free defoamers for electric vehicle lubricants that match the legacy performance envelope, but the required research and development investment raises unit costs across multiple downstream markets. Reformulation cascades force new stabilizer and processing regimes, stretching technical resources at smaller firms and accelerating consolidation. Early-moving suppliers able to certify compliance win preferred-vendor status even if price premiums persist, influencing the surfactants market.
Other drivers and restraints analyzed in the detailed report include:
- Rise of Enhanced-Oil-Recovery (EOR) Projects in MEA and China
- On-Site Fermentation of Sophorolipids at Contract Formulators
- Long-Chain Alcohol Volatility Linked to Biodiesel Policy Swings
For complete list of drivers and restraints, kindly check the Table Of Contents.
Segment Analysis
Anionic surfactants retained a commanding 47.80% surfactant market share in 2025 as linear alkylbenzene sulfonate (LAS) remained cost-effective and widely approved for household detergents. LAS volumes surpassed 4 million tons, benefiting from scale economies and established supply chains. However, amphoteric molecules such as betaines and amino oxides are projected to record a 4.30% CAGR, the fastest among all types, propelled by their mildness across pH ranges and ability to stabilize complex formulations in premium personal care. The surfactants market is already witnessing major players brandishing eco-certified betaines that secure higher margins while meeting retailer clean-beauty scorecards.
Cationic segments remain small but indispensable in fabric softening and antimicrobial quaternary blends, whereas silicone surfactants carve out niches in textile finishing, enhanced oil recovery, and high-stretch polyurethane foams where their spreadability outperforms carbon-based analogs.
The Surfactants Report is Segmented by Type (Anionic Surfactants, Cationic Surfactants, and More), Origin (Synthetic Surfactants and Bio-Based Surfactants), Application (Household Soap and Detergent, Personal Care, Lubricants and Fuel Additives, Industry and Institutional Cleaning, and More), and Geography (Asia-Pacific, North America, Europe, and More). The Market Forecasts are Provided in Terms of Volume (Tons).
Geography Analysis
Asia-Pacific held 48.40% of the total surfactants market share in 2025 and is projected to expand at a 4.24% CAGR to 2031, underpinned by China's dominant manufacturing base, India's rising middle class, and Southeast Asia's rapid urban migration. China alone supplies more than half of global LAS output, enabling aggressive pricing that feeds both domestic detergents and overseas exports.
The EU's deforestation-free sourcing rules and pending green-claim directives push brand owners to validate traceable feedstocks, bolstering biosurfactant pilots financed via corporate sustainability budgets. The United States emphasizes performance gains, particularly in concentrated laundry liquids and all-purpose wipes that trim packaging waste. Both regions bear the brunt of PFAS reformulation costs yet house the research hubs capable of fast-tracking compliant alternatives, reinforcing their roles as launch pads for next-generation chemistries that later migrate to emerging markets in the surfactants market.
Surfactant-polymer flooding campaigns in Abu Dhabi and Oman open premium avenues for high-temperature, high-salinity blends, while Nigeria and Kenya witness rising consumption of packaged detergents as urbanization accelerates. Brazil leverages its ample fatty-acid by-products from soy and sugarcane biofuels to back-integrate renewable surfactants, offering cost relief against foreign exchange volatility. Infrastructure gaps, logistics costs, and economic cycles remain hurdles, yet manufacturers partnering with local tollers and distributors mitigate exposure and deepen the surfactants market footprint.
- 3M
- Arkema
- Ashland
- BASF
- Bayer AG
- CEPSA
- Clariant
- Croda International Plc
- Dow
- Emery Oleochemicals
- Evonik Industries AG
- Galaxy Surfactants
- GEO
- Godrej Industries Limited
- Indorama Ventures Public Limited
- Innospec
- Kao Corporation
- KLK OLEO
- Lankem
- Lonza
- Nouryon
- P&G Chemicals
- Reliance Industries Limited
- SANYO CHEMICAL INDUSTRIES, LTD.
- Sasol Limited Group
- Sinopec (China Petrochemical Corporation)
- Syensqo
- Stepan Company
- Sulfatrade SA
- Sumitomo Chemical Co., Ltd.
- Taiwan NJC Corporation
- TENSAC
- YPF
Additional Benefits:
- The market estimate (ME) sheet in Excel format
- 3 months of analyst support
TABLE OF CONTENTS
1 Introduction
- 1.1 Study Assumptions and Market Definition
- 1.2 Scope of the Study
2 Research Methodology
3 Executive Summary
4 Market Landscape
- 4.1 Market Overview
- 4.2 Market Drivers
- 4.2.1 Growing demand for multifunctional mild surfactants in water-less personal-care formats
- 4.2.2 Boom in low-temperature laundry detergents demanding high-performance anionics
- 4.2.3 Shift to bio-based feedstocks enabled by C6-C12 fatty-acid over-supply
- 4.2.4 Rise of enhanced-oil-recovery (EOR) projects in MEA and China
- 4.2.5 On-site fermentation of sophorolipids at contract formulators
- 4.3 Market Restraints
- 4.3.1 Stringent PFAS phase-out accelerating reformulation costs
- 4.3.2 Long-chain alcohol volatility linked to biodiesel policy swings
- 4.3.3 Capacity additions in China triggering periodic price wars
- 4.4 Value Chain Analysis
- 4.5 Porter's Five Forces
- 4.5.1 Bargaining Power of Suppliers
- 4.5.2 Bargaining Power of Buyers
- 4.5.3 Threat of New Entrants
- 4.5.4 Threat of Substitutes
- 4.5.5 Degree of Competition
- 4.6 Pricing Analysis
5 Market Size and Growth Forecasts (Volume)
- 5.1 By Type
- 5.1.1 Anionic Surfactants
- 5.1.1.1 Linear Alkylbenzene Sulfonate (LAS or LABS)
- 5.1.1.2 Alcohol Ether Sulfates (AES)
- 5.1.1.3 Alpha Olefin Sulfonates (AOS)
- 5.1.1.4 Secondary Alkane Sulfonate (SAS)
- 5.1.1.5 Methyl Ester Sulfonates (MES)
- 5.1.1.6 Sulfosuccinates
- 5.1.1.7 Others (Lignosulfonates, etc.)
- 5.1.2 Cationic Surfactants
- 5.1.2.1 Quaternary ammonium compound
- 5.1.2.2 Others
- 5.1.3 Non-ionic Surfactants
- 5.1.3.1 Alcohol ethoxylate
- 5.1.3.2 Ethoxylated Alkyl-phenols
- 5.1.3.3 Fatty acid ester
- 5.1.3.4 Others
- 5.1.4 Amphoteric Surfactants
- 5.1.5 Silicone Surfactants
- 5.1.1 Anionic Surfactants
- 5.2 By Origin
- 5.2.1 Synthetic Surfactants
- 5.2.2 Bio-based Surfactants
- 5.3 By Application
- 5.3.1 Household Soap and Detergent
- 5.3.2 Personal Care
- 5.3.3 Lubricants and Fuel Additives
- 5.3.4 Industry and Institutional Cleaning
- 5.3.5 Food Processing
- 5.3.6 Oilfield Chemicals
- 5.3.7 Agricultural Chemicals
- 5.3.8 Textile Processing
- 5.3.9 Emulsion Polymerisation
- 5.3.10 Other Applications
- 5.4 By Geography
- 5.4.1 Asia-Pacific
- 5.4.1.1 China
- 5.4.1.2 India
- 5.4.1.3 Japan
- 5.4.1.4 South Korea
- 5.4.1.5 ASEAN
- 5.4.1.6 Rest of Asia-Pacific
- 5.4.2 North America
- 5.4.2.1 United States
- 5.4.2.2 Canada
- 5.4.2.3 Mexico
- 5.4.3 Europe
- 5.4.3.1 Germany
- 5.4.3.2 United Kingdom
- 5.4.3.3 France
- 5.4.3.4 Italy
- 5.4.3.5 Russia
- 5.4.3.6 Rest of Europe
- 5.4.4 South America
- 5.4.4.1 Brazil
- 5.4.4.2 Argentina
- 5.4.4.3 Rest of South America
- 5.4.5 Middle-East and Africa
- 5.4.5.1 Saudi Arabia
- 5.4.5.2 South Africa
- 5.4.5.3 Rest of Middle-East and Africa
- 5.4.1 Asia-Pacific
6 Competitive Landscape
- 6.1 Market Concentration
- 6.2 Strategic Moves
- 6.3 Market Share (%)/Ranking Analysis
- 6.4 Company Profiles (includes Global level Overview, Market level overview, Core Segments, Financials as available, Strategic Information, Market Rank/Share, Products and Services, Recent Developments)
- 6.4.1 3M
- 6.4.2 Arkema
- 6.4.3 Ashland
- 6.4.4 BASF
- 6.4.5 Bayer AG
- 6.4.6 CEPSA
- 6.4.7 Clariant
- 6.4.8 Croda International Plc
- 6.4.9 Dow
- 6.4.10 Emery Oleochemicals
- 6.4.11 Evonik Industries AG
- 6.4.12 Galaxy Surfactants
- 6.4.13 GEO
- 6.4.14 Godrej Industries Limited
- 6.4.15 Indorama Ventures Public Limited
- 6.4.16 Innospec
- 6.4.17 Kao Corporation
- 6.4.18 KLK OLEO
- 6.4.19 Lankem
- 6.4.20 Lonza
- 6.4.21 Nouryon
- 6.4.22 P&G Chemicals
- 6.4.23 Reliance Industries Limited
- 6.4.24 SANYO CHEMICAL INDUSTRIES, LTD.
- 6.4.25 Sasol Limited Group
- 6.4.26 Sinopec (China Petrochemical Corporation)
- 6.4.27 Syensqo
- 6.4.28 Stepan Company
- 6.4.29 Sulfatrade SA
- 6.4.30 Sumitomo Chemical Co., Ltd.
- 6.4.31 Taiwan NJC Corporation
- 6.4.32 TENSAC
- 6.4.33 YPF
7 Market Opportunities and Future Outlook
- 7.1 White-space and Unmet-need Assessment
 全球无 PFAS 离子界面活性剂市场(按产品类型、物理形态、应用、分销管道和终端用户行业划分)预测(2026-2032 年)全球无 PFAS 阴离子界面活性剂市场(按最终用途产业、产品类型、应用、形态、通路、原料来源和产业链长度划分)预测(2026-2032 年)全球无 PFAS 非离子界面活性剂市场(按类型、形态、应用和分销管道划分)预测(2026-2032 年)油田水泥防沉剂市场按类型、井型、几何形状、技术、压力等级、应用和终端用户划分,全球预测,2026-2032年溶剂型无 PFAS 界面活性剂市场按功能、产品等级、包装、销售管道和应用划分 - 全球预测,2026-2032 年
 界面活性剂市场分析及预测(至2035年):类型、产品、应用、剂型、材料类型、技术、最终用户、功能、製程、解决方案
 2026年全球界面活性剂市场报告
 界面活性剂市场规模、份额和趋势分析报告:按原材料、产品、应用、地区和细分市场预测(2026-2033 年)
 特种界面活性剂市场-全球产业规模、份额、趋势、机会、预测:按类型、应用、地区和竞争格局划分,2021-2031年Gemini界面活性剂市场按类型、形态、应用、最终用户和销售管道划分 - 全球预测(2026-2032年)