


 |
市场调查报告书
商品编码
1939630
企业伺服器:市场占有率分析、产业趋势与统计、成长预测(2026-2031 年)Enterprise Server - Market Share Analysis, Industry Trends & Statistics, Growth Forecasts (2026 - 2031) |
||||||
※ 本网页内容可能与最新版本有所差异。详细情况请与我们联繫。
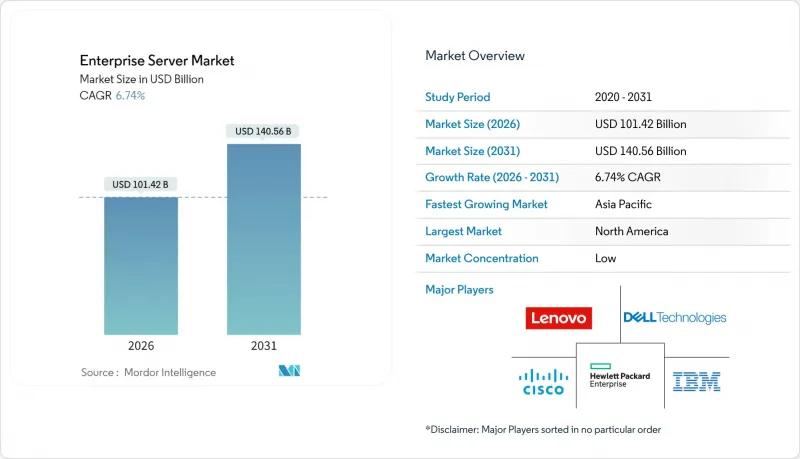
预计到 2025 年,企业伺服器市场规模将达到 950.2 亿美元,到 2031 年将达到 1,405.6 亿美元,高于 2026 年的 1,014.2 亿美元。
预计在预测期(2026-2031 年)内,复合年增长率将达到 6.74%。
人工智慧优化伺服器丛集订单创历史新高、混合云端采用率不断上升以及公共部门奖励策略支持大规模采购週期,共同推动了市场成长。超大规模超大规模资料中心业者、独立软体供应商和受监管企业正将资本规划重点放在支援训练和推理工作负载的高GPU密集型系统上,这项转变正在重塑组件供应链,并加速对液冷机架的需求。同时,5G赋能的边缘部署和微型资料中心正在扩大坚固耐用、低功耗伺服器的潜在市场。订阅定价模式也降低了企业在不大幅增加资本支出的情况下缩短更新週期的预算门槛。那些将自主研发晶片、高速互连和端到端生命週期服务相结合的供应商,正在从寻求承包人工智慧基础设施的买家手中抢占市场份额。
全球企业伺服器市场趋势与洞察
对人工智慧加速工作负载日益增长的需求正在重塑伺服器架构要求。
超大规模资料中心业者资料中心正在以GPU密集型系统取代传统的通用节点,这些系统每个机架可支援40-60kW的功率,大约是传统资料中心热负载的五倍。即使对于并非专门用于人工智慧的部署,企业采购也正在将液冷迴路、硅光电互连和高频宽记忆体作为标准,以增强未来人工智慧部署时间表变化的基础。电力消耗量的快速成长促使北维吉尼亚和都柏林的公用事业公司优先考虑其资料中心区域的电网升级,这为节能伺服器设计提供了监管支援。国家人工智慧安全框架鼓励买家建立能够在本地执行管治模式的基础设施,这创造了超出传统工作负载预测的需求,并将计算加速器的更新周期缩短至不到三年。
企业云端迁移加速混合基础架构投资
经营团队对应用可移植性的需求正在推动混合架构的发展,这种架构透过基础设施即程式码 (IaC) 管道将本地机架与多个公共云端连接起来。例如,HashiCorp 的自动化堆迭已成为企业在自有机架和租用的超大规模容量上寻求统一配置逻辑的事实标准控制平面。交付到这些环境中的伺服器配备了扩展的 PCIe 通道、双 100GbE 连接埠和内建身分验证模组,在混合边界的两侧提供统一的安全防护。 GDPR 下严格的资料居住规则迫使许多欧洲公司将有状态资料库部署在国内,而突发性分析作业则在海外可用区运行,这形成了一种混合采购模式,有利于那些提供一致的 BIOS、韧体和管理 API 的供应商。付费使用制进一步使伺服器支出与季节性计划负载保持一致,从而减少计划在淡季期间的损失。
伺服器虚拟化技术的成熟度限制了实体基础架构的扩展。
执行 VMware、KVM 和容器编排管理的公司通常会遇到 80-90% 的 CPU 使用率,这大大降低了为通用工作负载添加 x86 节点所带来的增量效益。一些金融机构已实现了旧有应用程式20:1 的整合比例,显着减少了实体空间和能源消耗。然而,由于 GPU共用技术尚未成熟,这种整合对于 AI 训练工作负载来说难以实现。各组织在维护隔离的加速器池的同时,尽量利用现有虚拟化资源,导致不同伺服器层级的需求不平衡。政府主导的节能政策,例如欧盟的生态设计法规,会对未充分利用的机架进行处罚,鼓励运转率充分利用。随着时间的推移,传统工作负载的这些效率提升将抵消 AI丛集带来的部分容量成长。
细分市场分析
到2025年,Linux将维持54.32%的市场份额,比四年前成长8个百分点,继续主导企业伺服器市场。开放原始码授权、容器相容性以及人工智慧框架管理机构的一流支持,预计将推动其复合年增长率达到6.88%。因此,Linux节点的企业伺服器市场规模成长速度将超过任何其他竞争作业系统,从而巩固其在私有云端和公共云端环境中的主导地位。在各个垂直产业中,Red Hat Enterprise Linux和Ubuntu LTS是推理领域部署最广泛的发行版,而Rocky Linux等强化衍生在法规环境中也越来越受欢迎。
在关键资料背后,Windows Server 仍然为 .NET 应用程式和依赖 Active Directory 的工作负载提供支持,但随着企业将单体系统重构为微服务架构,其市场份额正在下降。 UNIX 在高频交易和关键通讯交换等领域保持强大的市场地位,在这些领域,确定性 I/O 和经过认证的稳定性比现代化压力更为重要。展望未来,即将推出的下一代 Linux 核心中的机密运算扩展将为处理敏感 AI 模型权重的客户带来新的市场份额成长途径。
容量型伺服器仍将占据企业伺服器市场最大份额,预计到 2025 年将占出货量的 66.58%。然而,未来的成长预计将倾向于高端平台,复合年增长率 (CAGR) 为 7.02%。市场需求正呈现两极化:一方面是面向容器丛集的低成本、无状态运算,另一方面是配备八个或更多 GPU 的高阶节点,用于变压器模型训练。曾经面向 ERP 和资料库丛集的中阶配置正逐渐失去市场,因为这些工作负载正迁移到 SaaS 环境或更经济的横向扩展硬体上。
因此,OEM厂商的蓝图正在分化。大批量生产的型号整合了高效核心和E1.S快闪存,以实现高密度虚拟化,而高阶产品线则致力于PCIe CXL记忆体扩充和液冷快速断开连接器。契约製造製造商在大批量生产层面保持成本优势,而顶级厂商则透过捆绑韧体检验、安全认证和加速器保固服务来保障高性能层面的市场地位。资讯长们普遍预计,随着横向扩展和纵向扩展的采购週期差异越来越大,这种分化趋势将会加速。
区域分析
北美地区在2025年继续保持领先地位,成长率达37.35%,这主要得益于集中在亚利桑那州、爱荷华州和魁北克省的超大规模园区。儘管主要市场的库存年增43%,但北维吉尼亚的空置率低于1%,迫使租户在建设前两年就预订了容量。联邦政府的各项倡议,例如5000亿美元的「星门计画」(Stargate program),正在推动与能够根据《晶片资讯保护和资讯安全法案》(CHIPS Act)认证来源追踪的原始设备製造商(OEM)签订大规模主合约。为了满足单一站点250兆瓦的电力需求,区域性公用事业公司正在加强与营运商的合作,以重新利用未充分利用的发电容量,并将可再生能源购电协议(PPA)纳入伺服器总拥有成本(TCO)模型。
亚太地区成长最快,复合年增长率达7.38%,主要得益于北京的人工智慧国家战略以及东京、雪梨和首尔的建设热潮。新加坡严格的建筑法规促使建筑项目转移至柔佛和巴淡岛,而孟买的土地短缺则推动了模组化资料中心异地组合式的需求。本地云端服务供应商指定使用无气浸没式水箱以规避用水限制,并将支出转向预先认证主机板介电液相容性的供应商。印度和印尼的国家资料保护法进一步推动了采购本地化,并要求原始设备製造商(OEM)建立保税仓库设施以进行国内组装。儘管电力配额和碳排放税实施了更严格的PUE标准,但预计欧洲的需求仍将保持稳定成长。法兰克福都会区禁止新建设70兆瓦以上的项目,导致需求转移到黑森的农村地区。巴黎透过其《国家云宪章》,确保了以核能为基荷的零碳基本负载区,为欧洲买家提供了一种成本稳定的替代方案,以取代与天然气价格挂钩的电价。阿姆斯特丹取消了对资料中心建设的禁令,允许那些能够展示区域供热回收技术的计划获批。这项规定有利于将热水伺服器整合到住宅大楼热交换迴路中的供应商。在整个欧洲,节能硬体的增值税豁免政策正在抵消部署液冷机架的部分前期成本。
其他福利:
- Excel格式的市场预测(ME)表
- 3个月的分析师支持
目录
第一章 引言
- 研究假设和市场定义
- 调查范围
第二章调查方法
第三章执行摘要
第四章 市场情势
- 市场概览
- 市场驱动因素
- 对人工智慧加速工作负载的需求不断增长
- 企业云端迁移和混合云端策略
- 边缘运算与5G赋能的微型资料中心快速发展
- 基于营运成本的伺服器订阅和计量收费模式
- 透过使用液冷技术实现高机架密度
- 政府人工智慧基础设施奖励策略
- 市场限制
- 伺服器虚拟化和整合减少了已安装的实体机器数量。
- x86硬体价格下降和商品化
- GPU和硅光电组件供应链短缺
- 资料中心电力价格上涨和碳排放合规成本增加
- 产业生态系分析
- 宏观经济因素的影响
- 监管环境
- 技术展望
- 波特五力分析
- 供应商的议价能力
- 买方的议价能力
- 新进入者的威胁
- 替代品的威胁
- 竞争对手之间的竞争
第五章 市场规模与成长预测
- 按作业系统
- Linux
- Windows
- UNIX
- 其他作业系统(i5/OS、z/OS 等)
- 按伺服器类
- 高阶伺服器
- 中阶伺服器
- 低负载伺服器
- 按伺服器类型
- 刀刃
- 多节点
- 塔
- 机架优化
- 按最终用户行业划分
- IT/通讯
- 银行、金融服务和保险
- 製造业
- 零售
- 卫生保健
- 媒体与娱乐
- 其他终端用户产业
- 按地区
- 北美洲
- 我们
- 加拿大
- 墨西哥
- 南美洲
- 巴西
- 阿根廷
- 其他南美洲
- 欧洲
- 德国
- 义大利
- 英国
- 法国
- 西班牙
- 其他欧洲地区
- 亚太地区
- 中国
- 日本
- 印度
- 韩国
- 亚太其他地区
- 中东
- 沙乌地阿拉伯
- 阿拉伯聯合大公国
- 土耳其
- 其他中东地区
- 非洲
- 南非
- 奈及利亚
- 其他非洲地区
- 北美洲
第六章 竞争情势
- 市场集中度
- 策略趋势
- 市占率分析
- 公司简介
- Dell Technologies Inc.
- Super Micro Computer Inc.
- Hewlett Packard Enterprise Company
- Inspur Electronic Information Industry Co. Ltd.
- Lenovo Group Limited
- International Business Machines Corporation
- Cisco Systems Inc.
- Oracle Corporation
- Fujitsu Limited
- NEC Corporation
- Hitachi Ltd.
- Toshiba Corporation
- Unisys Corporation
- Quanta Computer Inc.
- Wiwynn Corporation
- Wistron Corporation
- Atos SE
- Huawei Technologies Co. Ltd.
- ZTE Corporation
- IEIT Systems Co. Ltd.
第七章 市场机会与未来展望
The enterprise server market was valued at USD 95.02 billion in 2025 and estimated to grow from USD 101.42 billion in 2026 to reach USD 140.56 billion by 2031, at a CAGR of 6.74% during the forecast period (2026-2031).
Growth stems from record orders for AI-optimized server clusters, rising hybrid-cloud adoption, and public-sector stimulus packages that underwrite large procurement cycles. Hyperscalers, independent software vendors, and regulated enterprises are aligning capital plans around GPU-dense systems that support training and inference workloads, a shift that is reshaping component supply chains and tipping demand toward liquid-cooled racks. Simultaneously, 5G-enabled edge deployments and micro-data centers are broadening the addressable base for ruggedized, low-power servers, while subscription pricing is easing budget hurdles for firms that want short refresh cycles without CapEx spikes. Vendors that combine in-house silicon, high-speed interconnects, and end-to-end lifecycle services are capturing wallet share as buyers seek turnkey AI infrastructure.
Global Enterprise Server Market Trends and Insights
Growing AI-Accelerated Workload Demand Reshapes Server Architecture Requirements
Hyperscalers are replacing conventional general-purpose nodes with GPU-dense systems that can support 40-60 kW per rack, roughly five times the thermal load seen in legacy data centers. Enterprise procurement now specifies liquid-cooling loops, silicon-photonics interconnects, and high-bandwidth memory as standard-even for deployments not earmarked for AI-in order to future-proof footprints against shifting AI adoption schedules. Power draw is escalating so quickly that utilities in Northern Virginia and Dublin are prioritizing grid upgrades for data-center zones, lending a regulatory tailwind to energy-efficient server designs. National AI safety frameworks encourage buyers to build infrastructure that can run governance models locally, driving demand beyond traditional workload forecasts and shortening refresh cycles to under three years for compute accelerators.
Enterprise Cloud Migration Accelerates Hybrid Infrastructure Investments
C-suite mandates for application portability are fueling hybrid architectures in which on-premises racks interoperate with multiple public clouds via infrastructure-as-code pipelines. HashiCorp's automation stack, for instance, has become a de-facto control plane for enterprises that want identical provisioning logic across their own racks and rented hyperscale capacity. Servers shipped into these estates ship with expanded PCIe lanes, dual 100 GbE ports, and embedded attestation modules so that the same security envelope covers both sides of the hybrid boundary. Strict data-residency rules under GDPR compel many European firms to place stateful databases on domestic soil, while burstable analytics jobs run in foreign availability zones, creating mixed procurement patterns that favor vendors offering consistent BIOS, firmware, and management APIs. Consumption-based pricing further aligns server spend with seasonal project loads, reducing write-offs when projects stall.
Server Virtualization Maturity Limits Physical Infrastructure Expansion
Enterprises running VMware, KVM, and container orchestration routinely hit 80-90% CPU utilization, slashing the incremental benefit of adding more x86 nodes for general workloads. Some banks report consolidation ratios of 20:1 for legacy applications, a feat that materially cuts real-estate and energy consumption. Yet AI training workloads resist such aggregation because GPU sharing is still nascent; organizations therefore maintain isolated accelerator pools while sweating existing virtualized fleets, resulting in uneven demand across server tiers. Government-backed energy-efficiency directives, such as the European Union's EcoDesign rules, reinforce capacity-stretching behavior by penalizing low-utilization racks. Over time, these efficiency gains in conventional workloads will offset a portion of the volume growth generated by AI clusters.
Other drivers and restraints analyzed in the detailed report include:
- Rapid Growth of Edge Computing and 5G Networks Drives Distributed Server Architectures
- OpEx-Based Server Subscription Models Transform Procurement Strategies
- Price Erosion and Hardware Commoditization Pressure Vendor Margins
For complete list of drivers and restraints, kindly check the Table Of Contents.
Segment Analysis
Linux retained a 54.32% foothold in 2025, a position eight points stronger than four years prior and equal to more than half of total enterprise server market share. Its open-source licensing, container compatibility, and first-class support from AI framework maintainers underpin a 6.88% forecast CAGR. The enterprise server market size devoted to Linux nodes will therefore expand faster than that of any rival OS cohort, cementing the platform's dominance for both private and public cloud estates. Across sectors, Red Hat Enterprise Linux and Ubuntu LTS remain the most-deployed variants for inference, while hardened derivatives such as Rocky Linux are gaining favor in regulated environments.
Behind the headline numbers, Windows Server still anchors workloads tethered to .NET applications and Active Directory but is losing share where firms are rewriting monoliths into microservices. UNIX retains durable niches in high-frequency trading and critical telecom exchanges where deterministic I/O and certified stability outweigh modernization pressures. Looking ahead, confidential computing extensions arriving in the next Linux kernel will give the platform another lever for share capture among customers handling sensitive AI model weights.
Volume class machines accounted for 66.58% of shipments in 2025, the single largest slice of enterprise server market size, yet forward growth tilts toward high-end platforms at 7.02% CAGR. Demand is coalescing around two extremes: low-cost, stateless compute for container farms and premium nodes equipped with eight or more GPUs for transformer model training. Mid-range configurations that once served ERP and database clusters are becoming less relevant as those workloads either move to SaaS environments or migrate onto cheaper scale-out hardware.
Consequently, OEM roadmaps now bifurcate: volume units integrate efficiency cores and E1.S flash for dense virtualization, whereas high-end lines target PCIe CXL memory expansion and liquid-coolant quick-disconnects. Contract manufacturers hold a cost advantage in the volume tier, but tier-one vendors defend the performance layer by bundling firmware validation, security attestation, and guaranteed accelerator allocations. The prevailing view among CIOs is that scale-out and scale-up purchase cycles will diverge further, reinforcing the two-track dynamic.
The Enterprise Server Market Report is Segmented by Operating System (Linux, Windows, UNIX, and More), Server Class (High-End Server, Mid-Range Server, and Volume Server), Server Type (Blade, Multi-Node, Tower, and Rack Optimized), End-User Vertical (IT and Telecommunication, BFSI, Manufacturing, Retail, Healthcare, Media and Entertainment, and More), and Geography. The Market Forecasts are Provided in Terms of Value (USD).
Geography Analysis
North America kept its 37.35% lead in 2025, propelled by hyperscale campuses clustering in Arizona, Iowa, and Quebec. Inventory across the region's primary markets expanded 43% year over year, yet vacancy slid below 1% in Northern Virginia, forcing tenants to pre-lease capacity two years ahead of fit-out. Federal initiatives such as the USD 500 billion Stargate program funnel large master contracts to OEMs that can certify origin tracking under CHIPS Act guardrails. Regional utilities, grappling with 250 MW single-site requests, are partnering with operators on stranded-generation reclamation, weaving renewable PPAs into server TCO models.
Asia Pacific is the fastest-growing theater at 7.38% CAGR, buoyed by Beijing's sovereign AI mandates and a construction wave across Tokyo, Sydney, and Seoul. Tight moratoria in Singapore divert builds to Johor and Batam, while Mumbai's land-bank constraints propel interest in modular, stackable data halls assembled off-site. Local-language cloud providers are specifying air-free immersion tanks to sidestep water-usage caps, a move that shifts spend toward vendors pre-qualifying motherboards for dielectric fluids. National data-protection statutes in India and Indonesia further localize procurement, requiring OEMs to establish bonded warehouse facilities for in-country assembly. Europe contributes steady incremental demand, albeit under the shadow of power-usage quotas and carbon levies that impose stricter PUE thresholds than any other region. Frankfurt's metro ring now prohibits new 70 MW-plus builds within city limits, pushing overspill into Hesse's rural districts. Paris, backed by a sovereign cloud charter, is underwriting zero-carbon zones fueled by nuclear baseload, giving European buyers a cost-stable alternative to natural-gas-pegged tariffs. Amsterdam lifts its data-center pause only for projects demonstrating district-heating recovery, a rule that favors vendors integrating warm-water servers into heat-exchange loops for residential blocks. Across the continent, VAT exemptions on energy-efficient hardware partially offset the upfront premium of liquid-cooled racks.
- Dell Technologies Inc.
- Super Micro Computer Inc.
- Hewlett Packard Enterprise Company
- Inspur Electronic Information Industry Co. Ltd.
- Lenovo Group Limited
- International Business Machines Corporation
- Cisco Systems Inc.
- Oracle Corporation
- Fujitsu Limited
- NEC Corporation
- Hitachi Ltd.
- Toshiba Corporation
- Unisys Corporation
- Quanta Computer Inc.
- Wiwynn Corporation
- Wistron Corporation
- Atos SE
- Huawei Technologies Co. Ltd.
- ZTE Corporation
- IEIT Systems Co. Ltd.
Additional Benefits:
- The market estimate (ME) sheet in Excel format
- 3 months of analyst support
TABLE OF CONTENTS
1 INTRODUCTION
- 1.1 Study Assumptions and Market Definition
- 1.2 Scope of the Study
2 RESEARCH METHODOLOGY
3 EXECUTIVE SUMMARY
4 MARKET LANDSCAPE
- 4.1 Market Overview
- 4.2 Market Drivers
- 4.2.1 Growing AI-accelerated workload demand
- 4.2.2 Enterprise cloud migration and hybrid cloud strategies
- 4.2.3 Rapid growth of edge computing and 5G-enabled micro data centers
- 4.2.4 Opex-based server subscription and consumption models
- 4.2.5 Adoption of liquid cooling enabling higher rack densities
- 4.2.6 Government AI infrastructure stimulus programs
- 4.3 Market Restraints
- 4.3.1 Server virtualization and consolidation reducing physical installs
- 4.3.2 Price erosion and commoditization of x86 hardware
- 4.3.3 Supply-chain shortages for GPUs and silicon-photonics components
- 4.3.4 Rising data-center energy tariffs and carbon-compliance costs
- 4.4 Industry Ecosystem Analysis
- 4.5 Impact of Macroeconomic Factors
- 4.6 Regulatory Landscape
- 4.7 Technological Outlook
- 4.8 Porter's Five Forces Analysis
- 4.8.1 Bargaining Power of Suppliers
- 4.8.2 Bargaining Power of Buyers
- 4.8.3 Threat of New Entrants
- 4.8.4 Threat of Substitutes
- 4.8.5 Intensity of Competitive Rivalry
5 MARKET SIZE AND GROWTH FORECASTS (VALUE)
- 5.1 By Operating System
- 5.1.1 Linux
- 5.1.2 Windows
- 5.1.3 UNIX
- 5.1.4 Other Operating System (i5/OS, z/OS, etc.)
- 5.2 By Server Class
- 5.2.1 High-end Server
- 5.2.2 Mid-range Server
- 5.2.3 Volume Server
- 5.3 By Server Type
- 5.3.1 Blade
- 5.3.2 Multi-node
- 5.3.3 Tower
- 5.3.4 Rack Optimized
- 5.4 By End-user Vertical
- 5.4.1 IT and Telecommunication
- 5.4.2 Banking, Financial Services and Insurance
- 5.4.3 Manufacturing
- 5.4.4 Retail
- 5.4.5 Healthcare
- 5.4.6 Media and Entertainment
- 5.4.7 Other End-user Verticals
- 5.5 By Geography
- 5.5.1 North America
- 5.5.1.1 United States
- 5.5.1.2 Canada
- 5.5.1.3 Mexico
- 5.5.2 South America
- 5.5.2.1 Brazil
- 5.5.2.2 Argentina
- 5.5.2.3 Rest of South America
- 5.5.3 Europe
- 5.5.3.1 Germany
- 5.5.3.2 Italy
- 5.5.3.3 United Kingdom
- 5.5.3.4 France
- 5.5.3.5 Spain
- 5.5.3.6 Rest of Europe
- 5.5.4 Asia Pacific
- 5.5.4.1 China
- 5.5.4.2 Japan
- 5.5.4.3 India
- 5.5.4.4 South Korea
- 5.5.4.5 Rest of Asia Pacific
- 5.5.5 Middle East
- 5.5.5.1 Saudi Arabia
- 5.5.5.2 United Arab Emirates
- 5.5.5.3 Turkey
- 5.5.5.4 Rest of Middle East
- 5.5.6 Africa
- 5.5.6.1 South Africa
- 5.5.6.2 Nigeria
- 5.5.6.3 Rest of Africa
- 5.5.1 North America
6 COMPETITIVE LANDSCAPE
- 6.1 Market Concentration
- 6.2 Strategic Moves
- 6.3 Market Share Analysis
- 6.4 Company Profiles (includes Global level Overview, Market level overview, Core Segments, Financials as available, Strategic Information, Market Rank/Share for key companies, Products and Services, and Recent Developments)
- 6.4.1 Dell Technologies Inc.
- 6.4.2 Super Micro Computer Inc.
- 6.4.3 Hewlett Packard Enterprise Company
- 6.4.4 Inspur Electronic Information Industry Co. Ltd.
- 6.4.5 Lenovo Group Limited
- 6.4.6 International Business Machines Corporation
- 6.4.7 Cisco Systems Inc.
- 6.4.8 Oracle Corporation
- 6.4.9 Fujitsu Limited
- 6.4.10 NEC Corporation
- 6.4.11 Hitachi Ltd.
- 6.4.12 Toshiba Corporation
- 6.4.13 Unisys Corporation
- 6.4.14 Quanta Computer Inc.
- 6.4.15 Wiwynn Corporation
- 6.4.16 Wistron Corporation
- 6.4.17 Atos SE
- 6.4.18 Huawei Technologies Co. Ltd.
- 6.4.19 ZTE Corporation
- 6.4.20 IEIT Systems Co. Ltd.
7 MARKET OPPORTUNITIES AND FUTURE OUTLOOK
- 7.1 White-Space and Unmet-Need Assessment


