


 |
市场调查报告书
商品编码
1939730
公用事业计费软体:市场占有率分析、产业趋势与统计、成长预测(2026-2031 年)Utility Billing Software - Market Share Analysis, Industry Trends & Statistics, Growth Forecasts (2026 - 2031) |
||||||
※ 本网页内容可能与最新版本有所差异。详细情况请与我们联繫。
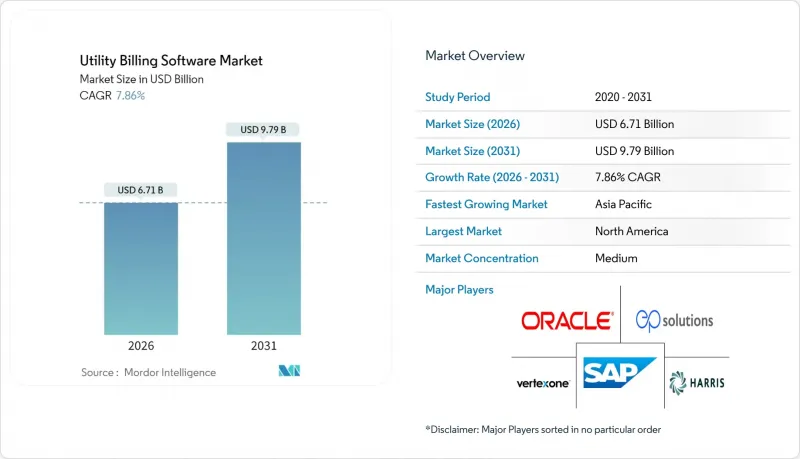
2025 年公用事业计费软体市场价值为 62.2 亿美元,预计到 2031 年将达到 97.9 亿美元,高于 2026 年的 67.1 亿美元。
预计在预测期(2026-2031 年)内,复合年增长率将达到 7.86%。
严格的监管时间表、加速推进的智慧电网计划以及淘汰传统大型主机的压力,正推动着对现代平台的持续投资。云端优先部署策略、弹性分析工作负载以及近乎即时的计费引擎,正助力市政公用事业公司和投资者所有的公共产业快速采用供应商产品。 VertexOne 近期的资金筹措和收购热潮,体现了行业整合活动,也显示私募股权对公用事业计费软体市场日益增长的信心。同时,公共产业面临日益严峻的网路风险,安全功能已从可选附加功能提升为核心采购标准。对电力、水、燃气和通讯服务统一计费的需求,进一步扩大了平台供应商的潜在基本客群。
全球公用事业计费软体市场趋势与洞察
增加对智慧电网/AMI实施的投资
高级计量基础设施 (AMI) 专案透过向公共产业提供传统批量处理系统无法处理的大量高频用电数据,创造了持续的平台需求。光是印度的配电产业转型计画就设定了到 2026 年安装 2.5 亿套 AMI 系统的目标,并承诺投入 150 亿美元。设计-建造-资金筹措-营运-拥有-移交 (DBFOOT) 模式将资本风险转移给服务供应商,并确保公用事业计费软体市场获得持续的 SaaS 收入。每个住宅智慧电錶每年产生超过 35,000 次测量数据,迫使公共产业优先考虑弹性可扩展的云端原生计费引擎。
快速过渡到云端优先的公用事业 IT 架构
2025财年第二季度, Oracle的云端营收年增24%,达到59亿美元,这主要得益于公共产业将其客户资讯系统和定价引擎迁移到多租户SaaS环境。云端框架将新收费系统的引进週期从数月缩短至数週,这在监管机构核准动态分时电价时是一项关键优势。更低的预付成本使中型地方政府公用事业公司能够获得以前只有私人公司才能使用的高级功能,从而将公用事业收费软体市场扩展到更多客户群。
初始整合和资料迁移成本高昂
改造旧式客户资讯系统 (CIS) 通常会消耗计划预算的 40% 到 60%,需要清理数十年的记录并调整系统架构。客户数量少于 5 万的小规模公共缺乏专职 IT 人员,不得不依赖外部顾问,导致总实施成本增加一倍。除非采用基于订阅的 SaaS 解决方案来抵消这些成本障碍,否则这些成本障碍会延缓现代化进程。而这种趋势又会将成本从资本支出转移到营运预算。
细分市场分析
预计到2025年,云端平台将占公用事业计费软体市场收入的43.62%,并在2031年之前以13.52%的复合年增长率成长,巩固其作为公用事业计费软体市场关键成长引擎的地位。大规模投资者拥有的公共产业仍然依赖本地部署,但由于现有资料中心投资的沉没成本,其扩展能力受到限制。混合部署作为一种桥樑架构,使受监管的公共产业能够在公共云端上扩展计量资料处理,同时保护本地的敏感客户资料。
成本弹性以及始终保持最新功能是市政公用事业公司转向SaaS的原因。 MuniBilling报告称,供水事业务部门对无需硬体更新周期即可实现即时报告的需求日益增长。 OracleOracle基础设施2025财年52%的营收成长显示企业级市场发展势头强劲,并巩固了超大规模超大规模资料中心业者在公用事业计费软体市场的地位。
到2025年,电力分销公司将占总收入的40.41%,这反映出旧有系统的复杂性以及强制性的智慧电网投资。同时,随着5G网路的普及,市场对将数据、语音和能源服务整合到单一帐单中的收费系统的需求不断增长,通讯业者将以12.71%的复合年增长率推动成长。由于智慧电錶的普及速度较慢,供水事业的发展相对落后,但其升级需求仍稳定。
最初为通讯业者开发的即时计费引擎(例如Neural Technologies的平台)现在正被改造以支援分时收费系统,从而扩展了其功能范围。随着各行业营运商对统一客户体验的需求日益增长,这种融合正在推动公用事业计费软体产业的发展。
区域分析
到2025年,北美将占全球收入的37.62%,这主要得益于其完善的法规结构以及由电网资产老化驱动的更新週期。智慧电錶的广泛应用和各州逐步出台的透明度规则将维持高支出水准。加拿大的全国性电錶更新计画和墨西哥的电力分配产业改革正在推动需求成长,但美国仍然是核心收入来源。创业投资流入数位化优先供应商,证明了该地区的成熟度及其对自身能力发展蓝图的巨大影响力。
亚太地区以10.02%的复合年增长率实现最快成长,主要得益于印度2.5亿电錶计画和中国以人工智慧为核心的电网现代化。政府主导的资金筹措机制降低了采购门槛,而紧迫的时间表则加快了竞标数量的成长。日本的关税自由化和澳洲屋顶太阳能的蓬勃发展将进一步扩大环太平洋地区的公用事业收费软体市场。
在欧洲,随着可再生能源渗透率的不断提高以及遵守《一般资料保护规则》(GDPR) 的实施,公用事业公司正面临持续的升级需求。德国、荷兰和北欧国家广泛开展的产消者付费和V2G(车辆到电网)试点项目,增加了收费操作的复杂性。严格的隐私法规延长了采购週期,但有利于拥有认证资料处理流程的现有供应商,从而增强了它们的竞争优势。
其他福利:
- Excel格式的市场预测(ME)表
- 3个月的分析师支持
目录
第一章 引言
- 研究假设和市场定义
- 调查范围
第二章调查方法
第三章执行摘要
第四章 市场情势
- 市场概览
- 市场驱动因素
- 传统计费系统和IT基础设施改进
- 增加对智慧电网/AMI实施的投资
- 快速过渡到云端优先的公共产业IT 架构
- 对明细化和近乎即时计费的合规压力
- 「产消者」的兴起和V2G支付要求
- 利用基于人工智慧的异常检测减少非技术性损失
- 市场限制
- 中小公共产业缺乏数位技能
- 初始整合和资料迁移成本高昂
- 网路安全和资料隐私风险日益加剧
- 工会抄表员的劳工抵抗
- 价值/供应链分析
- 监管环境
- 技术展望
- 波特五力分析
- 供应商的议价能力
- 买方的议价能力
- 新进入者的威胁
- 替代品的威胁
- 激烈的竞争
- 定价分析
第五章 市场规模与成长预测
- 透过部署模式
- 本地部署
- 云
- 杂交种
- 按最终用户行业划分
- 供水事业
- 电力和配电
- 天然气业务
- 沟通
- 地方政府公用事业多服务计费
- 按公用事业类型
- 电力
- 自来水厂
- 气体
- 区域供暖和製冷
- 透过计费功能模组
- 客户资讯系统(CIS)
- 计量资料管理(MDM)
- 支付处理和债务催收
- 分析与报告
- 费用和费率管理
- 按公司规模
- 投资者所有的公共产业(IOU)
- 地方政府/合作公共产业
- 私人零售能源供应商
- 按地区
- 北美洲
- 我们
- 加拿大
- 墨西哥
- 欧洲
- 德国
- 英国
- 法国
- 俄罗斯
- 其他欧洲
- 亚太地区
- 中国
- 日本
- 印度
- 韩国
- 澳洲
- 亚太其他地区
- 中东和非洲
- 中东
- 沙乌地阿拉伯
- 阿拉伯聯合大公国
- 其他中东地区
- 非洲
- 南非
- 埃及
- 其他非洲地区
- 中东
- 南美洲
- 巴西
- 阿根廷
- 北美洲
第六章 竞争情势
- 市场集中度
- 策略趋势
- 市占率分析
- 公司简介
- Oracle Corporation
- SAP SE
- Hansen Technologies Limited
- N. Harris Computer Corporation
- VertexOne, LLC
- Tyler Technologies, Inc.
- EnergyCAP, LLC
- Bynry Technologies Pvt. Ltd.
- Starnik Systems, Inc.
- MuniBilling, LLC
- Gentrack Group Limited
- Itineris NV
- Fluentgrid Limited
- Open International LLC
- Paymentus Holdings, Inc.
- ePsolutions, Inc.
- Utilibill Pty. Ltd.
- Jayhawk Software, Inc.
- Banyon Data Systems, Inc.
- Exceleron Software, Inc.
第七章 市场机会与未来趋势
- 閒置频段与未满足需求评估
The utility billing software market was valued at USD 6.22 billion in 2025 and estimated to grow from USD 6.71 billion in 2026 to reach USD 9.79 billion by 2031, at a CAGR of 7.86% during the forecast period (2026-2031).
Tight regulatory timelines, accelerating smart-grid programs, and pressure to retire legacy mainframes propel sustained investments in modern platforms. Cloud-first deployment strategies, elastic analytics workloads, and near-real-time tariff engines underpin rapid vendor adoption among both municipal and investor-owned utilities. Consolidation activity-exemplified by VertexOne's recent financing and acquisition spree-signals growing private-equity confidence in the utility billing software market. At the same time, utilities confront mounting cyber-risk exposures that elevate security features from optional extras to core buying criteria. Demand for convergent billing across electricity, water, gas, and telecom services further widens the addressable base for platform vendors.
Global Utility Billing Software Market Trends and Insights
Growing Investment in Smart-Grid / AMI Roll-outs
Advanced metering infrastructure programs generate sustained platform demand by flooding utilities with high-frequency usage data that legacy batch systems cannot manage. India's Revamped Distribution Sector Scheme alone targets 250 million installations by 2026, supported by USD 15 billion investment commitments. The design-build-finance-operate-own-transfer model shifts capital risk to service providers, guaranteeing recurring SaaS revenue streams for the utility billing software market. Each residential smart meter produces more than 35,000 readings annually, forcing utilities to favor cloud-native billing engines that scale elastically.
Rapid Shift Toward Cloud-First Utility IT Architectures
Oracle's cloud revenue climbed to USD 5.9 billion in Q2 FY2025-up 24% year on year-as utilities migrate customer information systems and tariff engines into multi-tenant SaaS environments. Cloud frameworks shorten new-tariff launch cycles from months to weeks, a critical advantage when regulators approve dynamic time-of-use pricing. Lower upfront costs enable mid-sized municipal utilities to access feature depth once reserved for investor-owned enterprises, expanding the utility billing software market footprint among long-tail customers.
High Upfront Integration and Data-Migration Costs
Legacy CIS conversion often consumes 40-60% of project budgets because decades-old records require cleansing and schema alignment. Small public-power utilities serving fewer than 50 000 customers lack dedicated IT staff, pushing them toward external consultants that double total implementation expense. These cost hurdles delay modernization unless offset by subscription-based SaaS alternatives, a trend that nonetheless shifts expense from capital to operating budgets.
Other drivers and restraints analyzed in the detailed report include:
- Compliance Pressure for Itemised, Near-Real-Time Billing
- AI-Based Anomaly Detection Reducing Non-Technical Losses
- Escalating Cyber-Security and Data-Privacy Risks
For complete list of drivers and restraints, kindly check the Table Of Contents.
Segment Analysis
Cloud platforms captured 43.62% of 2025 revenue and will post a 13.52% CAGR to 2031, underscoring their status as the primary growth engine for the utility billing software market. On-premise implementations persist among large investor-owned utilities with sunk-cost datacenters, yet expansion remains muted. Hybrid rollouts act as bridge architectures, allowing regulated utilities to protect sensitive customer data on-premise while scaling meter-data crunching in public clouds.
Cost elasticity and always-current feature sets explain why municipal operators pivot toward SaaS. MuniBilling reports rising demand from water districts seeking real-time reporting without hardware refresh cycles. Oracle Cloud Infrastructure's 52% revenue jump in fiscal 2025 illustrates enterprise-scale migration momentum, reinforcing the role of hyperscalers in the utility billing software market.
Electricity distributors held 40.41% revenue share in 2025, reflecting legacy complexity and mandatory smart-grid investments. Telecommunications utilities, however, lead growth at 12.71% CAGR as 5G rollouts demand convergent charging systems that reconcile data, voice, and energy services on a single invoice. Water utilities trail due to slower smart-meter penetration, but present stable replacement demand.
Real-time rating engines originally built for telcos-such as Neural Technologies' platform-are now repurposed for time-of-use energy tariffs, widening addressable functionality. This convergence bolsters the utility billing software industry as cross-sector operators seek unified customer journeys.
The Utility Billing Software Market Report is Segmented by Deployment Mode (On-Premise, Cloud, Hybrid), End-User Industry (Water Utilities, and More), Utility Type (Electricity, Water, and More), Billing-Function Module (Customer Information System, Meter Data Management, and More), Organisation Size (Investor-Owned Utilities, Municipal, and More), and Geography. The Market Forecasts are Provided in Terms of Value (USD).
Geography Analysis
North America generated 37.62% of global revenue in 2025, anchored by advanced regulatory frameworks and aging grid assets that mandate upgrade cycles. Widespread smart-meter penetration and state-specific transparency rules keep spending elevated. Canada's nationwide meter refresh and Mexico's distribution-sector reforms add incremental demand, though the United States remains the core revenue pool. Venture capital inflows into digital-first vendors underscore the region's maturity and its outsized influence on functional roadmaps.
Asia-Pacific posts the fastest growth at 10.02% CAGR, propelled by India's 250 million-meter program and China's AI-centric grid modernization. Government-led funding mechanisms lower procurement barriers, while aggressive timelines accelerate tender volumes. Japan's tariff liberalization and Australia's rooftop solar boom further expand the utility billing software market across the Pacific Rim.
Europe delivers steady replacement demand as utilities integrate high renewable penetration and comply with GDPR. Extensive prosumer settlements and vehicle-to-grid pilots in Germany, the Netherlands, and the Nordics elevate billing complexity. Stringent privacy rules lengthen procurement cycles but favor established vendors with certified data processes, fortifying competitive moats.
- Oracle Corporation
- SAP SE
- Hansen Technologies Limited
- N. Harris Computer Corporation
- VertexOne, LLC
- Tyler Technologies, Inc.
- EnergyCAP, LLC
- Bynry Technologies Pvt. Ltd.
- Starnik Systems, Inc.
- MuniBilling, LLC
- Gentrack Group Limited
- Itineris NV
- Fluentgrid Limited
- Open International LLC
- Paymentus Holdings, Inc.
- ePsolutions, Inc.
- Utilibill Pty. Ltd.
- Jayhawk Software, Inc.
- Banyon Data Systems, Inc.
- Exceleron Software, Inc.
Additional Benefits:
- The market estimate (ME) sheet in Excel format
- 3 months of analyst support
TABLE OF CONTENTS
1 INTRODUCTION
- 1.1 Study Assumptions and Market Definition
- 1.2 Scope of the Study
2 RESEARCH METHODOLOGY
3 EXECUTIVE SUMMARY
4 MARKET LANDSCAPE
- 4.1 Market Overview
- 4.2 Market Drivers
- 4.2.1 Improvement in legacy billing systems and IT infrastructure
- 4.2.2 Growing investment in smart-grid / AMI roll-outs
- 4.2.3 Rapid shift toward cloud-first utility IT architectures
- 4.2.4 Compliance pressure for itemised, near-real-time billing
- 4.2.5 Rise of "prosumer" and V2G settlement requirements
- 4.2.6 AI-based anomaly detection reducing non-technical losses
- 4.3 Market Restraints
- 4.3.1 Digital-skills gap at small and mid-size utilities
- 4.3.2 High upfront integration and data-migration costs
- 4.3.3 Escalating cyber-security and data-privacy risks
- 4.3.4 Workforce resistance from unionised meter-reading staff
- 4.4 Value / Supply-Chain Analysis
- 4.5 Regulatory Landscape
- 4.6 Technological Outlook
- 4.7 Porter's Five Forces Analysis
- 4.7.1 Bargaining Power of Suppliers
- 4.7.2 Bargaining Power of Buyers
- 4.7.3 Threat of New Entrants
- 4.7.4 Threat of Substitutes
- 4.7.5 Intensity of Rivalry
- 4.8 Pricing Analysis
5 MARKET SIZE AND GROWTH FORECASTS (VALUE)
- 5.1 By Deployment Mode
- 5.1.1 On-premise
- 5.1.2 Cloud
- 5.1.3 Hybrid
- 5.2 By End-user Industry
- 5.2.1 Water Utilities
- 5.2.2 Electricity and Power Distribution
- 5.2.3 Gas Utilities
- 5.2.4 Telecommunications
- 5.2.5 Multi-service Municipal Utilities
- 5.3 By Utility Type
- 5.3.1 Electricity
- 5.3.2 Water
- 5.3.3 Gas
- 5.3.4 District Heating and Cooling
- 5.4 By Billing-Function Module
- 5.4.1 Customer Information System (CIS)
- 5.4.2 Meter Data Management (MDM)
- 5.4.3 Payment Processing and Collections
- 5.4.4 Analytics and Reporting
- 5.4.5 Tariff and Rate Management
- 5.5 By Organisation Size
- 5.5.1 Investor-Owned Utilities (IOU)
- 5.5.2 Municipal / Cooperative Utilities
- 5.5.3 Private Retail Energy Providers
- 5.6 By Geography
- 5.6.1 North America
- 5.6.1.1 United States
- 5.6.1.2 Canada
- 5.6.1.3 Mexico
- 5.6.2 Europe
- 5.6.2.1 Germany
- 5.6.2.2 United Kingdom
- 5.6.2.3 France
- 5.6.2.4 Russia
- 5.6.2.5 Rest of Europe
- 5.6.3 Asia-Pacific
- 5.6.3.1 China
- 5.6.3.2 Japan
- 5.6.3.3 India
- 5.6.3.4 South Korea
- 5.6.3.5 Australia
- 5.6.3.6 Rest of Asia-Pacific
- 5.6.4 Middle East and Africa
- 5.6.4.1 Middle East
- 5.6.4.1.1 Saudi Arabia
- 5.6.4.1.2 United Arab Emirates
- 5.6.4.1.3 Rest of Middle East
- 5.6.4.2 Africa
- 5.6.4.2.1 South Africa
- 5.6.4.2.2 Egypt
- 5.6.4.2.3 Rest of Africa
- 5.6.4.1 Middle East
- 5.6.5 South America
- 5.6.5.1 Brazil
- 5.6.5.2 Argentina
- 5.6.1 North America
6 COMPETITIVE LANDSCAPE
- 6.1 Market Concentration
- 6.2 Strategic Moves
- 6.3 Market Share Analysis
- 6.4 Company Profiles (includes Global-level overview, Market-level overview, Core segments, Financials as available, Strategic information, Market rank/share, Products and services, Recent developments)
- 6.4.1 Oracle Corporation
- 6.4.2 SAP SE
- 6.4.3 Hansen Technologies Limited
- 6.4.4 N. Harris Computer Corporation
- 6.4.5 VertexOne, LLC
- 6.4.6 Tyler Technologies, Inc.
- 6.4.7 EnergyCAP, LLC
- 6.4.8 Bynry Technologies Pvt. Ltd.
- 6.4.9 Starnik Systems, Inc.
- 6.4.10 MuniBilling, LLC
- 6.4.11 Gentrack Group Limited
- 6.4.12 Itineris NV
- 6.4.13 Fluentgrid Limited
- 6.4.14 Open International LLC
- 6.4.15 Paymentus Holdings, Inc.
- 6.4.16 ePsolutions, Inc.
- 6.4.17 Utilibill Pty. Ltd.
- 6.4.18 Jayhawk Software, Inc.
- 6.4.19 Banyon Data Systems, Inc.
- 6.4.20 Exceleron Software, Inc.
7 MARKET OPPORTUNITIES AND FUTURE TRENDS
- 7.1 White-space and Unmet-Need Assessment
 2026年全球公用事业计费软体市场报告2026年全球线上收费系统市场报告
 租户计费软体市场:按解决方案类型、产业和部署模式划分,全球预测(2026-2032年)融合收费软体和服务市场:按部署方式、组织规模和最终用户划分 - 全球预测,2026-2032 年直流计费电錶市场:按计费方式、电錶技术、连接技术、相型和应用划分-全球预测,2026-2032年
 融合计费软体和服务市场规模、份额和成长分析:按组件、部署模式、组织规模、最终用户和地区划分-2026-2033年产业预测
 线上收费系统市场分析及预测(至2035年):按类型、产品类型、服务、技术、组件、应用、部署类型、最终用户、功能和解决方案划分
 公用事业收费计费软体市场报告:按部署模式、类型、最终用户和地区划分,2026-2034 年按组件、租户类型、部署类型、服务供应商、应用程式和最终用途分類的分錶计费软体市场,全球预测,2026-2032 年2025年全球自动定期收费市场报告